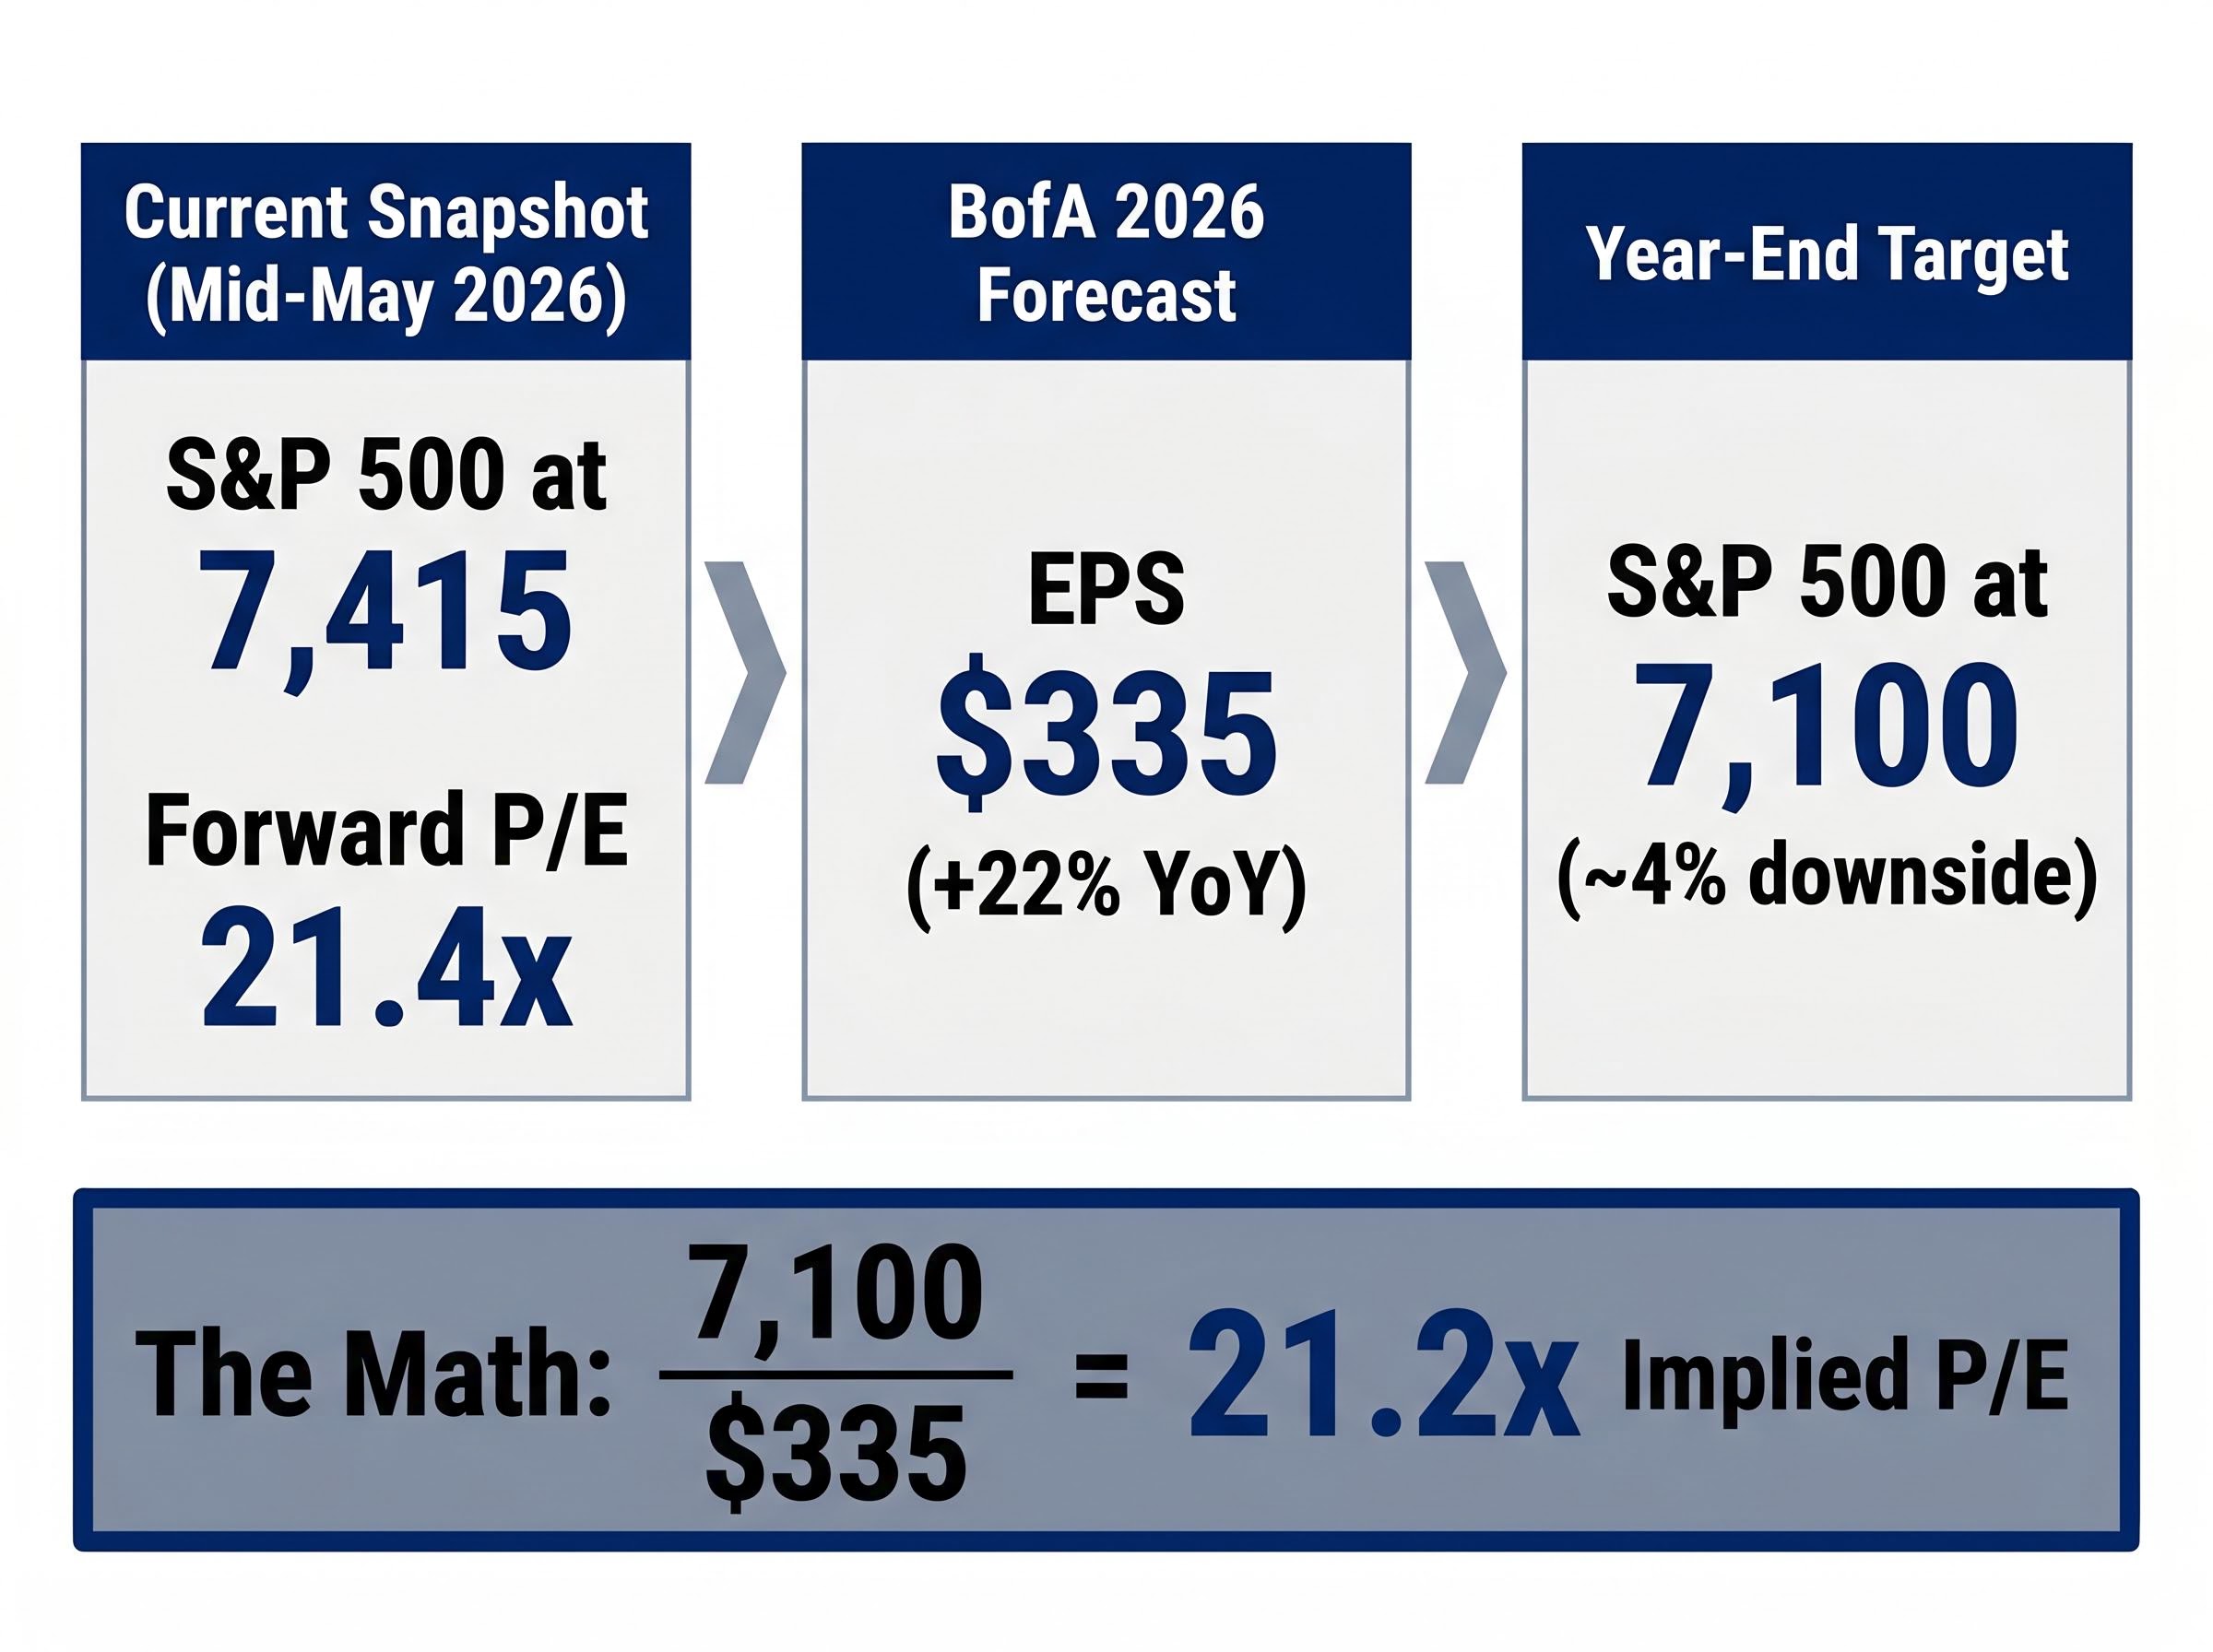
Bank of America just raised its 2026 S&P 500 earnings forecast by enough to imply 22% profit growth, and then left its year-end price target exactly where it was: at 7,100, roughly 4% below where the index trades today.
That gap is not an oversight. It reflects a deliberate analytical stance from BofA strategist Savita Subramanian, writing in mid-May 2026 as the S&P 500 sits at approximately 7,415 with a forward price-to-earnings ratio (P/E) of 21.4x. The move places BofA in a distinct camp among Wall Street’s largest banks. Goldman Sachs sees modest upside. Morgan Stanley expects steeper downside. BofA sits in between on price, yet above everyone on earnings, a combination that only makes sense once the valuation arithmetic is unpacked.
What follows is an examination of the logic inside that contradiction, an explanation of why record-high consensus growth expectations may actually signal future disappointment, and an outline of which sectors BofA believes can hold up in an expensive market where earnings need to do all the heavy lifting.
BofA raised earnings but held the line on price: here is why that is not a contradiction
The three numbers that define BofA’s stance are straightforward. The logic connecting them is the story.
- 2026 EPS estimate: $335, implying approximately 22% year-over-year earnings growth
- Year-end S&P 500 target: 7,100 (unchanged through mid-May 2026)
- Implied downside from current levels: approximately 4%, with the index at 7,415
At first glance, raising earnings while holding a below-market price target looks contradictory. It is not. The arithmetic resolves the puzzle: dividing a 7,100 price target by a $335 EPS estimate produces an implied year-end P/E of approximately 21.2x. That figure is lower than the current forward P/E of 21.4x, meaning Subramanian expects investors to pay slightly less per dollar of earnings by December than they do today.
The valuation argument beneath the earnings upgrade
This is not a call against profits. It is a call against the price investors will pay for those profits. BofA is effectively saying that earnings growth of 22% is real, plausible, and already embedded in current prices, so the index has nowhere to go but sideways or down unless multiples expand further. The upgrade is a warning dressed in optimism: growth is coming, but the market has already charged admission.
When big ASX news breaks, our subscribers know first
How broadly expensive the market looks across BofA’s full valuation framework
A single elevated P/E ratio can be rationalised. Perhaps margins are structurally higher, or interest rates justify a richer multiple. Subramanian’s framework does not rely on a single metric.
BofA’s internal valuation model assesses the S&P 500 as expensive on 16 of 20 metrics, according to Subramanian’s May 2026 research. That breadth transforms the valuation concern from a debatable data point into a pervasive signal.
The S&P 500’s forward 12-month P/E stands at 21.4x, per FactSet Earnings Insight (May 2026), compared to a 10-year historical average of approximately 17.8x, representing a roughly 20% premium to historical norms that sits at the heart of BofA’s cautious price target even as its earnings estimate climbs.
The S&P 500’s forward 12-month P/E stands at 21.4x, per FactSet Earnings Insight (May 2026), compared to a 10-year historical average of approximately 17.8x. That gap represents a roughly 20% premium to historical norms.
| Valuation Lens | Current Reading | Historical Benchmark |
|---|---|---|
| Forward 12-month P/E | 21.4x | 17.8x (10-year average) |
| BofA internal metrics showing elevated | 16 of 20 | Fewer than 10 at historical median |
| March 2026 level vs. current | ~7,415 (modest decline from ~7,530) | No material derating despite pullback |
The index finished 31 March 2026 at approximately 7,530, described at the time as trading near its most expensive levels of the past decade. The subsequent decline to 7,415 represents a modest pullback, not a meaningful repricing. The valuation problem has not been solved by the retreat; it has simply become slightly less acute.
Investors wanting to stress-test these numbers against a wider set of frameworks will find our dedicated guide to US equity valuation signals in 2026 useful; it examines the Buffett Indicator at 223.6%, the equity earnings yield versus Treasury yield spread, and Berkshire Hathaway’s $373 billion cash reserve as three independent lines of evidence that converge on the same overvaluation conclusion.
Why record-high growth expectations are a warning, not a green light
Intuition says that high earnings growth expectations should be bullish. If companies are going to grow profits faster, equities should be worth more. Subramanian’s core contrarian argument inverts that logic.
Consensus long-term S&P 500 growth expectations have risen to 16%, the highest since 2021, according to Subramanian’s May 2026 research. A price-to-earnings-to-growth (PEG) ratio, which measures how much investors pay per unit of expected growth, has fallen below its long-term average as growth estimates surge. Statistically, the market looks “cheap on growth” even as absolute multiples remain stretched.
The problem is what happens next. Historically, when optimism peaks, realised returns disappoint.
- BlackRock Investment Institute (November 2025): When five-year consensus growth expectations exceeded 14%, the S&P 500 delivered a median five-year annualised return of just 3%, compared to 8% when expectations sat between 8% and 12%.
- Morgan Stanley’s Mike Wilson (April 2026): Peaks in long-term growth expectations preceded below-average returns, with early 2000 and 2021 cited as direct analogues.
- Barclays (March 2026): Consensus EPS growth above 10% for three consecutive years has rarely coincided with starting valuations above the 85th percentile without subsequent multiple compression.
When five-year consensus growth expectations exceeded 14%, the S&P 500 delivered a median five-year annualised return of just 3%, according to BlackRock Investment Institute analysis.
JPMorgan’s cross-asset strategy team reinforced this pattern in January 2026, noting that equity markets tend to underperform when consensus long-term EPS growth exceeds 13% with valuations at or above the 80th percentile of history.
Where Goldman and Citi see it differently
Not every major bank shares the contrarian framing. Goldman Sachs’ David Kostin has described the market as “rich but reasonable,” arguing that AI-driven productivity gains and stronger corporate balance sheets make prior-peak comparisons less applicable. Citigroup’s Scott Chronert holds a similar view, expecting earnings to “catch up” to prices rather than prices falling to meet earnings. Both acknowledge stretched multiples but contend this cycle’s structural profit dynamics warrant a higher baseline.
The anatomy of the Wall Street target split at 7,415
The spread of year-end targets across the five largest bank strategists is itself a diagnostic tool. At the S&P 500’s current level of approximately 7,415, the distribution reveals which firms are genuinely bearish, which are constructively neutral, and where the analytical disagreements actually sit.
| Firm | Strategist | 2026 EPS Estimate | Year-End Target | Implied Move vs. 7,415 |
|---|---|---|---|---|
| Morgan Stanley | Mike Wilson | $305 | 6,800 | -8% |
| Bank of America | Savita Subramanian | $335 | 7,100 | -4% |
| JPMorgan | Dubravko Lakos-Bujas | $310 | 7,250 | -2% |
| Citigroup | Scott Chronert | $315 | 7,600 | +2% |
| Goldman Sachs | David Kostin | $320 | 7,800 | +5% |
Three of five major bank targets now imply negative returns from the S&P 500’s current level, making downside the modal call among Wall Street’s largest strategy desks.
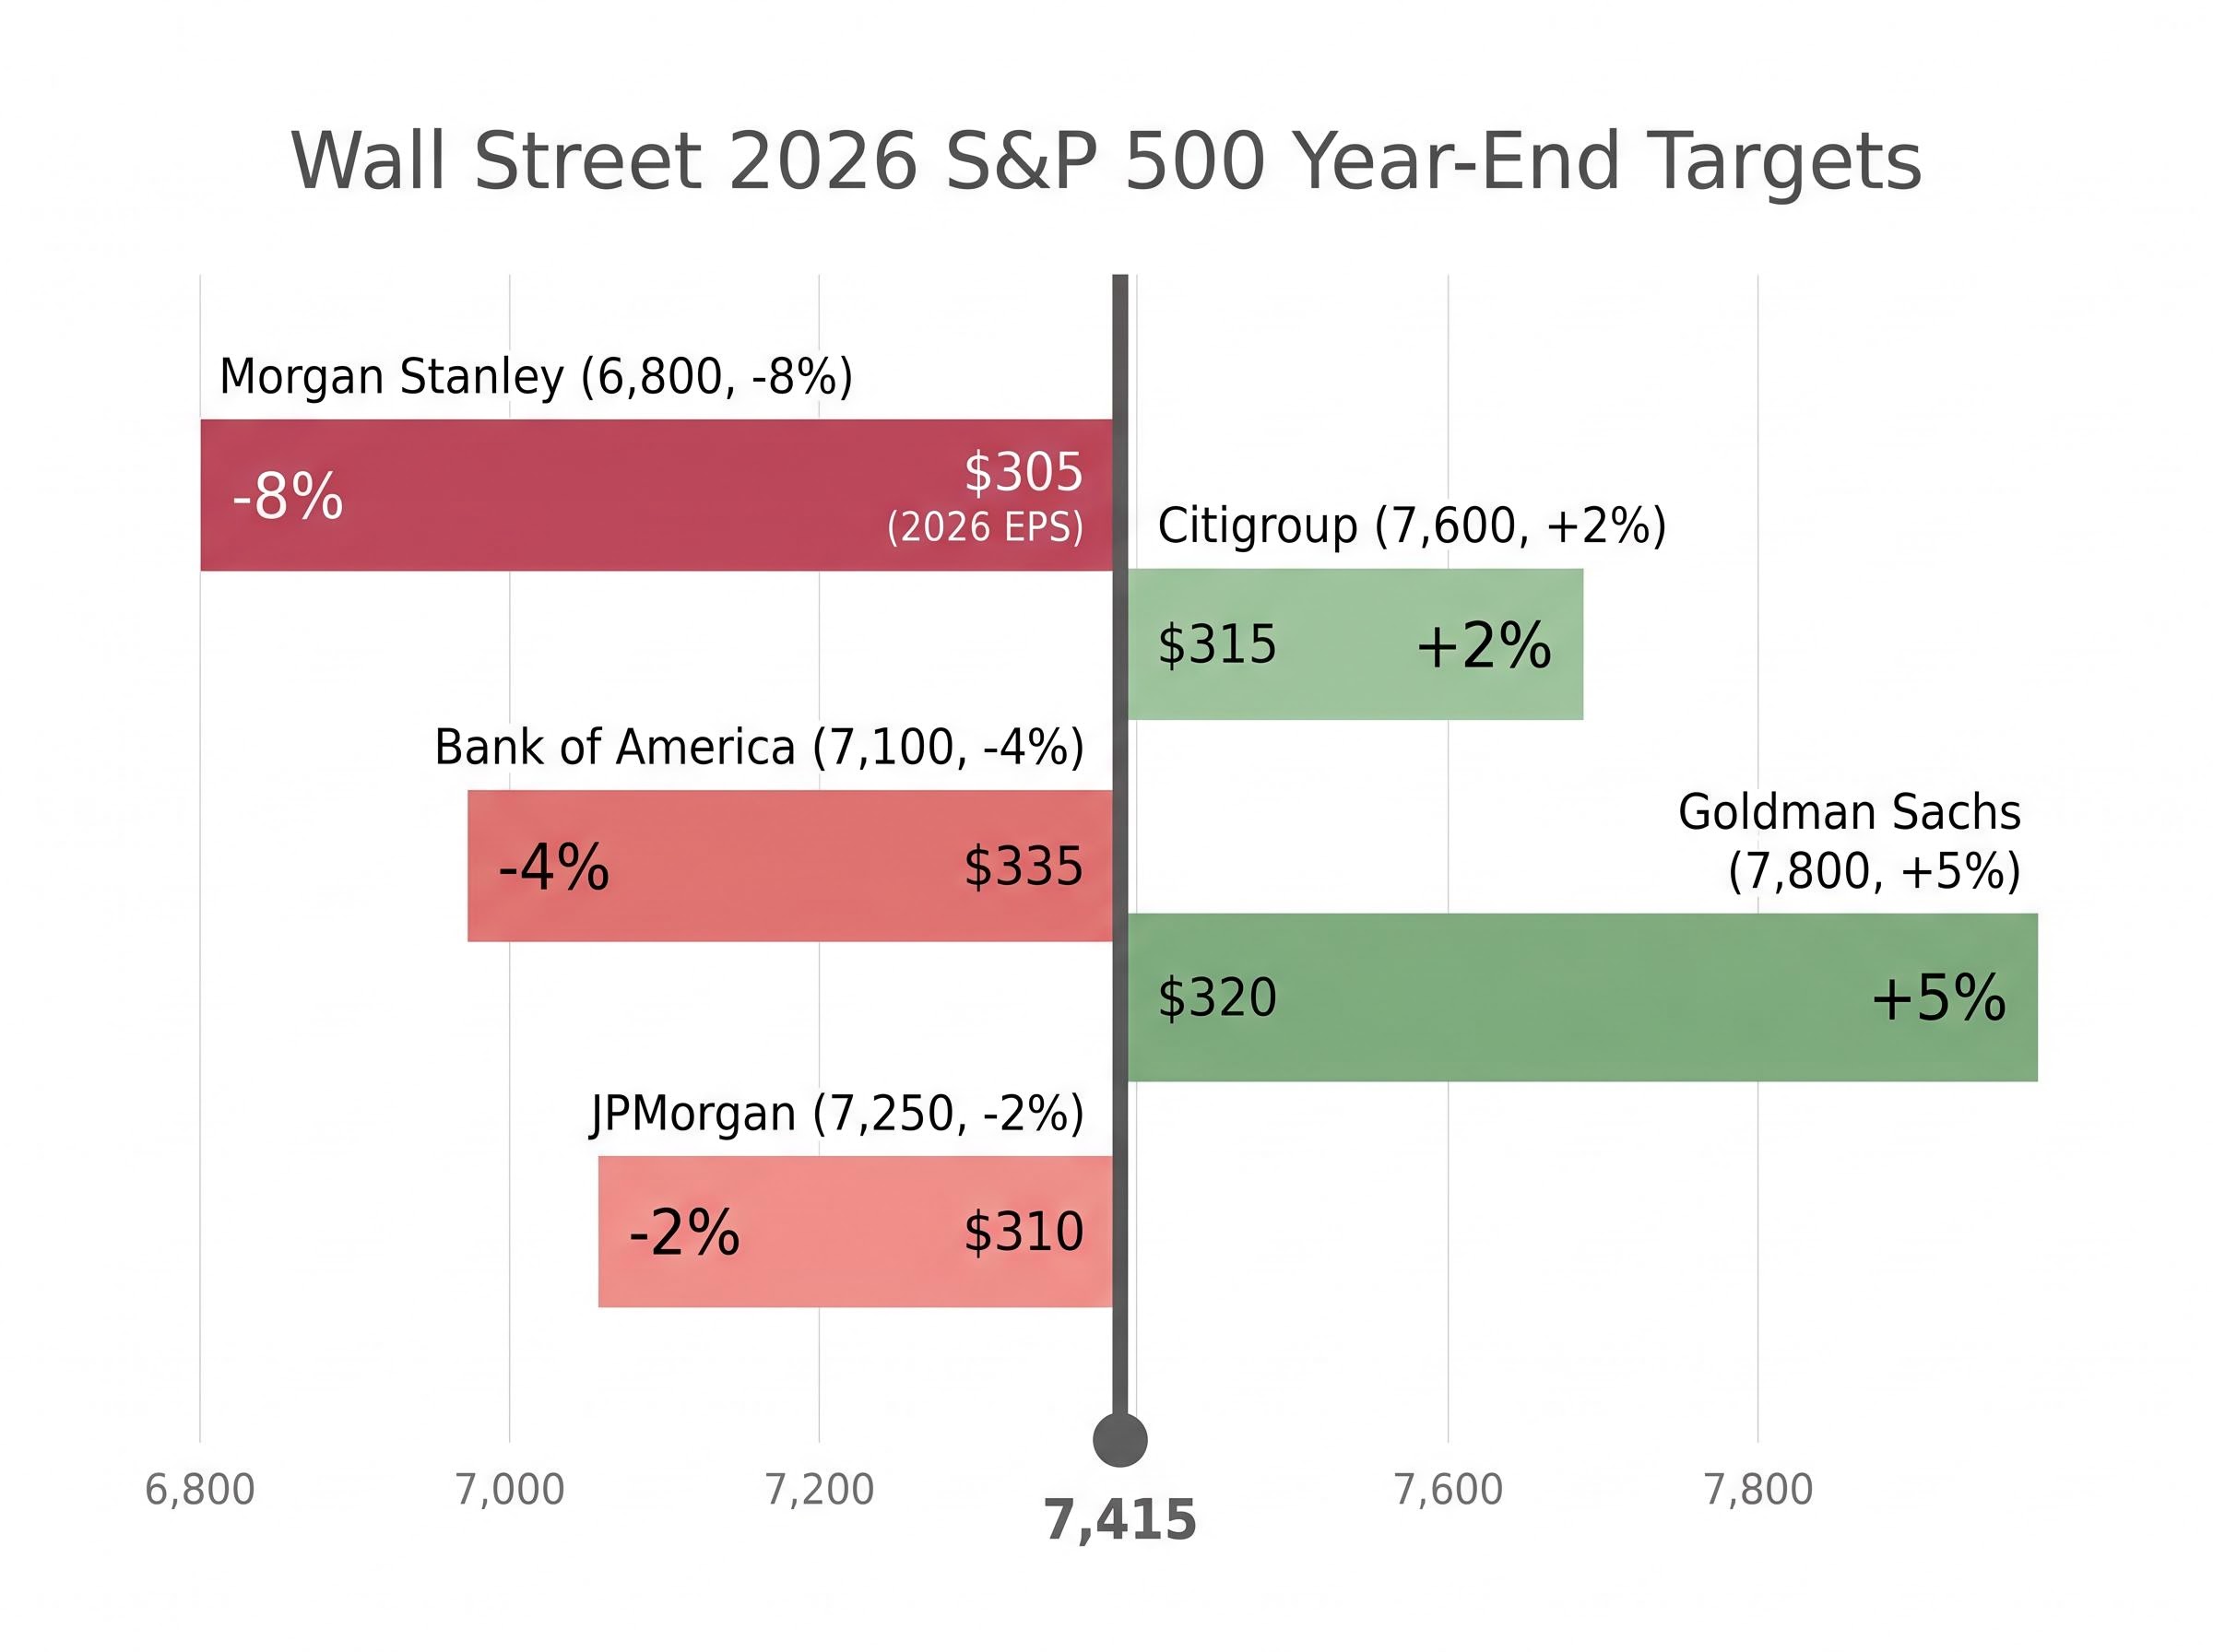
The EPS estimate spread runs from $305 (Morgan Stanley) to $335 (BofA), a range of just $30, or roughly 10%. The price target spread, however, runs from 6,800 to 7,800, a gap of 1,000 points, or approximately 15%. The disagreement is fundamentally about multiples, not earnings growth rates. Every firm expects profits to grow. The question is what investors will pay for that growth once it arrives.
RBC Capital Markets has taken a structurally different approach to the same problem, separating bifurcated AI and non-AI earnings into distinct forecast tracks and applying a 7.5% downward adjustment to non-AI profits while holding AI-segment estimates at consensus, producing a $329 per share Q1 2027 EPS estimate that sits below BofA’s $335 but implies a higher trailing multiple.
Semiconductors versus software, and what BofA’s sector split reveals about the broader strategy
BofA’s strategy is not simply bearish on equities. It is making precise distinctions between where earnings revision momentum justifies exposure and where it does not. The semiconductor-versus-software divergence illustrates the logic.
Semiconductors sit in BofA’s top five sector rankings despite being widely labelled expensive, according to Subramanian’s May 2026 research. Software ranks in the bottom third despite being widely viewed as cheap. The distinction is grounded in earnings fundamentals, not sentiment.
| Sector | 2026 EPS Growth | Free Cash Flow Signal | BofA Ranking |
|---|---|---|---|
| Semiconductors | Over 20% (AI capex-driven) | Near recent historical highs | Top five |
| Software | Approximately 3% | Near multi-year lows | Bottom third |
| Consumer Staples | Stable | Resilient | Preferred over discretionary |
| Consumer Discretionary | Under pressure | Layoff-exposed revenue base | Underweight |
The performance gap in 2026 has been stark. Reuters reported on 29 April 2026 that the S&P 500 Semiconductor index was up approximately 32% year-to-date, while Software and Services had gained just 7%, a spread of roughly 25 percentage points.
BofA applies three criteria to its sector selection framework:
- Earnings revision direction: Semiconductors have seen upward EPS revisions of more than 20% in 2026, driven by AI capital expenditure guidance. Software has stalled at 3% growth.
- Free cash flow yield: Semiconductor free cash flow yield sits at recent highs. Software free cash flow yield is near multi-year lows.
- Current positioning versus prior cycle peaks: Active long-only overweight in semiconductors stands at approximately 20%, well below the 2017 peak of 40% overweight, suggesting room for further allocation.
The defensive tilt toward consumer staples over discretionary connects to a separate thesis. BofA Institute card-spending data, summarised by Bloomberg in February 2026, showed that households in zip codes heavily exposed to technology employment experienced a noticeable slowdown in discretionary spending from late 2025 into early 2026. Subramanian explicitly cited concentration of job cuts among higher-paid tech and white-collar workers as a structural headwind to discretionary retailers.
When earnings and price targets diverge, the signal is the gap itself
BofA is not contradicting itself. It is making a precise statement: 22% earnings growth is real, plausible, and already priced in. The market needs multiple compression to correct for stretched valuations even as profits grow. BofA’s own model implies an approximately 6% decline when applying historical relationships between current growth forecasts and forward returns, according to Subramanian’s May 2026 analysis.
The conditions that would make the cautious call wrong:
- Multiple expansion sustained by AI productivity materialising faster than expected
- Real rate declines that justify higher P/E premiums above the current 21.4x
- Earnings growth significantly beating the already-elevated $335 EPS estimate
The conditions that would validate it:
- A deceleration in earnings relative to the elevated 16% consensus growth expectation
- Any upward movement in real rates
- A rotation from growth to value that compresses tech-heavy index multiples
JPMorgan’s Dubravko Lakos-Bujas has noted that “multiple expansion has front-loaded a lot of the upside from AI and margin improvements, leaving less room for error if earnings growth undershoots.”
UBS’ Mark Haefele offered a softer version of the same underlying argument in April 2026, noting that investors should be prepared for periods of sideways movement as earnings grow into stretched valuations.
The case for selectivity over index exposure in a market priced for precision
The central tension is clear. Earnings growth is real, meaningful, and broadly expected at rates not seen since 2021. It is also already embedded in prices that leave little margin for error. The forward P/E of 21.4x represents a roughly 20% premium to the 10-year average. The burden of future returns rests squarely on continued earnings beats rather than any contribution from multiple expansion.
BofA’s response to this environment is not to exit equities. It is to be precise: favour sectors with earnings revision momentum, such as semiconductors, and defensive characteristics, such as consumer staples, over sectors with deteriorating fundamentals and layoff-exposed revenue bases. The disconnect between BofA’s earnings upgrade and its unchanged price target is a feature of this analysis, not a flaw.
As of 18 May 2026, with the S&P 500 at 7,415, three of five major strategists forecast negative returns from current levels. Diversification across the index is less protective than it appears when the modal call from the largest strategy desks is negative. Sector and quality selection becomes the more durable risk management tool. History suggests that peaks in consensus optimism, now at 16% long-term growth expectations, tend to resolve through disappointment rather than outperformance.
Cap-weighted index exposure to the S&P 500 has, in practice, become an unintentional bet on the continuation of the AI growth narrative: strip out technology and the index’s approximately 10% year-to-date gain shrinks to roughly 3%, a seven-percentage-point gap that makes diversification across the full index considerably less protective than the headline return implies.
This article is for informational purposes only and should not be considered financial advice. Investors should conduct their own research and consult with financial professionals before making investment decisions. Past performance does not guarantee future results. Financial projections are subject to market conditions and various risk factors.