
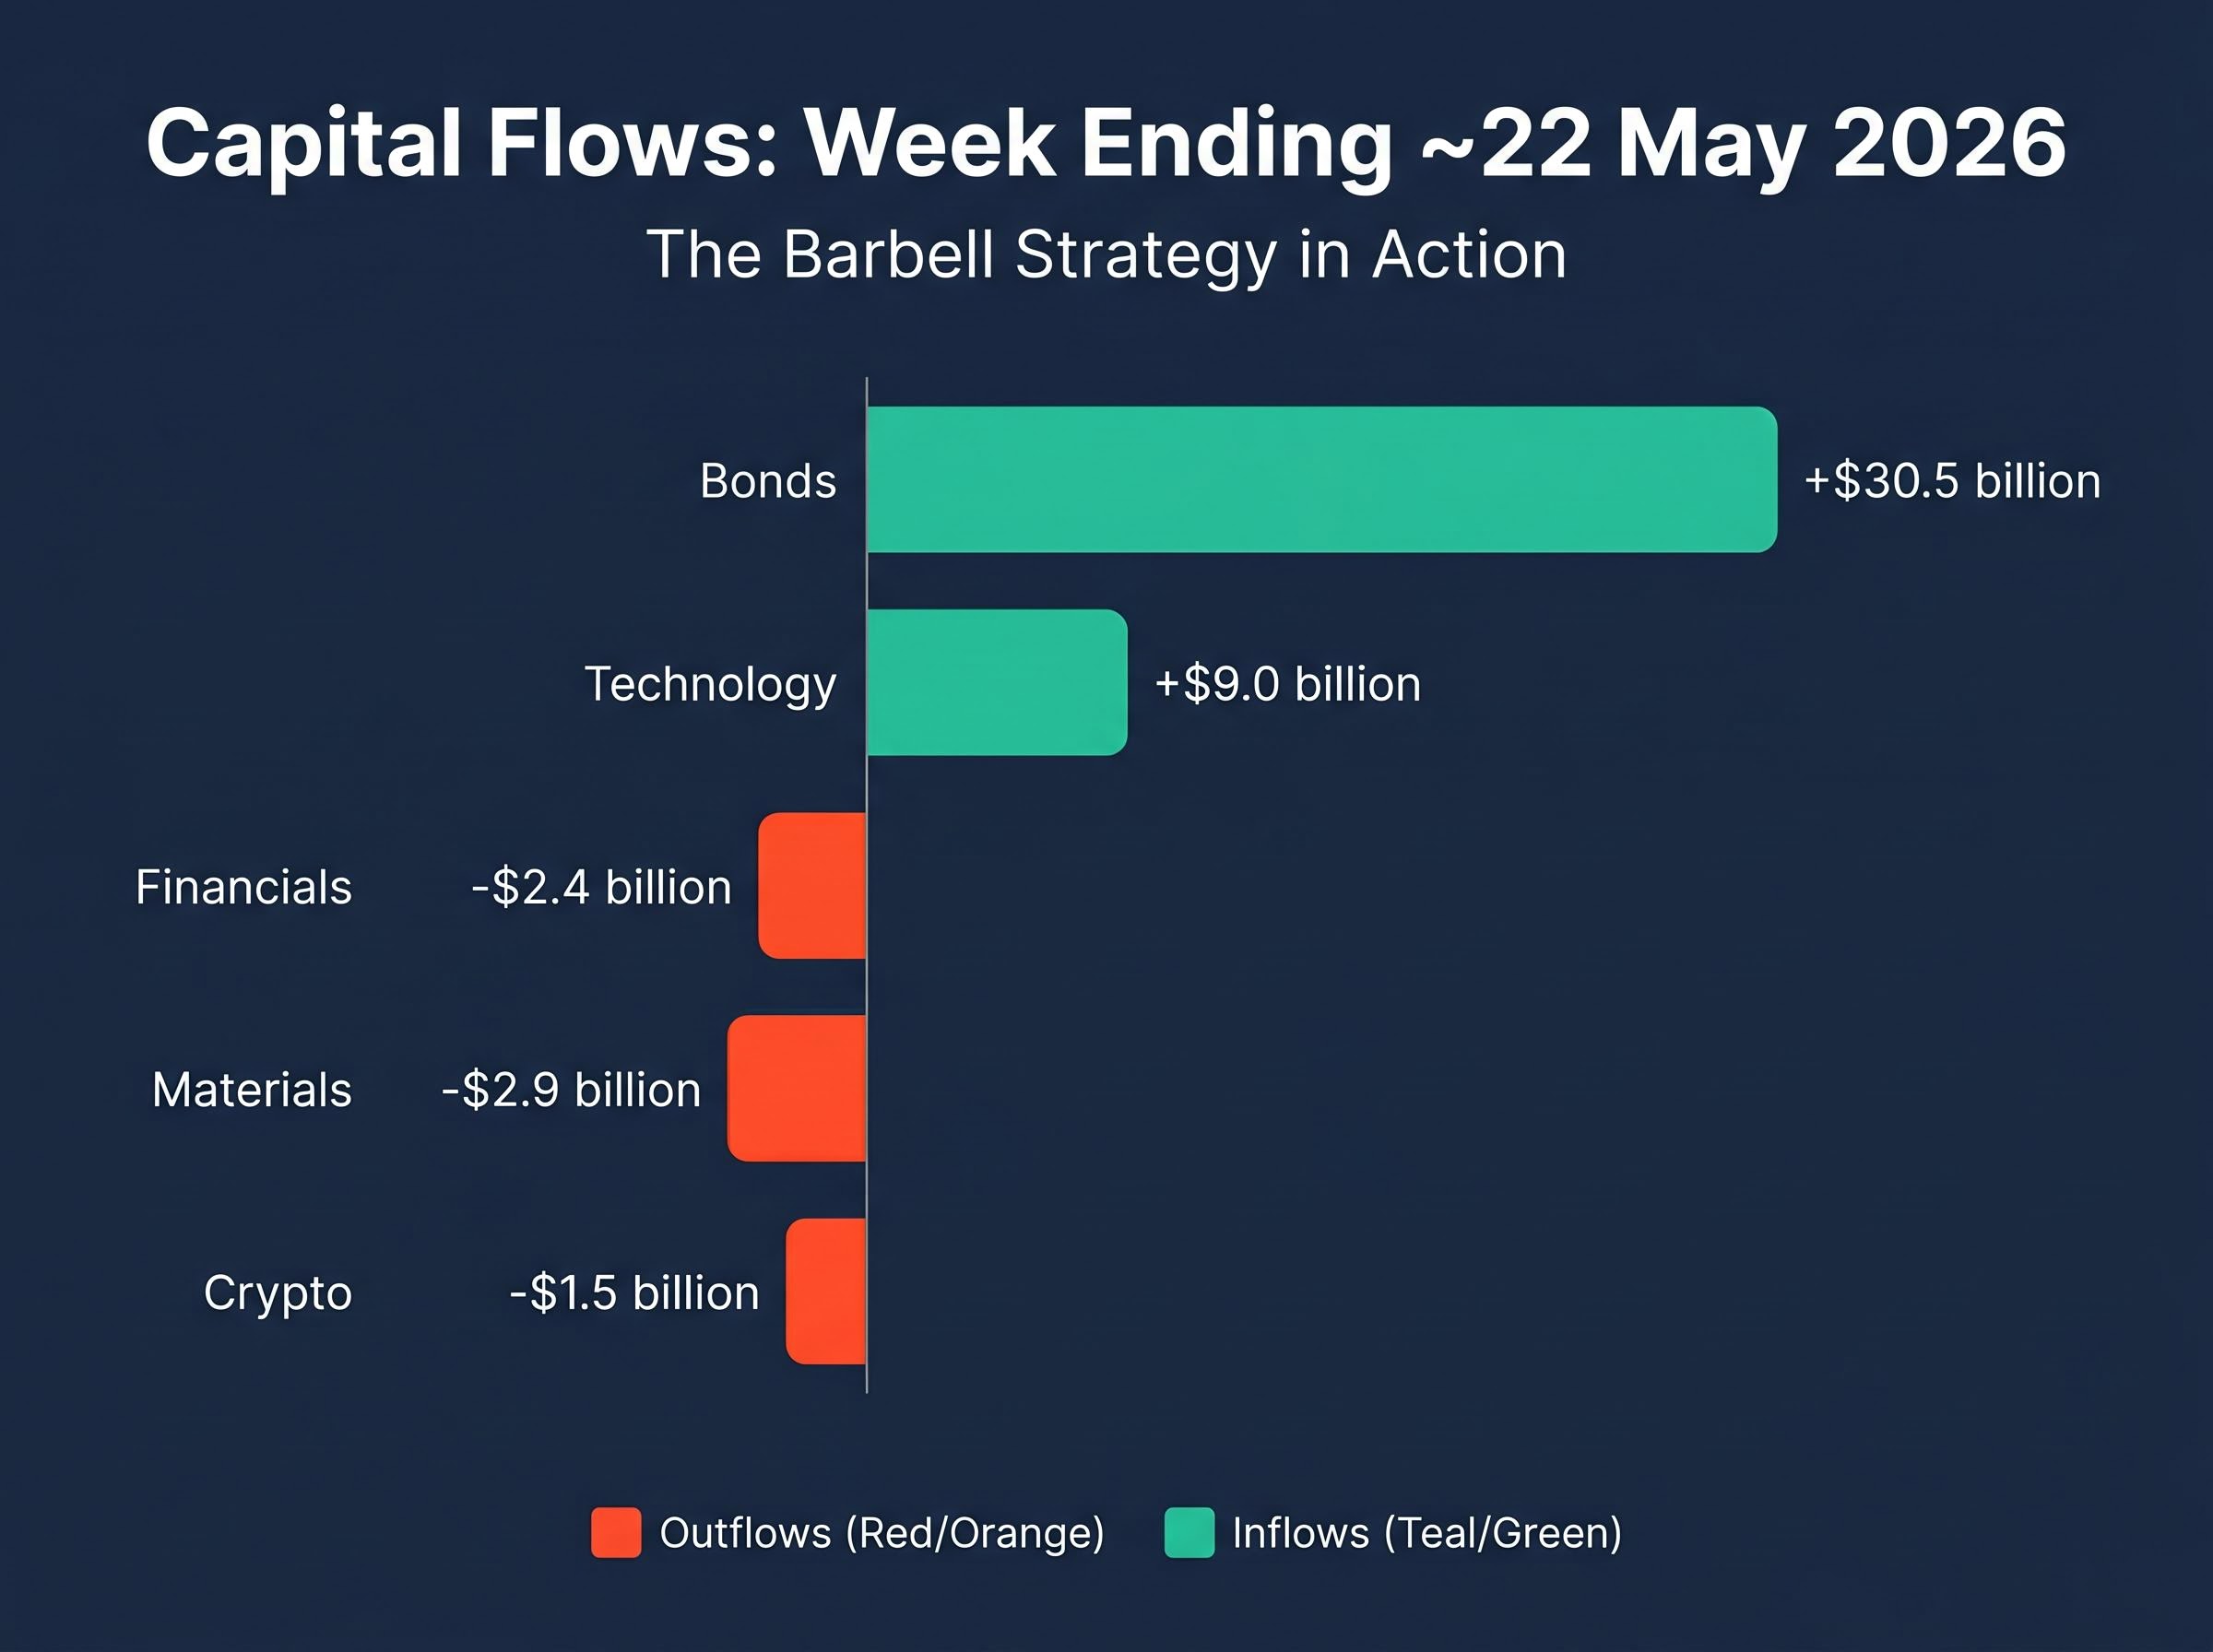
Bond funds have now attracted inflows for 56 consecutive weeks. In the same reporting period ending around 22 May 2026, technology sector funds recorded their largest single-week haul since October 2025, while crypto funds suffered their sharpest outflow since February 2026. These three data points do not tell a single story. They tell three competing ones, and the tensions between them reveal more about investor positioning in mid-2026 than any individual headline.
Capital flow data from Bank of America’s weekly series offers one of the clearest real-time windows into where institutional and retail investors are placing conviction. The current pattern, fixed income dominance paired with concentrated equity enthusiasm and a sharp digital asset retreat, reflects a market in which risk appetite is neither uniformly on nor off. What follows is an analysis of what each major flow trend signals about current investor behaviour, the structural forces driving the bond streak and tech surge, and what the combination means for portfolio positioning as macro conditions grow more ambiguous.
The 56-week bond streak and what it actually means
56 consecutive weeks of net inflows into global bond funds, the longest sustained run of fixed income demand in over a decade.
The headline number is stark. Bond funds drew approximately $30.5 billion in the week ending around 22 May 2026, according to Bank of America flow data, extending the streak to its 56th consecutive week. Investment Company Institute data independently confirmed $12.56 billion into US bond funds for the week ended 13 May 2026, with Treasuries alone attracting approximately $10.8 billion, their largest weekly inflow over the prior nine weeks.
A streak of this duration is unusual. Fund flow cycles in fixed income typically see interruptions every eight to twelve weeks as macro conditions shift. Fifty-six weeks without a single net outflow week suggests something structural, not tactical.
The sovereign yield repricing that swept six major economies simultaneously in May 2026 adds a complicating layer to the bond inflow narrative: investors buying bonds during a 56-week streak are doing so in an environment where the same bonds are experiencing some of their most severe price dislocations since the 1990s, underscoring that the streak reflects yield-locking conviction rather than straightforward price appreciation.
The instinctive reading is bullish for bonds: investors see value, yields are attractive, and disinflation is the backdrop. The problem is that the inflation data says otherwise.
Why investors keep buying bonds despite inflation re-acceleration
The Bureau of Labor Statistics released April 2026 CPI data on 12 May 2026, and the numbers complicated the bond bull narrative. Headline inflation re-accelerated to 3.8% year-on-year with a 0.6% monthly print, the highest annual rate since May 2023. Core CPI came in at 2.8% year-on-year and 0.4% month-on-month.
With the Federal Reserve holding the funds rate at 3.50%-3.75% since the March 2026 meeting, and futures markets pricing roughly two cuts in 2026 (down from three), the yield-locking logic becomes clearer. Investors are not necessarily betting on falling rates. They are locking in nominal yields that may not persist if cuts eventually arrive, regardless of near-term inflation direction.
The Federal Reserve FOMC rate decision from April 2026 confirmed the federal funds rate would remain at 3.50%-3.75%, a holding posture that directly shapes the yield-locking calculus driving sustained bond fund inflows across institutional and retail portfolios.
The flight-to-quality dimension adds a second explanation. Elevated macro uncertainty, emerging market volatility, and equity concentration risk each independently motivate a fixed income allocation, even when inflation is rising. The bond streak, then, is more ambiguous than its length implies: it may reflect confidence in bonds, or anxiety about everything else.
When big ASX news breaks, our subscribers know first
The tech surge: record inflows or a concentration warning?
Technology sector funds attracted approximately $9.0 billion for the week ending around 22 May 2026, the highest weekly total since October 2025. The catalyst was familiar: AI infrastructure themes and mega-cap US names continued to dominate institutional buying.
The enthusiasm is real. So is the warning sign it triggered.
Bank of America’s Bull and Bear Indicator reached 8.0 (up from 7.8), driven specifically by surging tech inflows, all-time monthly highs in fund manager equity allocation increases, and declining cash holdings to 3.9%. At 8.0, the indicator triggers a contrarian sell signal.
Since 2002, this sell signal has preceded average global equity declines of 2-3% over the following two-to-three months across 17 instances.
The concentration dimension sharpens the concern. Multiple institutional perspectives characterise tech and communication services as accounting for over 45% of active US large-cap fund overweights, near the top of the 10-year range. Capital is not flowing broadly into equities; it is flowing narrowly into one theme. The same week that tech absorbed $9.0 billion, financials shed approximately $2.4 billion and materials lost approximately $2.9 billion.
| Sector | Weekly flow (approx.) | Direction | Driver |
|---|---|---|---|
| Technology | +$9.0bn | Inflow | AI infrastructure, mega-cap US names |
| Financials | -$2.4bn | Outflow | Rate sensitivity, earnings caution |
| Materials | -$2.9bn | Outflow | Cyclical weakness, EM demand concerns |
Maximum bullish positioning and strong price performance arriving simultaneously is historically a warning, not a confirmation, of continued gains.
Breadth deterioration beneath the headline index has been progressing alongside the tech surge, with only 47% of S&P 500 constituents trading above their 50-day moving averages as of mid-May 2026, a divergence between narrow leadership and broad weakness that institutional strategists at Morgan Stanley, JPMorgan, and BTIG identified as a compounding factor for any yield-driven correction.
What bond funds and bond yields actually are (and why the streak matters)
Bond funds are pooled investment vehicles that hold government or corporate debt, collect interest payments, and distribute that yield to investors. When interest rates rise, existing bond prices typically fall; when rates decline, bond prices tend to increase. This inverse relationship is the mechanic that drives much of the flow behaviour observed in fixed income markets.
What makes 56 consecutive weeks of inflows significant is the environment in which they occurred. With the Fed holding at 3.50%-3.75%, nominal yields across short- and intermediate-duration bonds remain elevated by post-2020 standards. When institutional investors pour capital into bonds at this pace during a period of high yields and policy uncertainty, the signal is about expected risk-adjusted returns, not simply safety-seeking.
Three primary drivers underpin bond inflows in the current environment:
- Elevated nominal yields offering attractive income relative to the past decade
- A Federal Reserve on hold, reducing the risk of near-term rate increases eroding bond prices
- Flight-to-quality demand driven by emerging market volatility and European equity weakness
Where money moves is often more informative than what market prices are doing, because flows reveal conviction before it fully appears in valuations.
The barbell in practice: income plus AI
The structural portfolio logic described across multiple institutional sources follows a pattern: reduce broad equity exposure, maintain or increase fixed income, then concentrate remaining equity risk in AI and US large-cap tech. This “barbell” approach pursues income on one end and secular growth on the other, while avoiding broad market risk in between.
The inherent concentration risk is worth noting. Portfolios with less total equity weight but highly skewed tech positions may carry lower headline equity exposure, yet larger sector-specific drawdown vulnerability if the narrow rally reverses.
Digital asset outflows in context: what drove investors out of crypto this week
CoinShares reported approximately $1.07 billion in outflows from digital asset investment products for the week to approximately 15 May 2026, the largest single-week withdrawal since February 2026. Bank of America flow data, covering a slightly later period ending around 22 May 2026, recorded approximately $1.5 billion in crypto fund outflows.
The three competing explanations, ranked by the weight of supporting evidence:
- Yield competition from elevated Treasuries: The same week that saw the sharpest crypto outflow also saw approximately $10.8 billion enter Treasuries, a direct illustration of the opportunity cost dynamic. Non-yielding assets face structural headwinds when risk-free rates sit above 3.5%.
- Post-halving profit-taking: The April 2026 Bitcoin halving generated anticipation, but the subsequent price response was characterised as underwhelming in CoinShares commentary, prompting tactical sellers to lock in earlier gains.
- Regulatory uncertainty: Continued US SEC enforcement actions against smaller crypto platforms added a layer of headline risk that may have accelerated institutional trimming.
Approximately $1.07-1.5 billion left crypto funds in the same week approximately $10.8 billion entered Treasuries, the yield competition dynamic in a single data point.
The crypto outflow is not an isolated event. It sits within a broader pattern of capital rotating toward yield-bearing instruments, and its timing relative to inflation data and Fed policy posture makes it a useful diagnostic for how macro conditions are reshaping digital asset appetite.
Where capital is not going: EM and European equities in sustained retreat
Emerging market equity funds recorded approximately $7.9 billion in outflows for the week ending around 22 May 2026, extending a six-week consecutive outflow streak, the longest such run since November 2024. European equity funds posted their sixth straight week of net redemptions.
These are not disconnected regional stories. They share a common set of structural drivers.
| Region | Weekly flow | Streak | Primary driver |
|---|---|---|---|
| US equities | Modest net inflows | Positive | Tech/AI concentration, mega-cap demand |
| European equities | Net outflows | 6th consecutive week | Weak earnings, political uncertainty, ECB divergence |
| EM equities | -$7.9bn | 6-week streak (longest since Nov 2024) | US yield differential, stronger dollar, China disappointment |
Elevated US real yields and a stronger dollar reduce the relative attractiveness of both EM and European assets. ECB-Fed policy divergence, with the European Central Bank expected to cut sooner and more aggressively, signals weaker earnings growth in Europe. China recovery disappointment and geopolitical risk weigh on broader EM sentiment.
The structural headwinds facing European equities extend beyond the ECB-Fed policy divergence visible in weekly flow data, with sluggish eurozone growth, elevated energy costs, and the absence of a near-term stimulus catalyst each contributing to a sustained outflow pattern that mirrors the broader sorting of global capital toward US semiconductor and AI-adjacent positions.
The simultaneous retreat from two major equity regions reflects a coherent institutional preference for US assets and high-quality fixed income that has persisted long enough to constitute a structural positioning tilt, not a short-term tactical adjustment.
What the data is and is not telling investors right now
The picture that emerges from this week’s flow data is a market hedging itself on both sides. Bonds are dominant, but the inflation backdrop, with headline CPI at 3.8% and the Fed on hold, is more complicated than the 56-week streak implies. Tech enthusiasm is real, but historically, concentrated positioning of this kind has preceded near-term weakness. Crypto outflows reflect genuine yield competition rather than a structural collapse in interest.
Three signals stand out:
- Bond flows are sustained but the macro narrative underpinning them is ambiguous, not straightforwardly bullish
- Tech positioning has reached historically crowded levels, with BofA’s contrarian sell signal active at 8.0
- The EM and European equity retreat is structural in duration, not tactical in nature
Where BofA strategists see the next contrarian opportunity
Even with the Bull and Bear Indicator at 8.0, Bank of America strategists do not anticipate immediate large-scale repositioning, citing upcoming IPO activity as a reason investors will hold equity exposure in the near term. The team has indicated that meaningful policy tightening is anticipated only after CPI reaches 4%-5%.
The contrarian opportunities identified are specific. Consumer equities on an equal-weighted basis have declined to below post-Global Financial Crisis lows relative to the S&P 500. AI-adopting small-cap companies are characterised as the preferred long-term opportunity, with BofA drawing an analogy to the period following the collapse of the Nifty Fifty era in the late 1970s. President Trump’s approval rating on inflation, reported at 28% for the period around 22 May 2026, adds political pressure that could accelerate fiscal responses.
Flow data does not predict markets. It diagnoses where conviction is concentrated and where it has been withdrawn. The simultaneous dominance of bond inflows, concentrated tech enthusiasm, and sharp crypto retreat is not contradictory. It is a barbell strategy applied at scale, where investors are seeking yield-certainty and secular growth while abandoning everything in between.
The correction implied by the sell signal, if it follows historical patterns, would be modest, averaging 2-3% over two-to-three months, and does not negate the structural case for quality fixed income or AI-adjacent equity exposure. The more important question for readers is whether their own allocation reflects an intentional view on the macro environment, or whether it inadvertently mirrors the most crowded institutional consensus.
For readers assessing whether their own allocation inadvertently mirrors the crowded institutional consensus described above, our full explainer on the post-rally rebalancing case walks through Morningstar’s valuation compression analysis, Goldman Sachs and BlackRock’s rotation guidance, and the specific AI names identified as having durable moats versus those now flagged as overvalued following the 32% technology index surge between March and May 2026.
This article is for informational purposes only and should not be considered financial advice. Investors should conduct their own research and consult with financial professionals before making investment decisions. Past performance does not guarantee future results. Financial projections are subject to market conditions and various risk factors.