9 ASX 200 Stocks at 52-Week Lows: Which Bounces Are Real?
33 mins ago


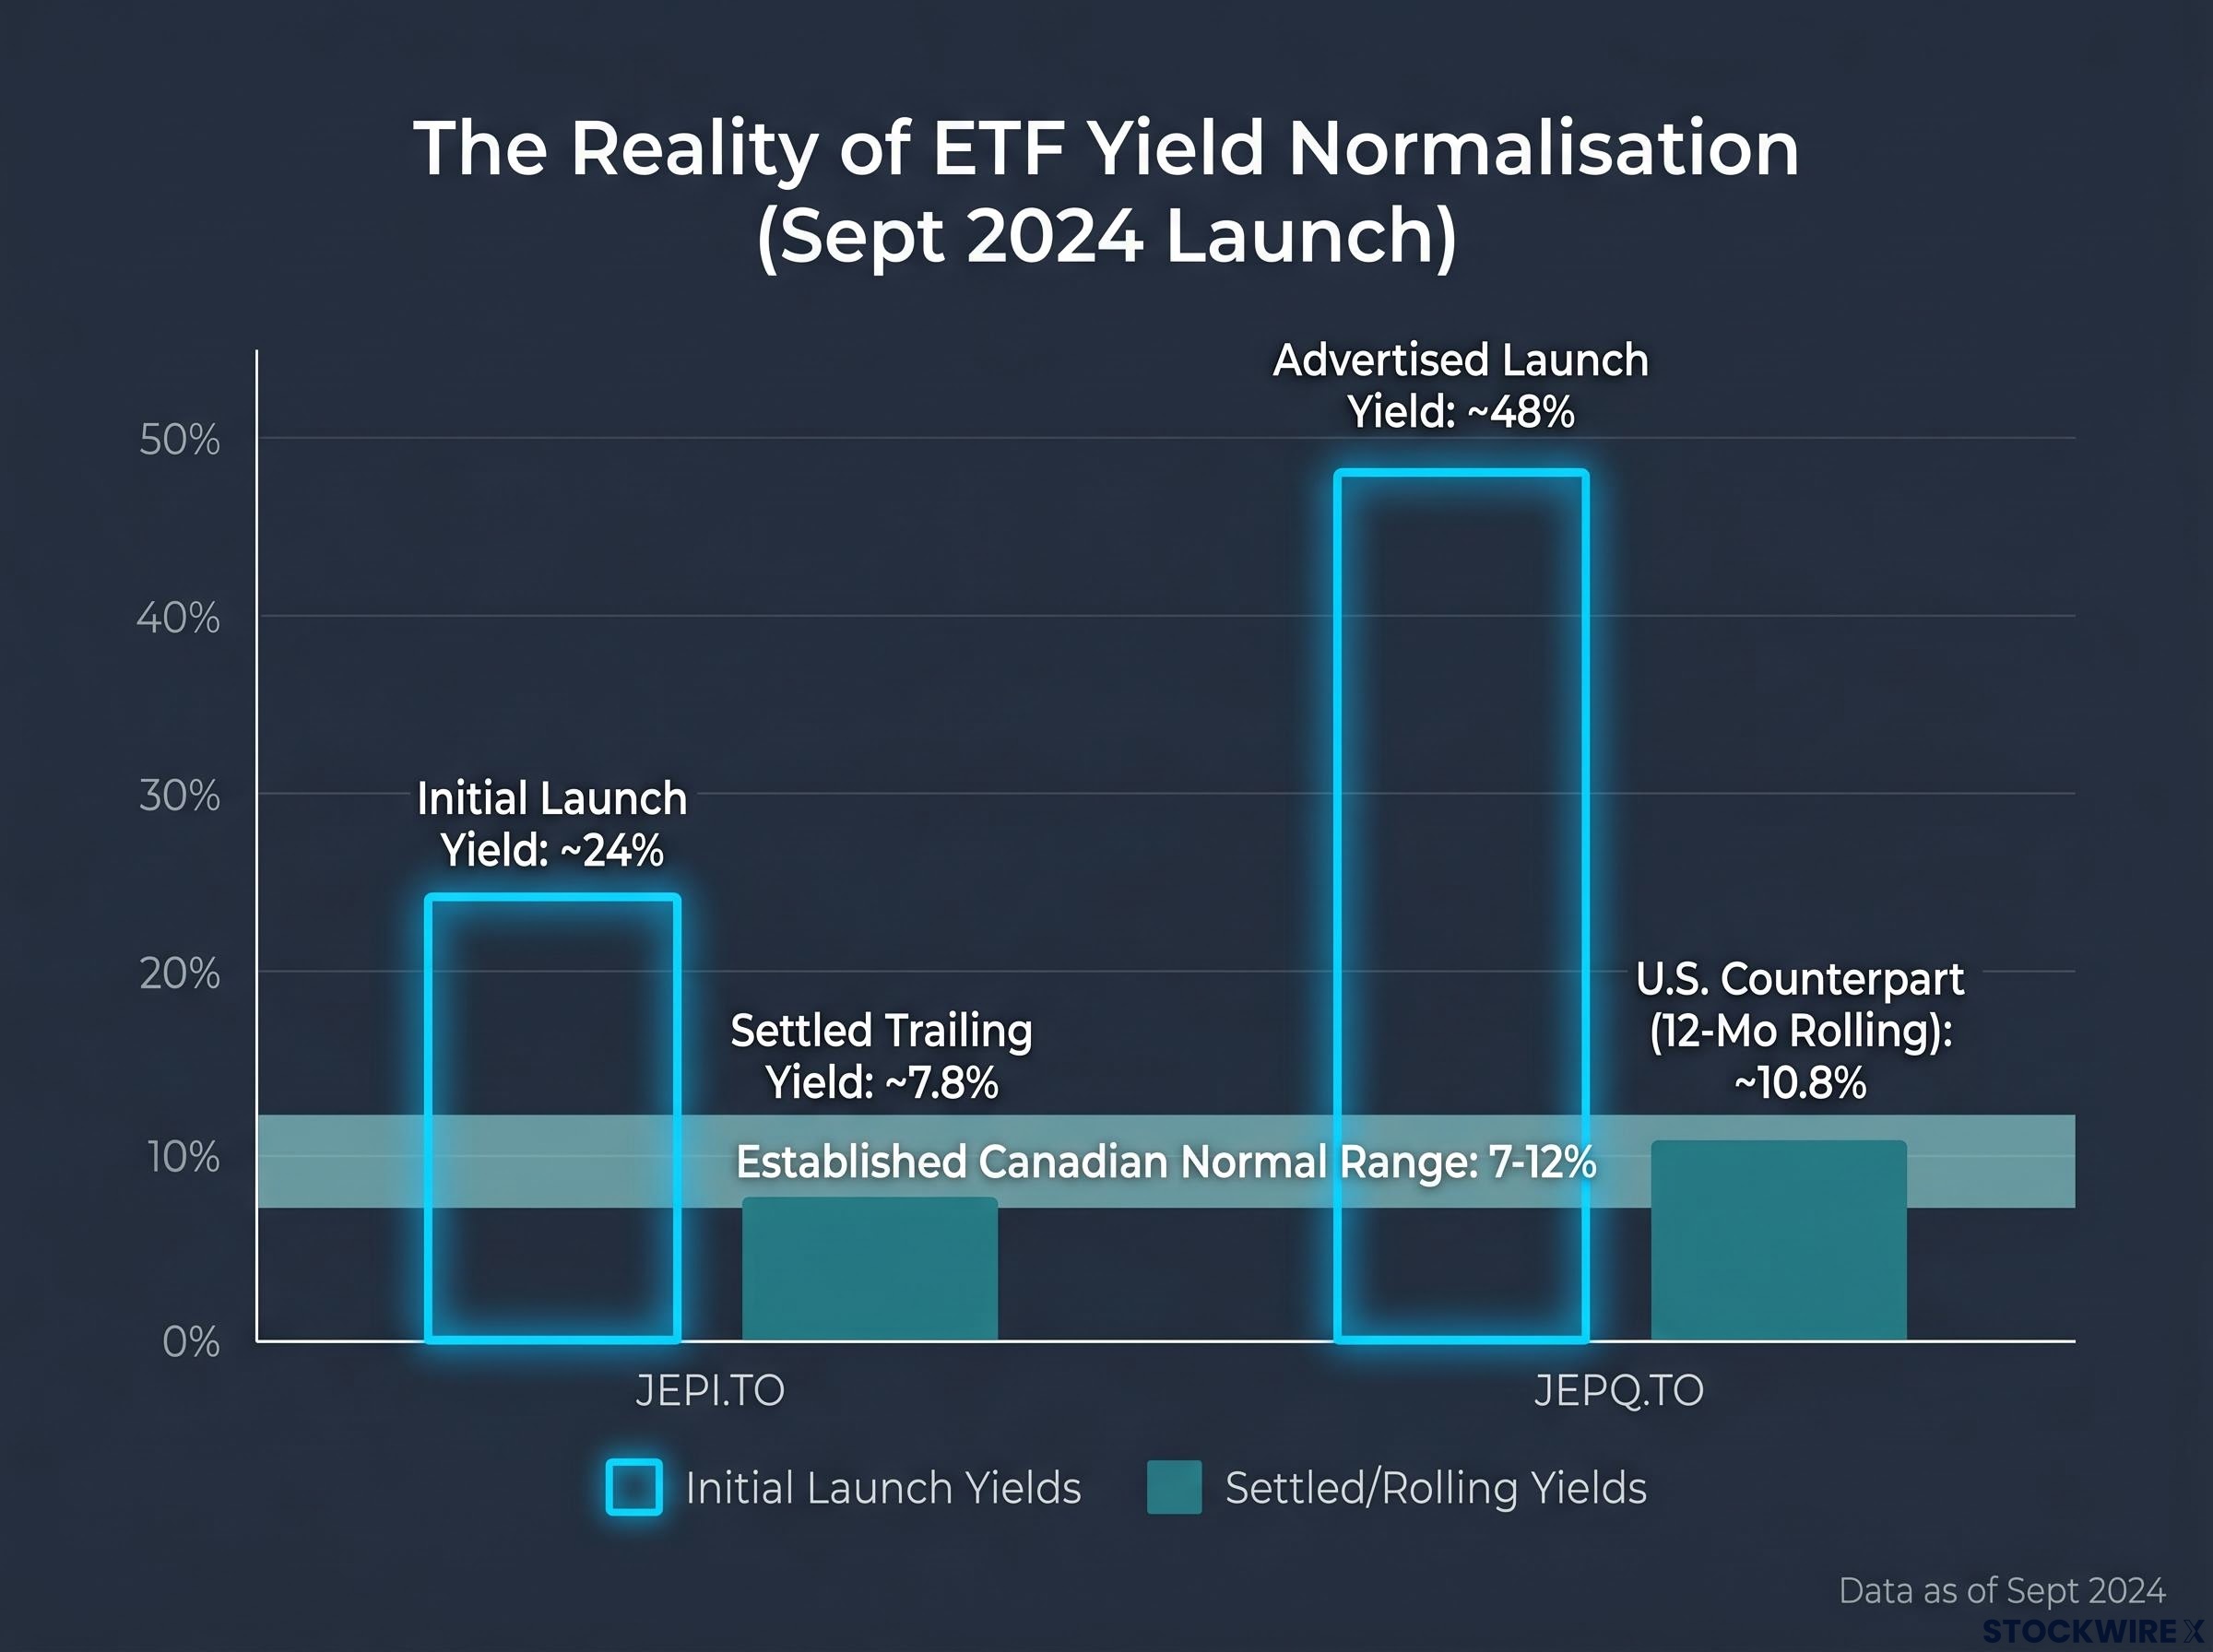
A new TSX-listed ETF advertising a 48% yield is the kind of number that stops income investors mid-scroll. JEPQ.TO, the Canadian version of JPMorgan’s Nasdaq-focused covered-call strategy, carried that figure shortly after its September 2024 launch. Its sibling, JEPI.TO, showed roughly 24%.
Those numbers demand scrutiny, because Canada already has a mature covered-call ETF ecosystem where 7-12% is the established normal range. The gap between 48% and 10% is not a marginal difference. It is the difference between a legitimate income strategy and a figure that requires structural explanation.
Here is what the numbers actually mean, where yields have settled nine months later, and how to evaluate these two funds against well-established Canadian alternatives before making an allocation decision.
JEPI.TO and JEPQ.TO launched on the TSX on 27 September 2024 as Canadian-listed counterparts to JPMorgan’s U.S. covered-call ETFs. The U.S. originals had earned investor trust over years, with JEPI delivering a yield in the 7-8% range and JEPQ showing approximately 10.8% on a 12-month rolling basis.
The Canadian versions told a very different story at first glance. Yield trackers showed JEPI.TO at roughly 24% and JEPQ.TO at roughly 48%, figures that sat so far above the 7-12% band of established Canadian covered-call ETFs that they warranted immediate investigation.
JEPQ.TO’s advertised yield of approximately 48% was nearly five times the 10.8% rolling yield of the identical U.S. strategy.
That gap, between 48% on the Canadian fund and 10.8% on a fund running the same underlying methodology, is the signal that something structural rather than fundamental was driving the headline numbers. Before accepting either figure at face value, the mechanics behind them deserve a closer look.
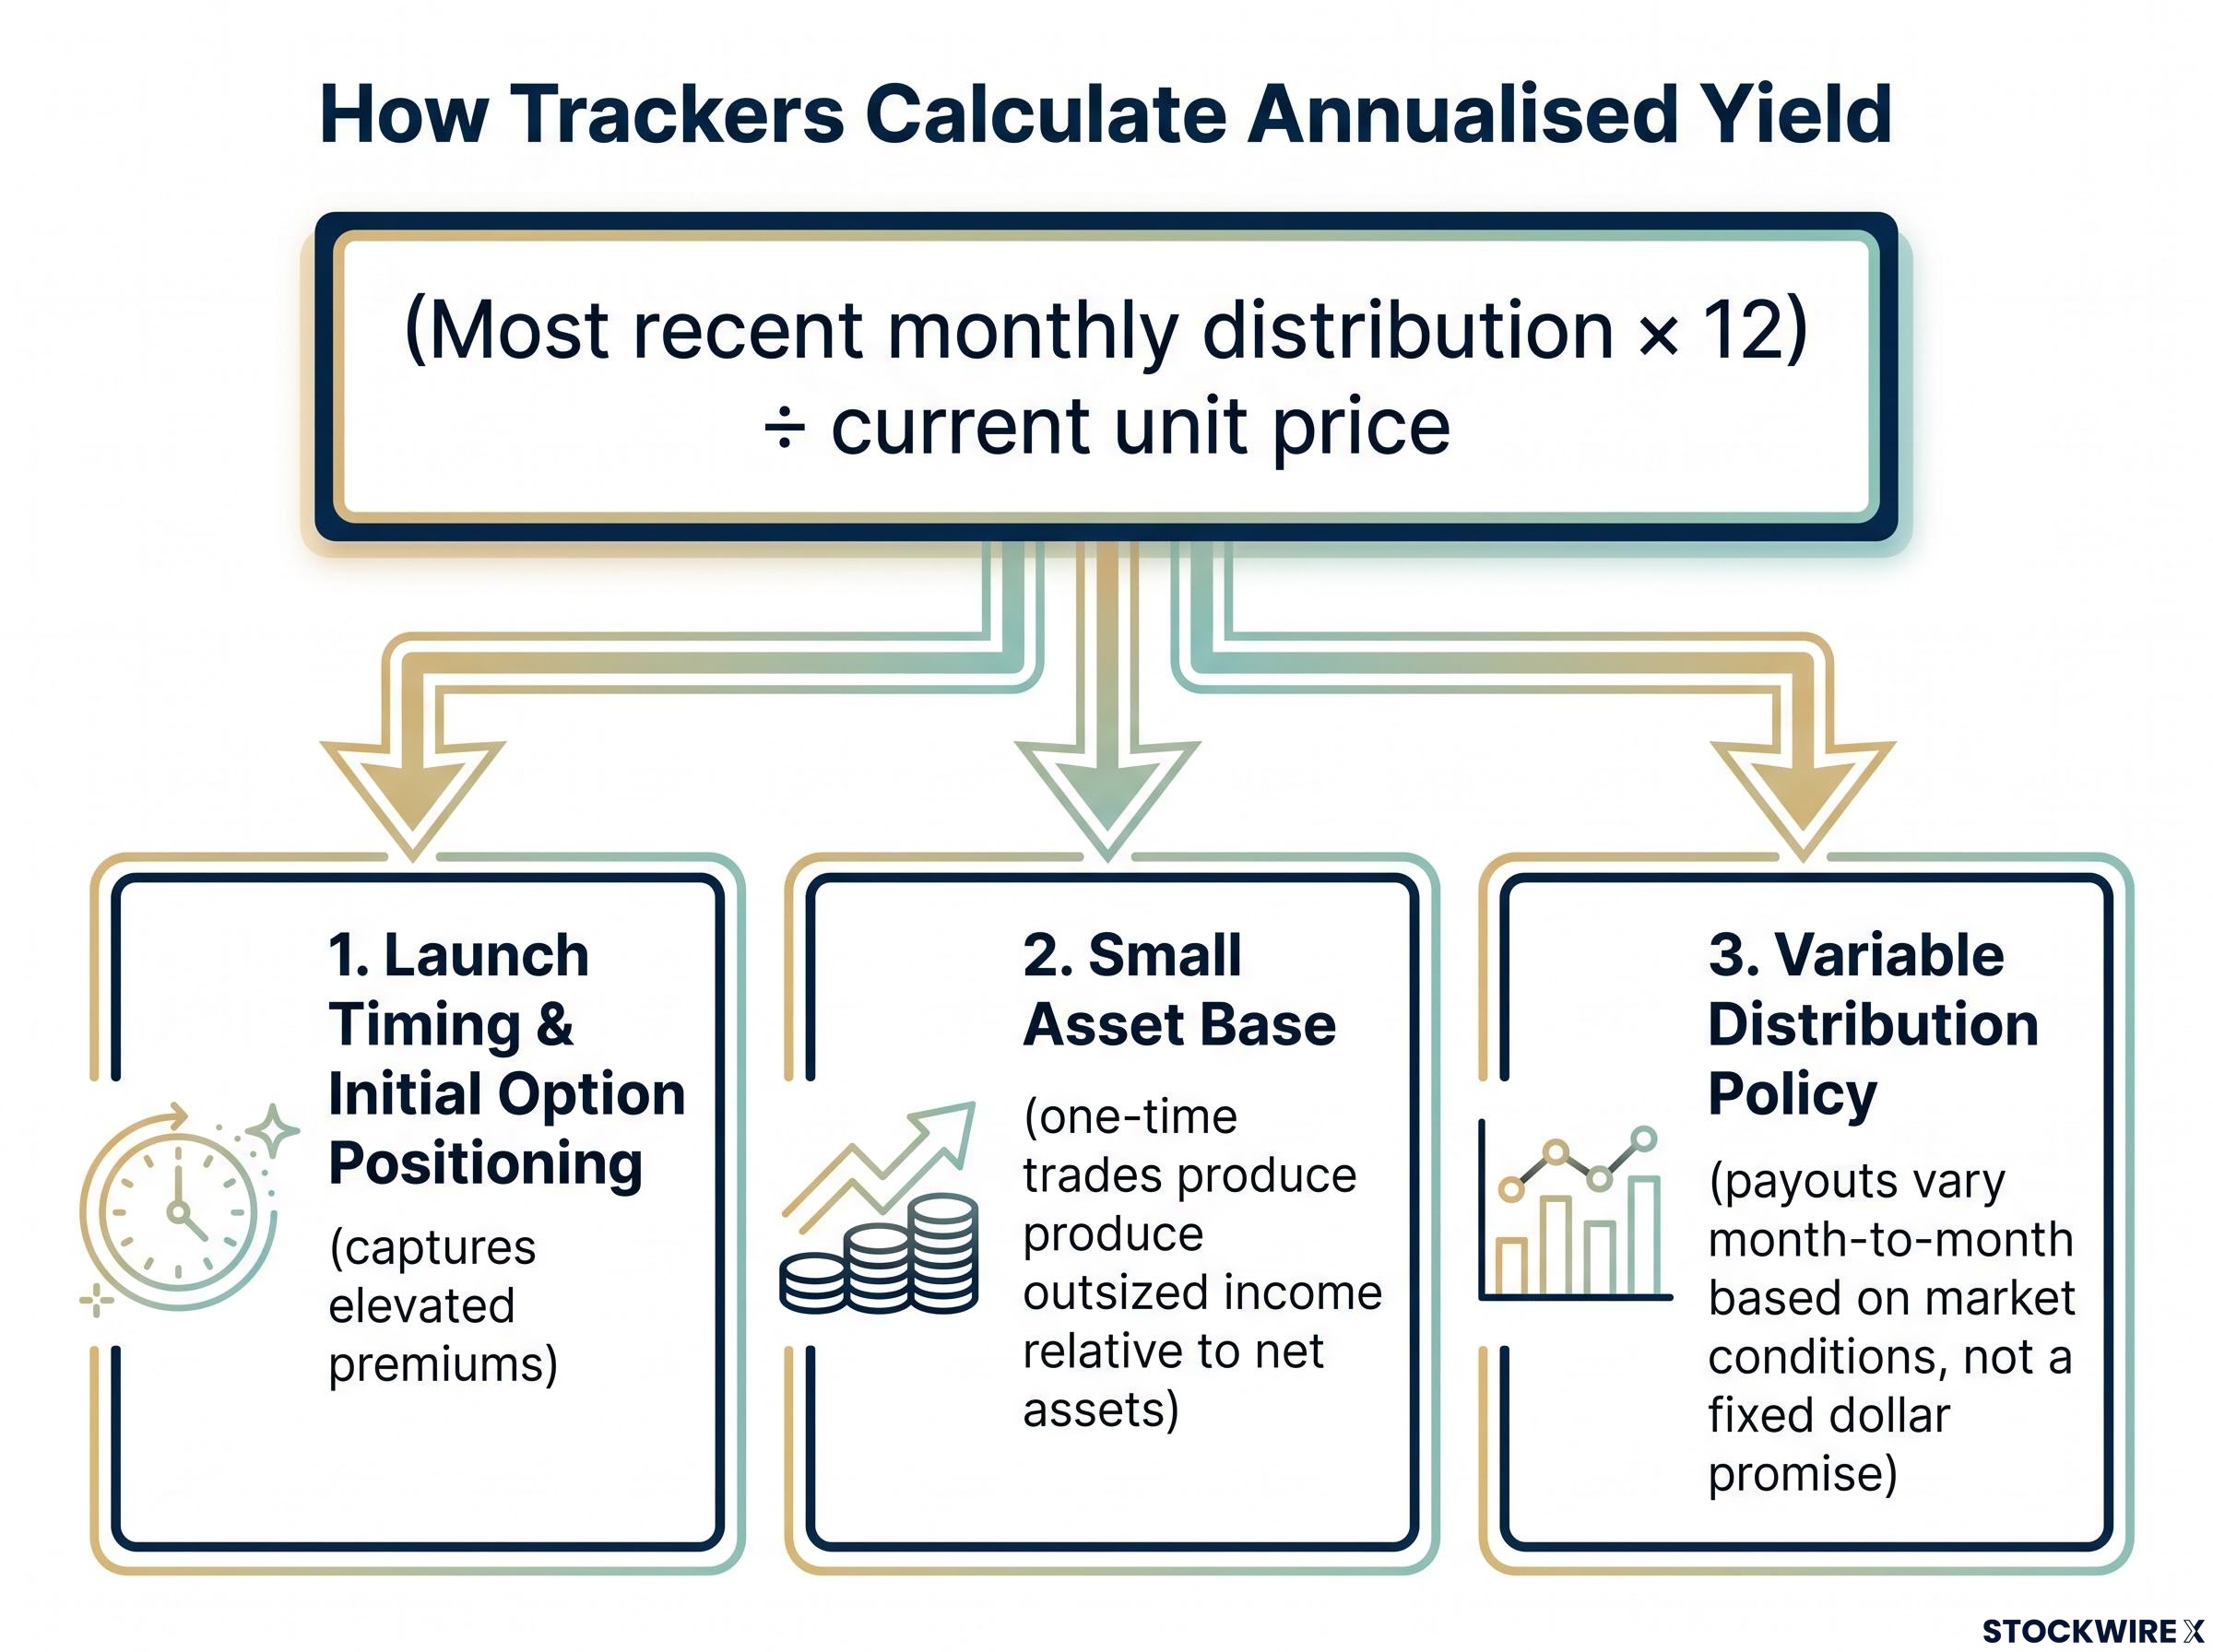
The explanation is mechanical, not fraudulent. Yield trackers take the most recent monthly distribution, multiply it by 12, and divide by the current unit price. When a fund’s first distribution is elevated, that formula produces extreme annualised figures, because it assumes the initial payout will repeat every month for a full year.
Three structural conditions inflate early distributions and make this effect predictable:
Understanding this mechanic does not make the funds less interesting. It resets the basis of evaluation so you are comparing these funds on the right terms, not on a figure that was always going to disappear.
JEPI.TO’s yield has already normalised from approximately 24% to approximately 7.8%, confirming the expected pattern.
That convergence is exactly what the variable-distribution mechanics predict. It is the proof that the launch-phase figures were temporary snapshots, not income promises.
JEPI.TO is an actively managed covered-call ETF. It selects U.S. large-cap equities, primarily from S&P 500 names, and writes covered calls on the index or related ETFs to generate premium income. A covered call is an options strategy where the fund sells the right for another investor to buy its shares at a set price, collecting a fee (the premium) in exchange for capping some upside. The goal is monthly distributions and reduced volatility relative to holding the equities outright.
The covered call yield and total return trade-off has been examined empirically in peer-reviewed research, which finds a strong negative mechanical relationship between derivative income generation and expected total return, confirming that higher distributions from options writing come at the direct cost of capped equity upside.
JEPQ.TO applies the same options overlay philosophy to a Nasdaq-100-weighted equity base, giving it heavier technology exposure and a different risk profile.
JEPI’s portfolio construction diverges from the S&P 500 more than most investors expect: only approximately 32% of its holdings overlap with the index by weight, and roughly 80% of distributions are classified as ordinary income rather than qualified dividends, a structural detail that shapes how the fund behaves across different market regimes.
Both funds operate under Canadian tax and reporting rules, which means distribution composition (eligible dividends, foreign income, capital gains, and return of capital) differs from the U.S. funds even though the investment strategy framework is imported directly.
JEPI.TO now shows a trailing yield of approximately 7.8% with monthly distributions, placing it squarely within the 7-12% range that characterises Canada’s established covered-call ETF space.
JEPQ.TO’s steady-state yield is not yet publicly established given its shorter history, but the U.S. JEPQ’s 12-month rolling yield of approximately 10.8% and the normalisation already observed in JEPI.TO point toward a high-single-digit to low-double-digit band. That is an informed inference based on fund design and the Canadian JEPI experience, not a directly sourced statistic, and should be treated accordingly.
At 7.8%, JEPI.TO is a legitimate income option. That changes the question from “is this a yield trap” to “is this the best option in its category.”
| Fund | Strategy Focus | Current Yield | Notes |
|---|---|---|---|
| JEPI.TO | S&P 500 covered call | ~7.8% | Launched Sept 2024; early yield ~24% |
| JEPQ.TO | Nasdaq-100 covered call | Not yet established | Early yield ~48%; expected high-single to low-double digits |
| U.S. JEPI | S&P 500 covered call | ~7-8% | ~US$44.6B AUM; 0.35% ER |
| U.S. JEPQ | Nasdaq-100 covered call | ~10.8% (12-mo rolling) | ~US$39.7B AUM; 0.35% ER |
Canada’s covered-call ETF market is not waiting for JPMorgan to arrive. Established managers including Hamilton, Harvest, CI, Horizons, BMO, RBC, and TD already offer competitive products across the yield spectrum, and several have multi-year distribution histories that JEPI.TO and JEPQ.TO simply cannot match yet.
The most directly relevant comparisons sit with Hamilton ETFs, which offers two funds that bracket the JPMorgan products on yield and structure. Horizons QQQC provides an existing Nasdaq-100 covered-call option for Canadian investors who want that specific exposure. At the higher end, sector-concentrated funds from Harvest and CI push yields into the mid-teens, but carry greater concentration risk in exchange.
Concentrated covered call ETFs from providers such as Harvest and CI can push yields into the mid-teens, but verified performance data shows they delivered only 0.26% in year-to-date price appreciation through May 2026 versus 2.72% for index-proxy funds, meaning the higher yield comes at the cost of near-total NAV growth rather than from a fundamentally superior income engine.
The covered-call offerings from RBC and TD generate yields that fall short of the 10% mark that income-focused investors commonly seek, placing them in a different tier from the JPMorgan entries and reducing their relevance as direct comparisons.
HYLD is the most directly comparable alternative for investors specifically drawn to JEPI and JEPQ exposure. It is a fund of U.S. covered-call ETFs that holds JEPI and JEPQ among its underlying positions, uses leverage to boost income, and currently shows a yield of approximately 12% with an established multi-year distribution history. If you want the JPMorgan covered-call methodology inside a Canadian-listed wrapper with a verifiable track record, HYLD already offers it.
For investors exploring whether HYLD’s 12% yield and leverage structure fit their income requirements, our deep-dive into leveraged covered call ETFs examines how a 1.25x equity overlay interacts with the call-writing strategy to produce a portfolio delta of approximately 0.92, including the interest rate sensitivity that Canadian-listed products carry given Bank of Canada rate decisions.
| Fund | Provider | Yield (approx.) | Structure | Key Notes |
|---|---|---|---|---|
| HDIV | Hamilton | ~9.8% | ETF-of-ETFs | Diversified; multi-year history |
| HYLD | Hamilton | ~12% | Fund of U.S. covered-call ETFs | Holds JEPI/JEPQ; uses leverage |
| QQQC | Horizons | Varies | Nasdaq-100 covered call | Existing Nasdaq-100 option for Canadians |
| Sector funds | Harvest, CI, Hamilton | Mid-teens | Sector-concentrated | Higher yield, higher concentration risk |
| RBC/TD options | RBC, TD | Below 10% | Covered call | Below many income investors’ threshold |
The JPMorgan brand reflects genuine investment competence. The same methodology underpins US$44.6 billion in JEPI assets and US$39.7 billion in JEPQ assets globally. But brand alone does not substitute for a track record in the Canadian market. Here is a five-point evaluation framework for assessing these funds on the right terms:
Covered call ETF tax treatment in Canada splits a single distribution across up to five T3 categories, each taxed at a different rate, which means two funds with identical headline yields can produce materially different after-tax returns depending on how their income is characterised between eligible dividends, foreign income, capital gains, and return of capital.
An investor who applies this framework is evaluating these funds the way a professional analyst would, arriving at a conclusion based on evidence rather than a promotional yield figure.
This article is for informational purposes only and should not be considered financial advice. Investors should conduct their own research and consult with financial professionals before making investment decisions. Past performance does not guarantee future results.
The JPMorgan covered-call methodology is legitimate. The Canadian funds import the same strategy framework that has attracted more than US$84 billion in combined U.S. assets. At its normalised yield of approximately 7.8%, JEPI.TO sits comfortably within the 7-12% band that defines credible covered-call income in Canada. JEPQ.TO is expected to settle in the high-single-digit to low-double-digit range based on U.S. JEPQ’s 10.8% rolling yield and the convergence pattern already demonstrated by its sibling fund.
What has not been established is how these funds perform through a full market cycle. There is no multi-year distribution history, limited NAV data across diverse conditions, and fees relative to Canadian peers still to be fully assessed.
The 24% and 48% figures were always going to normalise. The more important question, one that requires at least another 12 months of data to answer, is how these funds perform when volatility spikes, markets sell off, and income strategies face their real test.
Canadian investors have strong alternatives with established histories while they wait. The most useful posture toward JEPI.TO and JEPQ.TO right now is patient observation: watch the next 12 months of distributions and NAV movement before making a significant allocation decision.
JEPI.TO and JEPQ.TO are Canadian-listed covered-call ETFs launched on the TSX in September 2024, mirroring JPMorgan's U.S. strategies that write options on S&P 500 and Nasdaq-100 equities respectively to generate monthly income distributions.
The 48% figure was a mechanical artifact: yield trackers annualise the most recent monthly distribution, so an elevated first payout from launch-phase option positioning, a small initial asset base, and variable distribution policy produced an extreme number that was always going to disappear as the fund matured.
JEPI.TO has normalised from approximately 24% at launch to approximately 7.8%, placing it squarely within the 7-12% range that characterises Canada's established covered-call ETF market.
HYLD already holds JEPI and JEPQ among its underlying positions, uses leverage to boost income to approximately 12%, and carries a multi-year distribution history that the newly launched Canadian JPMorgan funds cannot yet match, making it a directly relevant alternative for investors who want that methodology with a verifiable track record.
Investors should wait for at least 6-12 months of distribution history, monitor NAV stability to confirm distributions are not a return of capital, compare all-in fees against established Canadian peers, review distribution composition for tax treatment differences, and consider account type given potential withholding implications on U.S.-stock-based strategies.