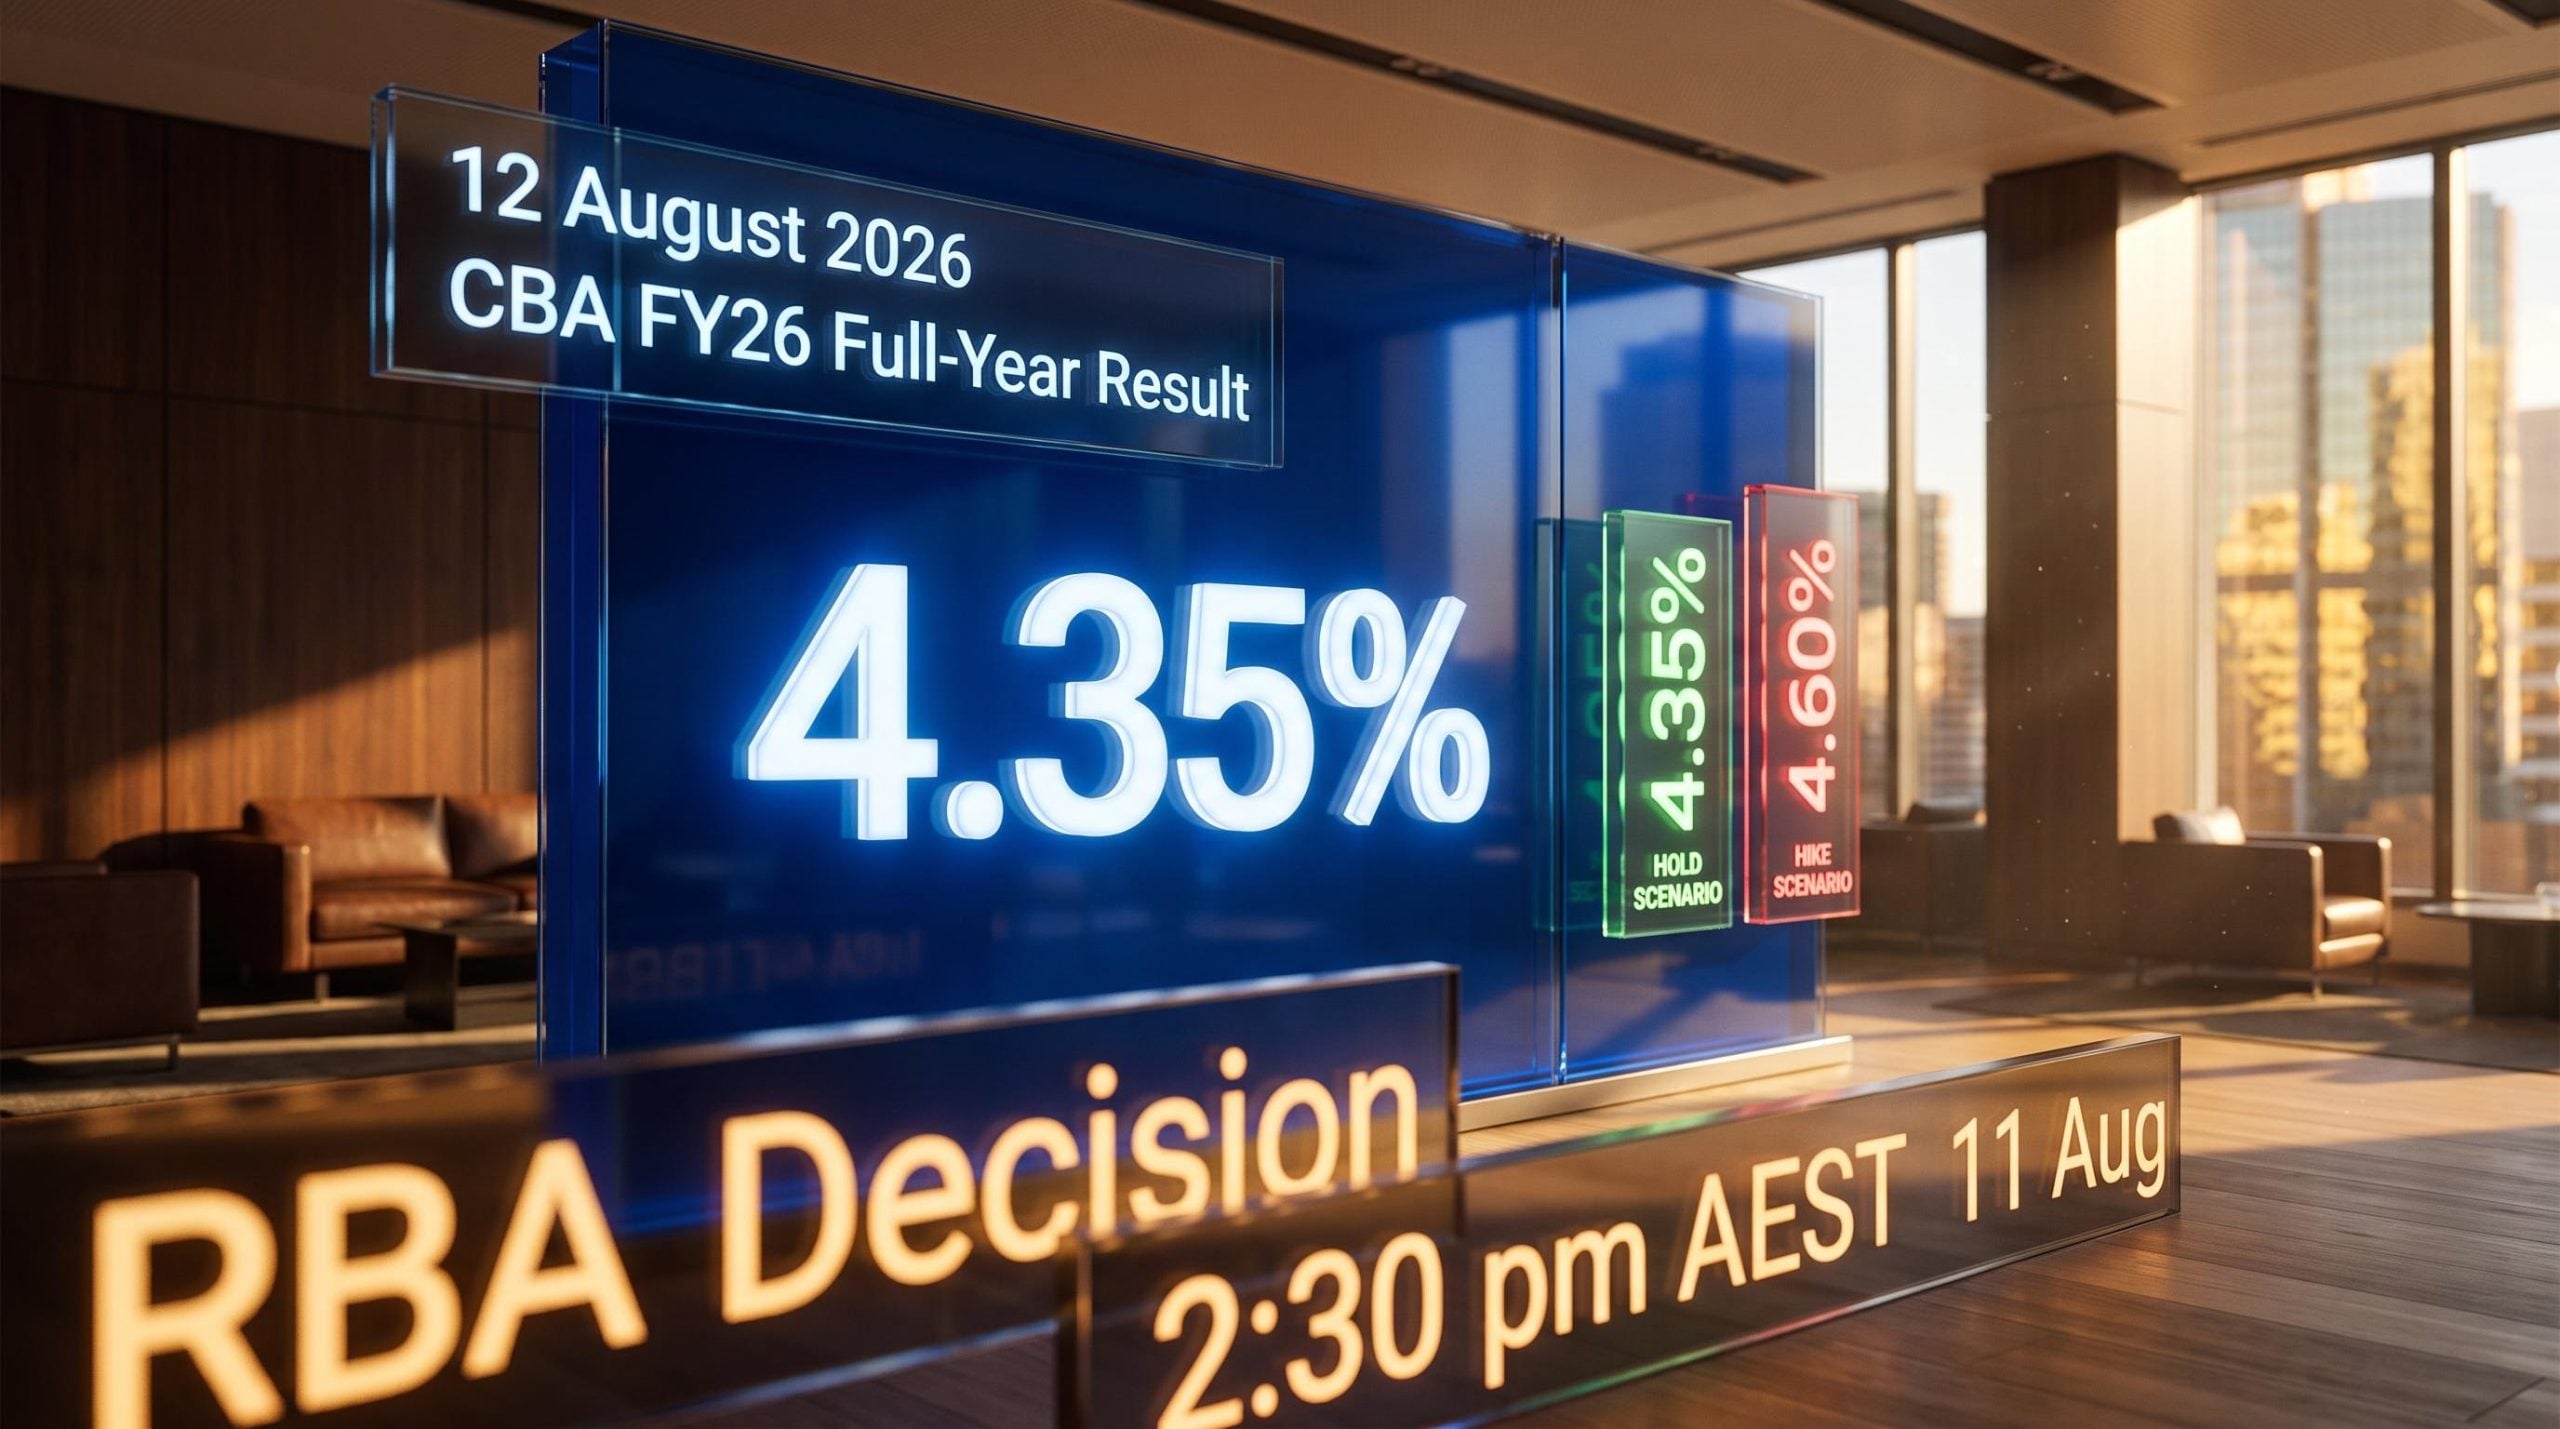
ASX bank shareholders face the most compressed sequence of rate and earnings catalysts this reporting cycle has produced. Over the next eight trading days, two events will land back to back, and how they align could determine whether the sector’s bull run extends or stalls heading into September.
The RBA hands down its August cash rate decision at 2:30 pm AEST on 11 August 2026. Within a single trading day, Commonwealth Bank of Australia follows with its FY26 full-year result and final dividend announcement, making it the first major bank to post a complete annual earnings print this cycle. For income investors and equity holders across the majors, these two events are closely linked: the RBA outcome sets the macro backdrop for margins and credit quality, and CBA’s numbers serve as the primary read-through for Westpac, NAB, and ANZ ahead of their own September year-end reporting.
Here is the framework for reading both events, separately and in combination, so you can calibrate your positioning before the first catalyst lands.
Why the RBA’s 11 August call carries unusual weight for bank investors
The consensus says hold. But the consensus also said no hikes at all in 2026, and the RBA delivered three.
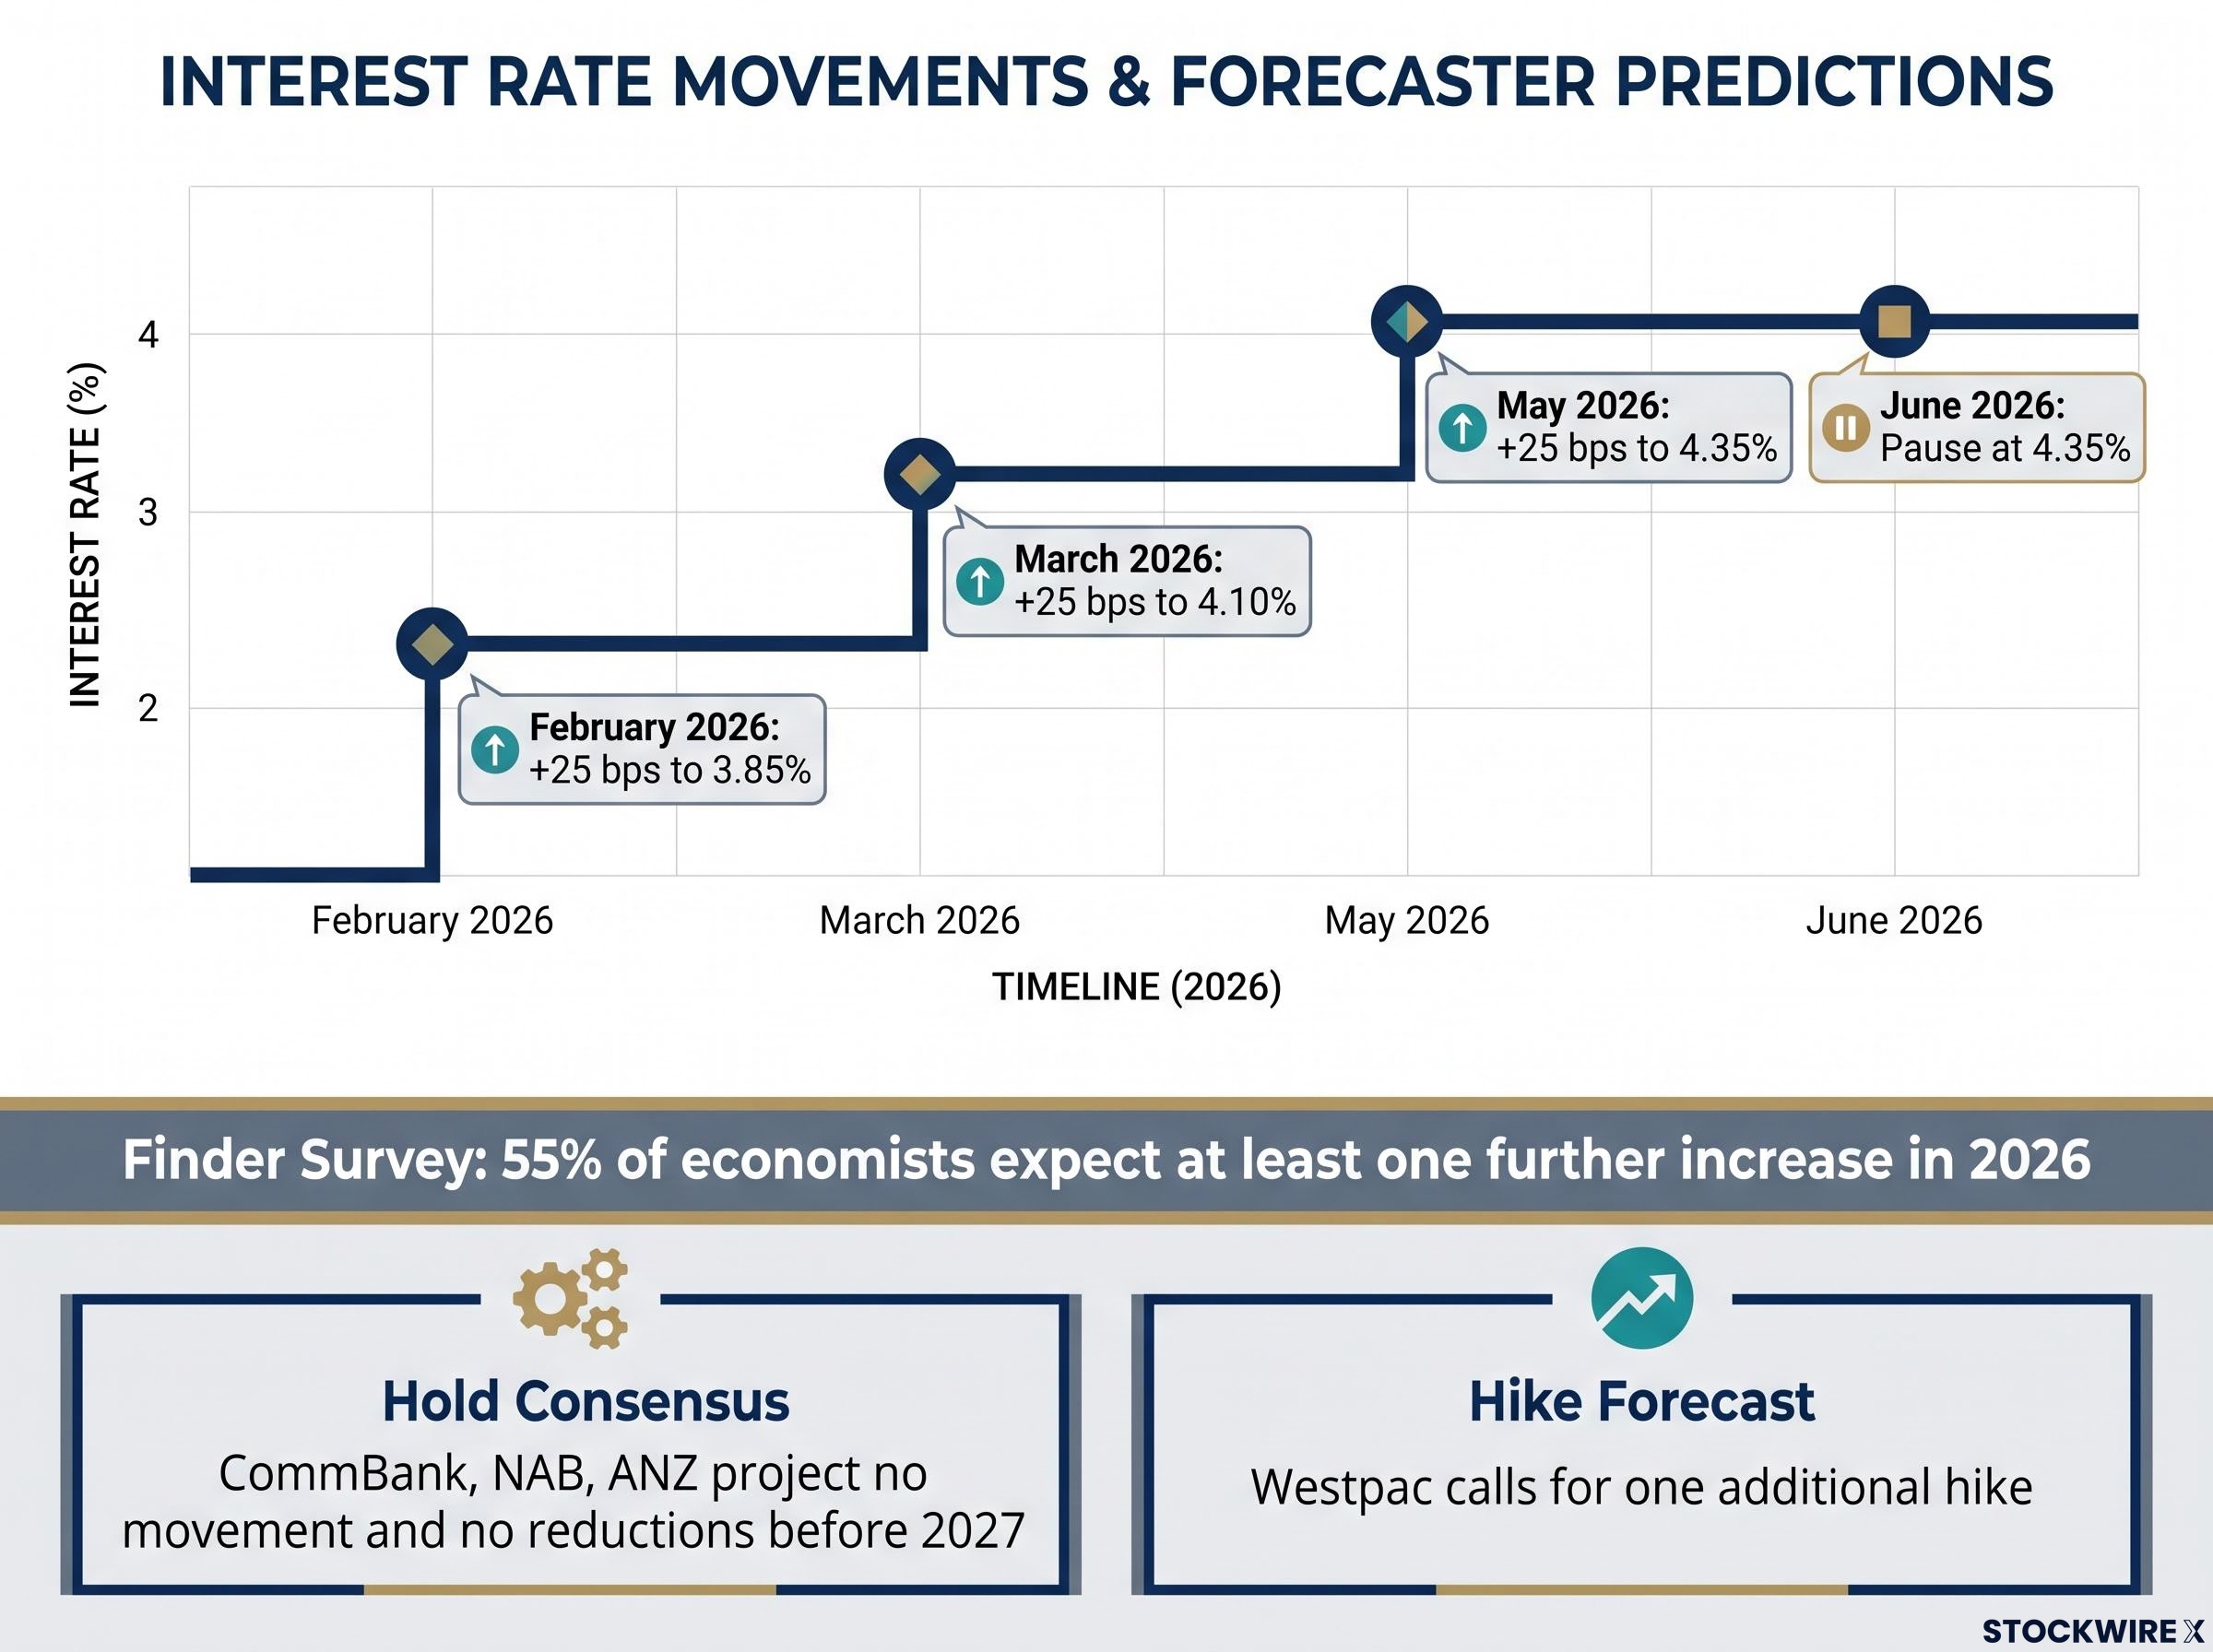
Three successive increases through 2026 brought the cash rate to its current level of 4.35%, a tightening sequence that few forecasters had pencilled in:
The sequence that makes August a live decision traces back to the third consecutive tightening move the RBA delivered in May 2026, when eight of nine Board members voted for the hike and forward guidance language deliberately preserved full optionality on whether further increases would follow.
- February 2026: +25 basis points to 3.85%
- March 2026: +25 basis points to 4.10%
- May 2026: +25 basis points to 4.35%
- June 2026: Pause, to assess the cumulative impact of prior hikes
The June pause was deliberate data-gathering, not a signal that tightening was over. That distinction matters, because it makes August a genuinely live decision rather than a rubber stamp.
Forecaster views are split. The economics teams at CommBank, NAB, and ANZ all favour an unchanged cash rate through the end of 2026, with CommBank’s team taking the firmest position: no movement and no reductions before 2027. Westpac still calls for one additional hike, with August flagged as the most likely meeting.
In Finder’s latest cash rate survey, 55% of economists expect at least one further increase in 2026, and 62% of that group nominate August as the most likely timing.
The dominant hold call carries real credibility. But the minority hike view is not fringe opinion; it comes from one of the four major bank economics teams and from a meaningful share of surveyed economists. That distinction matters when you are trying to interpret the RBA’s statement language in real time.
When big ASX news breaks, our subscribers know first
How each rate outcome reshapes the earnings picture for the major banks
Three scenarios are on the table. They are not equally likely, but each reshapes the earnings picture differently.
A hold at 4.35% is the lowest-disruption outcome. NIMs remain anchored because asset yields and funding costs stay where they are. No additional pressure lands on household balance sheets, keeping arrears and impairment charges from climbing sharply ahead of earnings season. The macro backdrop arrives undisturbed the morning CBA reports.
A hike to 4.60% is marginally supportive for NIMs at the headline level, particularly for banks with large low-cost deposit bases. But it simultaneously raises the probability of climbing arrears and loan impairments, especially among leveraged households and small-to-medium enterprises already absorbing three 2026 increases. The market reaction to a surprise hike would likely be negative: consensus is positioned for a hold, and the re-pricing of both earnings trajectory and credit risk would create short-term volatility. The NIM benefit is real but limited; the arrears risk is open-ended.
A cut is not a 2026 possibility. All four major bank economics teams project no reductions before 2027. If one were to arrive, it would relieve borrower stress but compress NIMs, which would weigh on earnings and, over time, constrain dividend growth.
| Scenario | NIM Impact | Credit Quality Impact | Market Sentiment Signal |
|---|---|---|---|
| Hold at 4.35% | Stable; asset yields and funding costs anchored | No fresh household shock; arrears pressure contained | Benign; supports earnings confidence into reporting season |
| Hike to 4.60% | Marginally positive for lending margins | Higher arrears and impairment risk, particularly leveraged borrowers | Negative surprise; short-term volatility as consensus re-prices |
| Cut (not projected in 2026) | NIM compression; earnings headwind | Borrower relief; reduced stress on household balance sheets | Would signal economic concern; mixed for bank valuations |
Recognising that a hold is the lowest-risk outcome guards against a frequent error: treating higher rates as a straightforward positive for bank earnings while overlooking the damage they can inflict on asset quality at this point in the cycle.
Reading CBA’s result as a sector report card, not just a single stock event
CBA’s June year-end creates a calendar asymmetry that makes its FY26 result unusually powerful as a sector signal. Westpac, NAB, and ANZ all report on September year-ends, which means their full-year numbers arrive months later. CBA’s print on 12 August 2026 is the first hard evidence of how well any major bank has absorbed three 2026 rate hikes at the household and business borrower level.
Three metrics function as sector read-throughs rather than CBA-specific data points:
- NIM trend: The comparison of second-half FY26 NIM against first-half FY26. This reveals whether deposit pricing competition has eroded the margin benefit of the 2026 hikes, a dynamic that applies to every major bank, not just CBA.
- Loan impairments and arrears: Movements in stage-2 and stage-3 exposures and provisioning overlays. These are the front-line indicators of how households and SMEs are coping at 4.35%.
- FY27 management guidance: What CBA’s management says about credit demand, competition, and funding costs will be the first public framework through which Westpac, NAB, and ANZ analysts start building their own sector estimates.
A CBA miss on NIMs or an uptick in stage-3 arrears is not a CBA-specific story. It becomes the working hypothesis for the entire sector until the September year-end banks report their own numbers.
CBA’s Q3 arrears trajectory already offered a preview of this dynamic: personal loan arrears spiked 30 basis points in a single quarter during Q3 2026 and the bank added $200 million to collective provisions, making the FY26 full-year result the next hard datapoint in a deteriorating credit quality sequence.
The dividend signal and what payout ratios reveal
The final dividend level, relative to last year and consensus, carries its own read-through. A flat or rising dividend supports income investor confidence across the sector. A cut, or a declining payout ratio, signals that management sees forward earnings or capital requirements that warrant caution. The ex-dividend date is 19 August 2026, with the dividend payment expected on approximately 29 September 2026.
The two-day sequence and the four ways it can play out
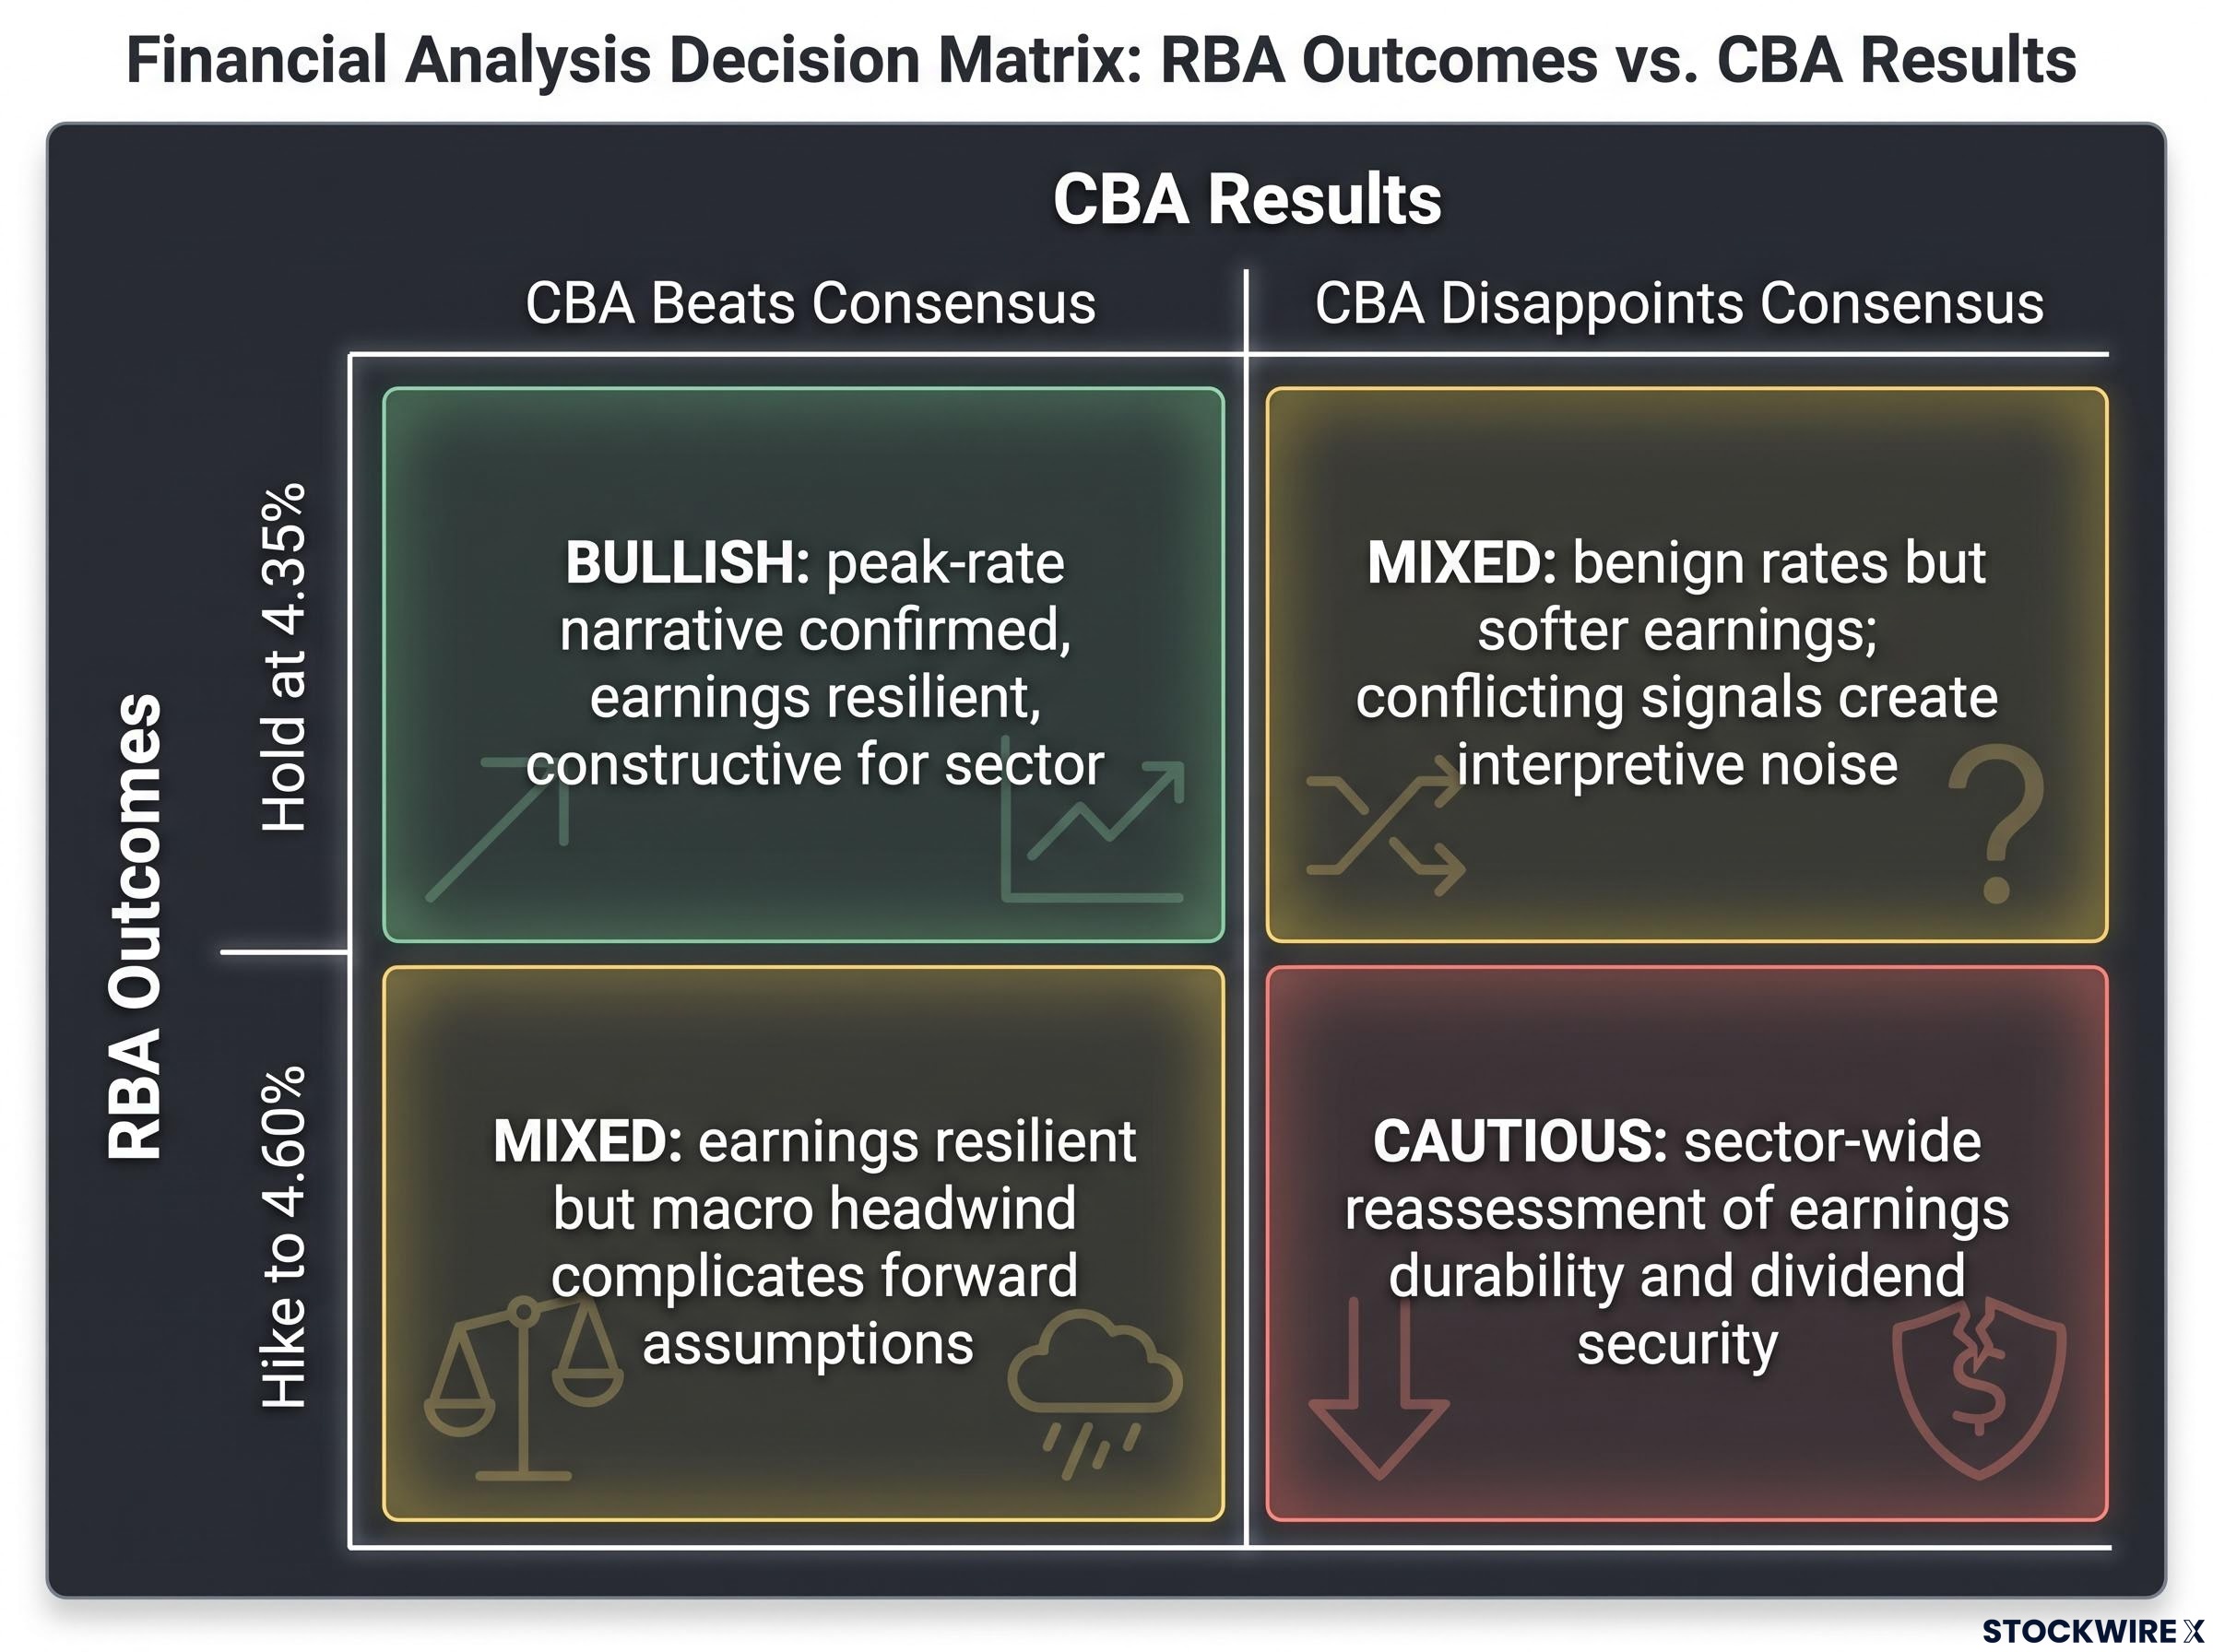
Two events, two possible outcomes each, four combinations. Here is the decision map you can apply in real time on 11 and 12 August without needing to rebuild the framework from scratch.
Bullish alignment: The RBA holds at 4.35% and CBA delivers in-line or better earnings with resilient NIMs, contained impairments, and a maintained or modestly lifted dividend. This removes near-term uncertainty and supports the income case for all four majors heading into the September reporting window. It is the most constructive backdrop Westpac, NAB, and ANZ could ask for.
Cautious alignment: The RBA hikes and CBA highlights margin pressure, higher arrears, or a disappointing dividend. This is the combination most likely to trigger a sector-wide reassessment of earnings durability and dividend security.
The two mixed scenarios are where the market often handles things worst. A hold plus a CBA miss means the macro backdrop is benign but the earnings story is softer than expected, producing conflicting signals that can create short-term selling pressure even among long-term holders. A hike plus a CBA beat creates the opposite tension: macro headwinds paired with resilient earnings, which may hold prices but leaves forward assumptions uncertain.
| RBA Outcome | CBA Beats Consensus | CBA Disappoints Consensus |
|---|---|---|
| Hold at 4.35% | Bullish: peak-rate narrative confirmed, earnings resilient, constructive for sector | Mixed: benign rates but softer earnings; conflicting signals create interpretive noise |
| Hike to 4.60% | Mixed: earnings resilient but macro headwind complicates forward assumptions | Cautious: sector-wide reassessment of earnings durability and dividend security |
Mapping these combinations before either event occurs lets you distinguish between a market reaction that reflects new information and one that reflects noise. That distinction is particularly valuable if you hold CBA for income and need to evaluate price movement around the ex-dividend date separately from the underlying earnings story.
What these events mean in plain terms for the mechanics of bank earnings
The RBA decision and CBA’s result both come down to one core mechanic: how banks make money on the spread between what they charge borrowers and what they pay depositors.
Net interest margin (NIM) is that spread, expressed as a percentage of a bank’s interest-earning assets. It is the difference between the interest rate a bank earns on loans and the rate it pays on deposits and wholesale funding. When the cash rate rises, lending rates typically rise too, which should widen the margin. But the relationship is not mechanical.
Net interest margin mechanics are central to interpreting both the RBA statement and CBA’s result: the spread between lending yields and funding costs is not a fixed relationship, and CBA’s structural position as the bank with the largest retail deposit franchise makes its NIM the most closely watched compression indicator in the sector.
Here is the causal chain:
- The cash rate changes: The RBA raises (or holds) the official rate.
- Deposit competition adjusts: Banks compete for retail deposits by lifting savings and term deposit rates, which pushes up funding costs.
- NIM moves: If funding costs rise faster than lending yields, NIM compresses even in a rising rate environment.
The second-half FY26 NIM figure in CBA’s result is the first hard evidence of whether this compression has occurred after three 2026 hikes.
On the credit quality side, loan classifications tell you how borrowers are coping. Stage-2 signals a significant increase in credit risk: the borrower is under stress but still making payments. Stage-3 means the loan is impaired, meaning the borrower has defaulted or is expected to. A rise in either during the 4.35% rate period is a direct indicator of household and SME financial strain.
Why deposit competition is the variable that matters most right now
When rates are elevated, banks actively compete for retail deposits by raising term deposit and savings account rates, and those higher funding costs can eat into the NIM gains that rising lending rates would otherwise deliver, particularly for banks with large retail deposit bases. CBA, with the largest retail deposit franchise in Australia, is the most exposed to this dynamic and therefore the most instructive read-through for the sector.
These mechanics connect directly to dividends. Sustained NIM compression or rising impairment charges reduce net profit, which constrains the payout ratio and limits dividend growth capacity. Understanding this chain lets you distinguish between a CBA result that disappoints on earnings because of a deliberate repricing strategy (potentially positive for long-term credit quality) and one that disappoints because of genuine deterioration. That distinction changes the implications for Westpac, NAB, and ANZ entirely.
What investors should actually watch when the statements land
Two events, two watch-lists. Here is what to prioritise in real time.
RBA statement (2:30 pm AEST, 11 August 2026):
- Inflation trajectory language: Compare the August statement with June. Does the Board sound more confident that inflation is tracking toward the target band, or more concerned about persistence?
- Household stress references: Any explicit mention of mortgage stress, arrears, or consumption weakness feeds directly into bank credit-risk assumptions.
- Forward guidance for 2027: Watch for signals on when the Board expects it could begin easing. This shapes medium-term expectations for NIMs and loan growth across the sector.
CBA result (12 August 2026):
- Second-half FY26 NIM versus first-half FY26: This is the single most important margin datapoint. Has deposit competition eroded what the hikes delivered?
- Stage-2 and stage-3 movements: Rising impaired exposures or provisioning overlays signal household and SME stress that will likely flow through to the September year-end banks.
- Final dividend level and payout ratio direction: Flat, higher, or lower relative to last year and consensus. The direction tells you whether management is confident in forward earnings or conserving capital.
- FY27 outlook commentary: Management guidance on credit demand, competition, and funding costs sets the framework analysts will use for Westpac, NAB, and ANZ estimates.
Income investors should note: to receive CBA’s final dividend, you need to be on the register by close of trade on 18 August (the day before the 19 August ex-dividend date). The payment is expected approximately 29 September 2026. The share price typically adjusts on ex-dividend day to reflect the dividend amount, so short-term price dynamics around that date diverge from income fundamentals. Do not conflate the two when making decisions.
This analysis is for informational purposes only and should not be considered financial advice. Investors should conduct their own research and consult with a licensed financial adviser before making investment decisions.
What the sequence will and will not resolve for ASX bank shareholders
By 13 August, you will know two things with certainty: the near-term rate trajectory and CBA’s NIM and arrears position at what may prove to be the peak of the cycle. You will also know whether the sector’s dividend story has held up through three 2026 rate increases.
What the next 10 days will resolve:
- Whether the cash rate stays at 4.35% or moves higher, directly testing Westpac’s dissenting hike call against the hold consensus from CommBank, NAB, and ANZ
- CBA’s margin and credit quality position after a full year at elevated rates
- Whether the final dividend supports or undermines income investor confidence heading into the September window
What remains open regardless of outcome:
- The NIM trajectory if deposit competition intensifies in FY27
- The extent of household balance sheet stress at Westpac, NAB, and ANZ, which run different mortgage books and customer profiles to CBA
- The macro outlook if the RBA signals further tightening remains live for late 2026
- The full sector picture, which requires Westpac, NAB, and ANZ to validate CBA’s read-through with their own September year-end results
A clean bullish outcome on 11 and 12 August narrows the uncertainty range for the sector. It does not eliminate it. The September year-end banks still need to deliver their own numbers, and the RBA has not committed to anything beyond the August meeting.
For investors wanting to place the August catalyst sequence in a longer-term risk framework, our deep-dive into cyclical versus systemic bank risk examines the specific signal set that distinguishes a rate-cycle drawdown from a structural crisis, including how offshore wholesale funding dependence transmits macro stress directly into Australian bank dividends.
| Date | Event |
|---|---|
| 11 August 2026, 2:30 pm AEST | RBA cash rate decision |
| 12 August 2026 | CBA FY26 full-year result and final dividend announcement |
| 19 August 2026 | CBA shares trade ex-dividend |
| ~29 September 2026 | CBA final dividend payment |
| September year-end window | Westpac, NAB, and ANZ full-year results |
Past performance does not guarantee future results. Financial projections are subject to market conditions and various risk factors.
—