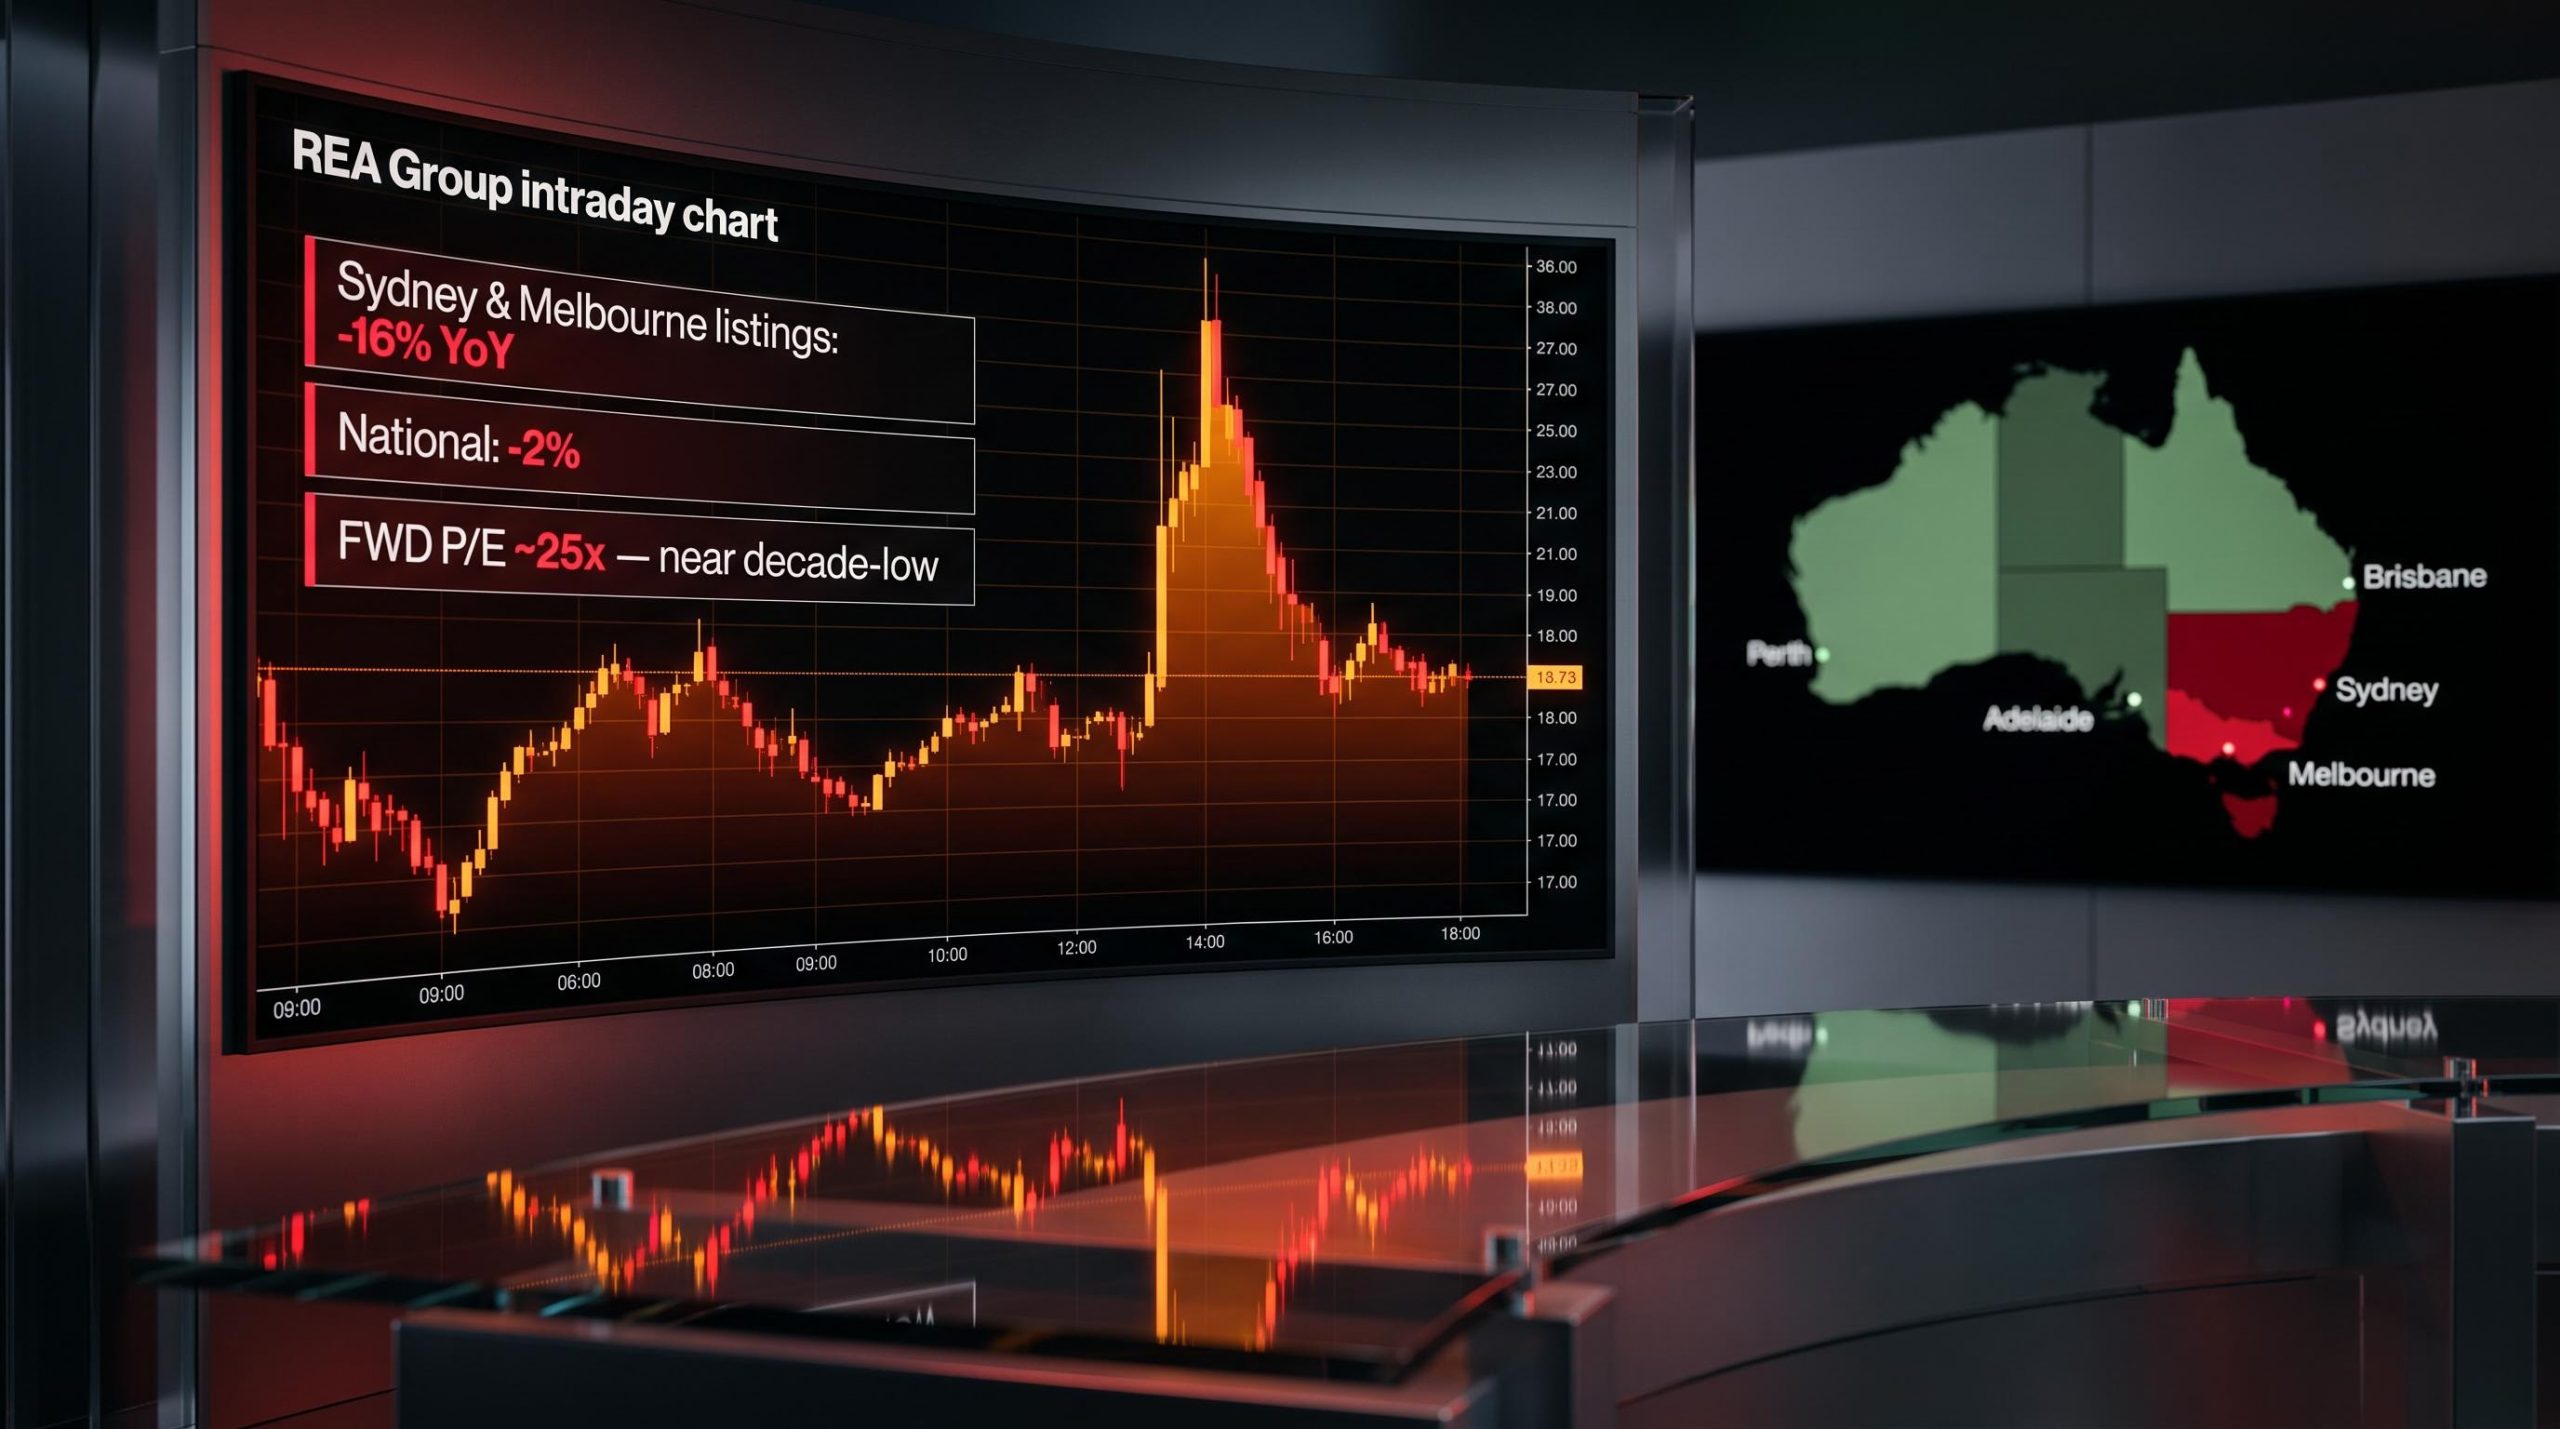
REA Group delivered its FY26 result on 6 August 2026, and the stock moved. Briefly. An earnings beat pushed shares up as much as 5% intraday before they settled back toward flat. The headline numbers were good enough. The detail buried underneath was not.
July 2026 listings in Sydney and Melbourne fell 16% year-on-year. The national figure was minus 2%. That gap between the headline and the geographic detail is not a rounding error. It is the tension that defines every variable in the FY27 investment case.
For investors weighing a stock that sits near a decade-low forward multiple after an approximately 30% decline over the prior year, the question is binary but not simple: does this valuation represent genuine value, or has the market correctly identified a structural risk and priced it in? Here is a framework built across six dimensions, from the geographic mix problem through to what a credible October Investor Day outcome needs to look like for the bull case to hold.
Why Sydney and Melbourne move the dial more than any other market
Two cities explain most of what matters for REA Group’s revenue trajectory. Broker estimates put Sydney and Melbourne’s combined share of national listing volume on the platform at approximately 40%. That figure alone makes their trajectory disproportionately important. But the concentration risk compounds in a way that headline national numbers actively obscure.
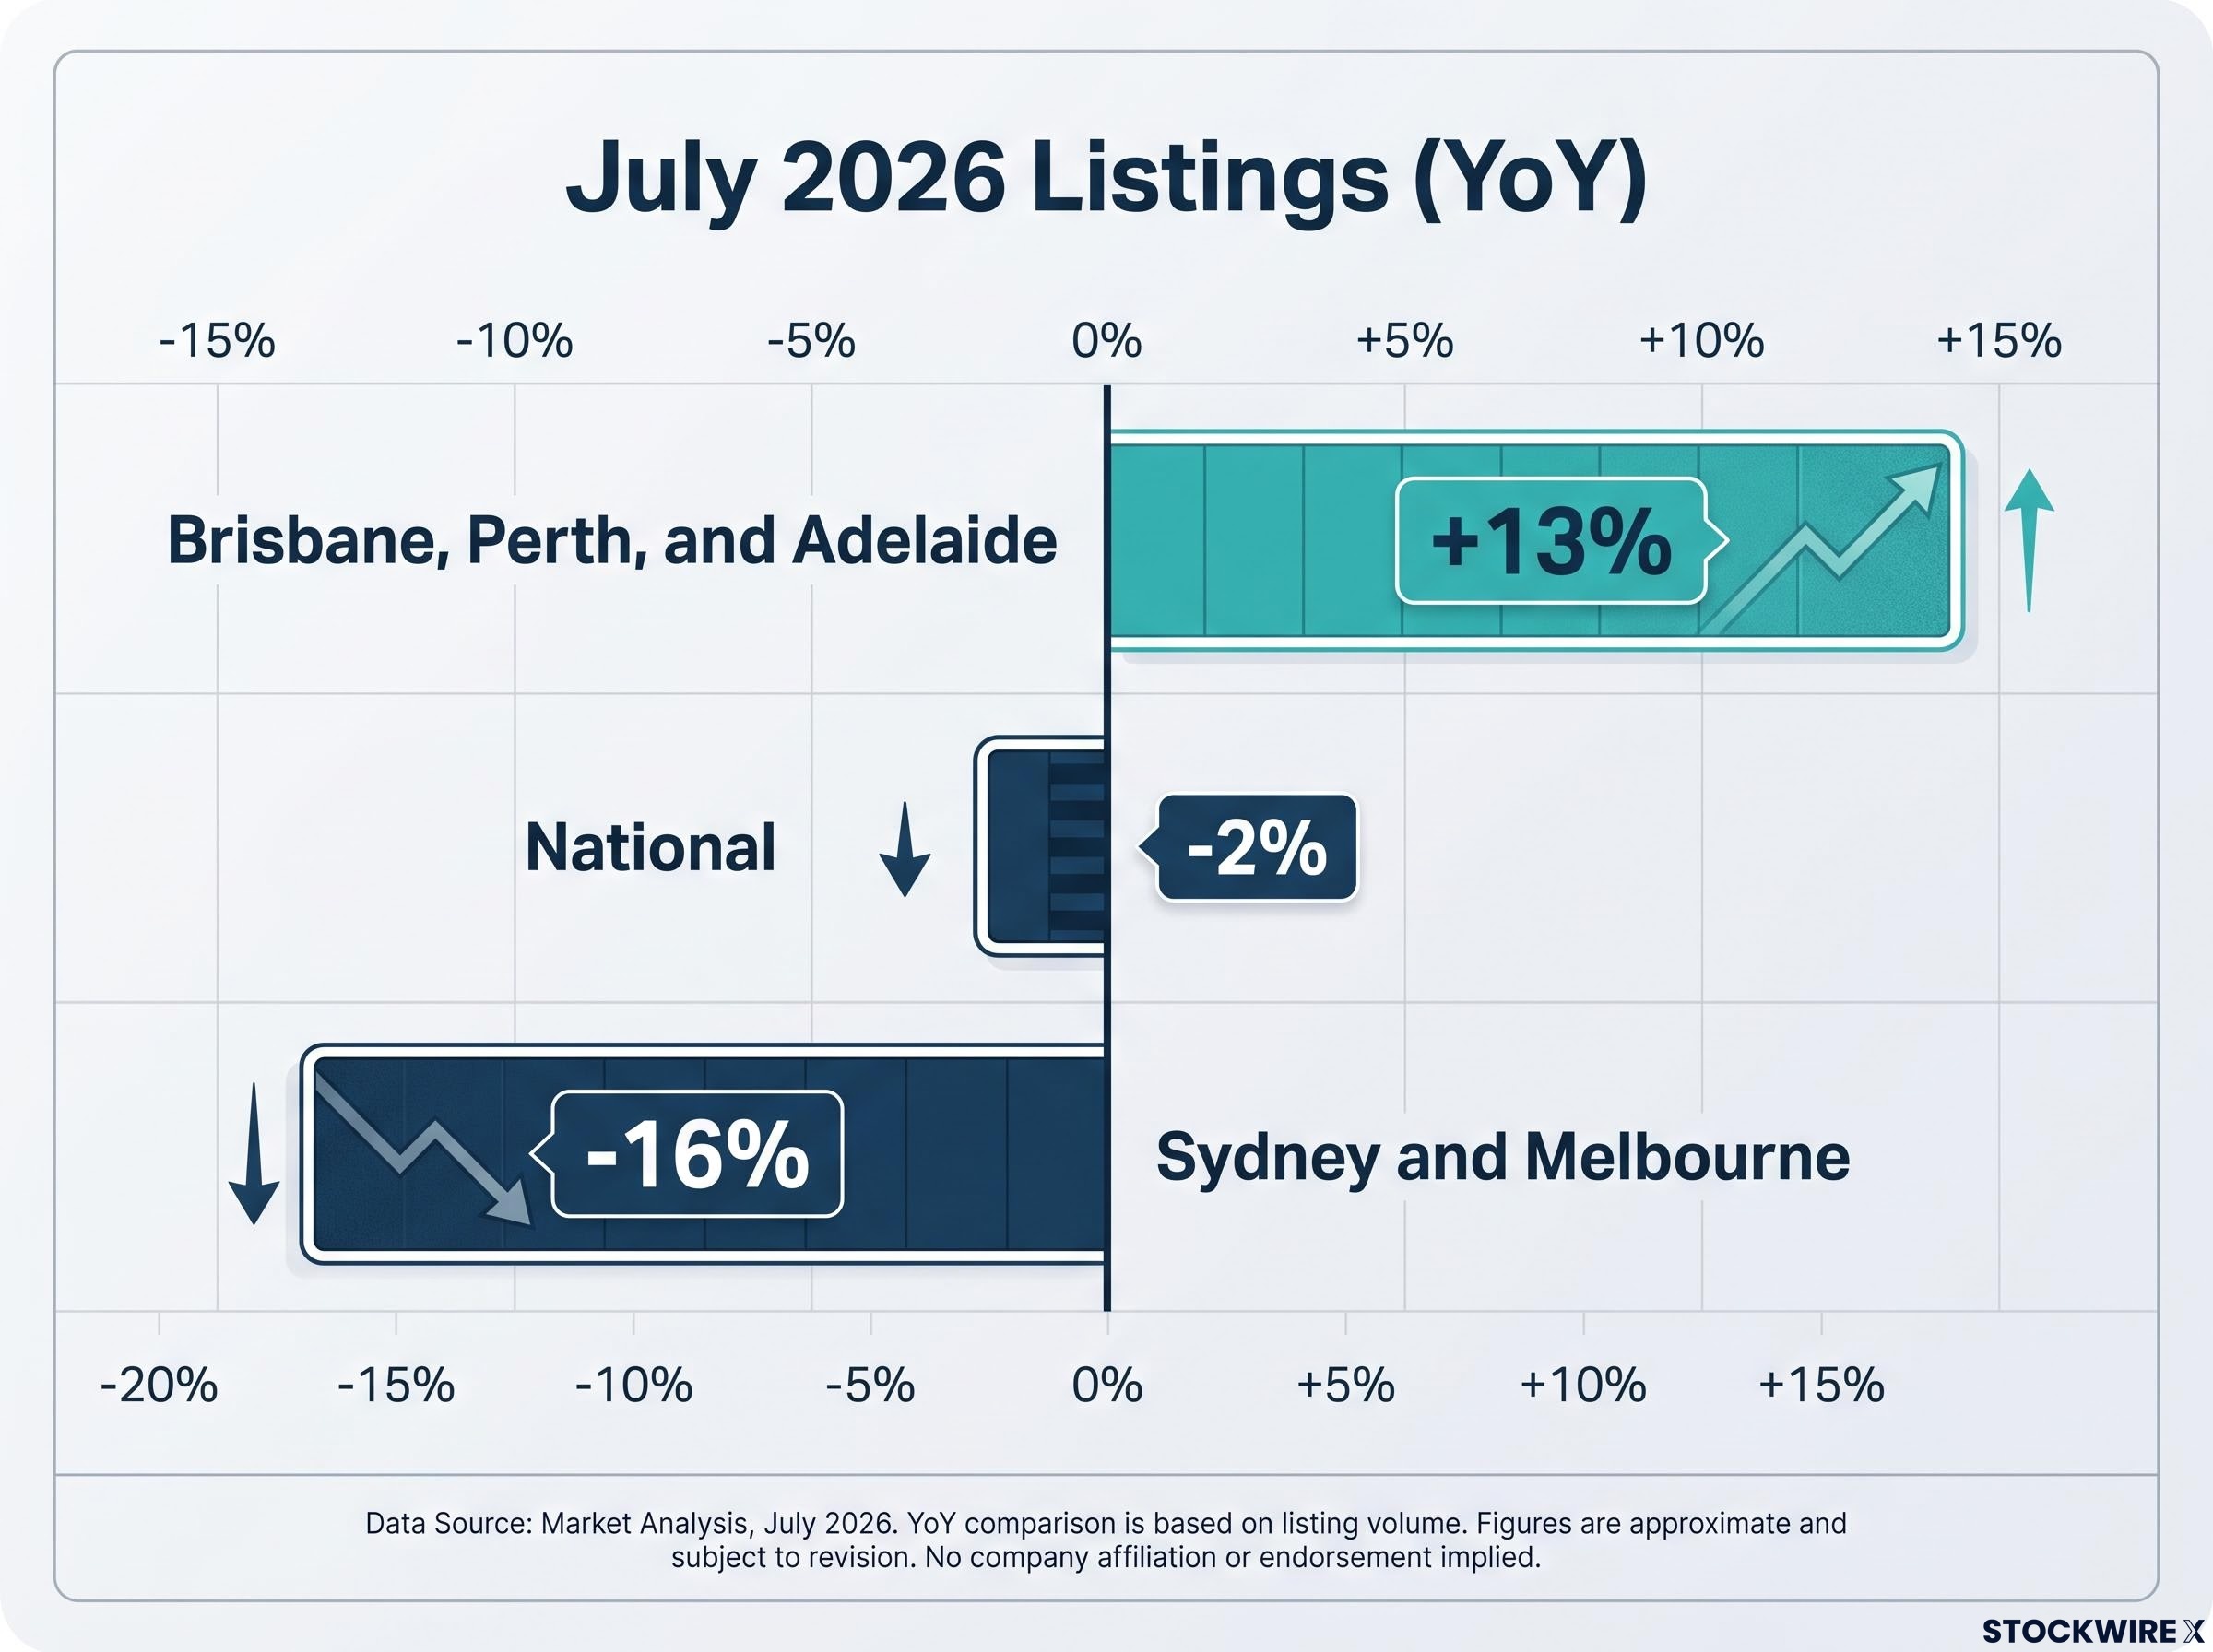
| Region | July 2026 listings (YoY) |
|---|---|
| Sydney and Melbourne (combined) | -16% |
| Brisbane, Perth, and Adelaide (combined) | +13% |
| National | -2% |
The national minus 2% figure looks almost manageable. It is not. Volume growth is occurring precisely where yield is lowest, and volume is falling precisely where yield is highest. That is not a proportional offset. It is an adverse mix shift that hits revenue harder than any headline number suggests.
BofA estimates that FY26 activity in Sydney and Melbourne was running 7-8% above eight-year averages, which means a degree of mean reversion was always the base case rather than a tail risk.
The yield multiplier that turns a moderate volume decline into a material revenue event
Sydney and Melbourne generate the highest advertising yields, meaning revenue per listing, on REA’s platform. When volume declines in these cities, two things happen simultaneously: the number of revenue events falls, and the average quality of each remaining revenue event deteriorates as lower-yield markets account for a growing share of total listings.
That compounding mechanism is why a roughly 5% national volume decline could translate into a revenue impact materially larger than the percentage implies. The national headline is actively misleading here, and investors who anchor to it will systematically underestimate the earnings risk.
When big ASX news breaks, our subscribers know first
The policy clock: what the May budget changes are doing to FY27 listing supply
The behavioural transmission from policy to listing volumes is direct. Two tax changes from the May 2026 budget are at work: the removal of negative gearing on established homes for investors, and changes to capital gains tax treatment taking effect from July 2027. Less generous tax treatment extends holding periods. Longer holding periods mean fewer properties coming to market. Fewer properties mean fewer listings on REA’s platform.
The evidence that this transmission is already operating arrived quickly.
Morgans noted that capital city property sales dropped 16% in the June quarter in the wake of the May 2026 budget, with clearance rates across capital cities close to 50% and stock building as turnover slowed.
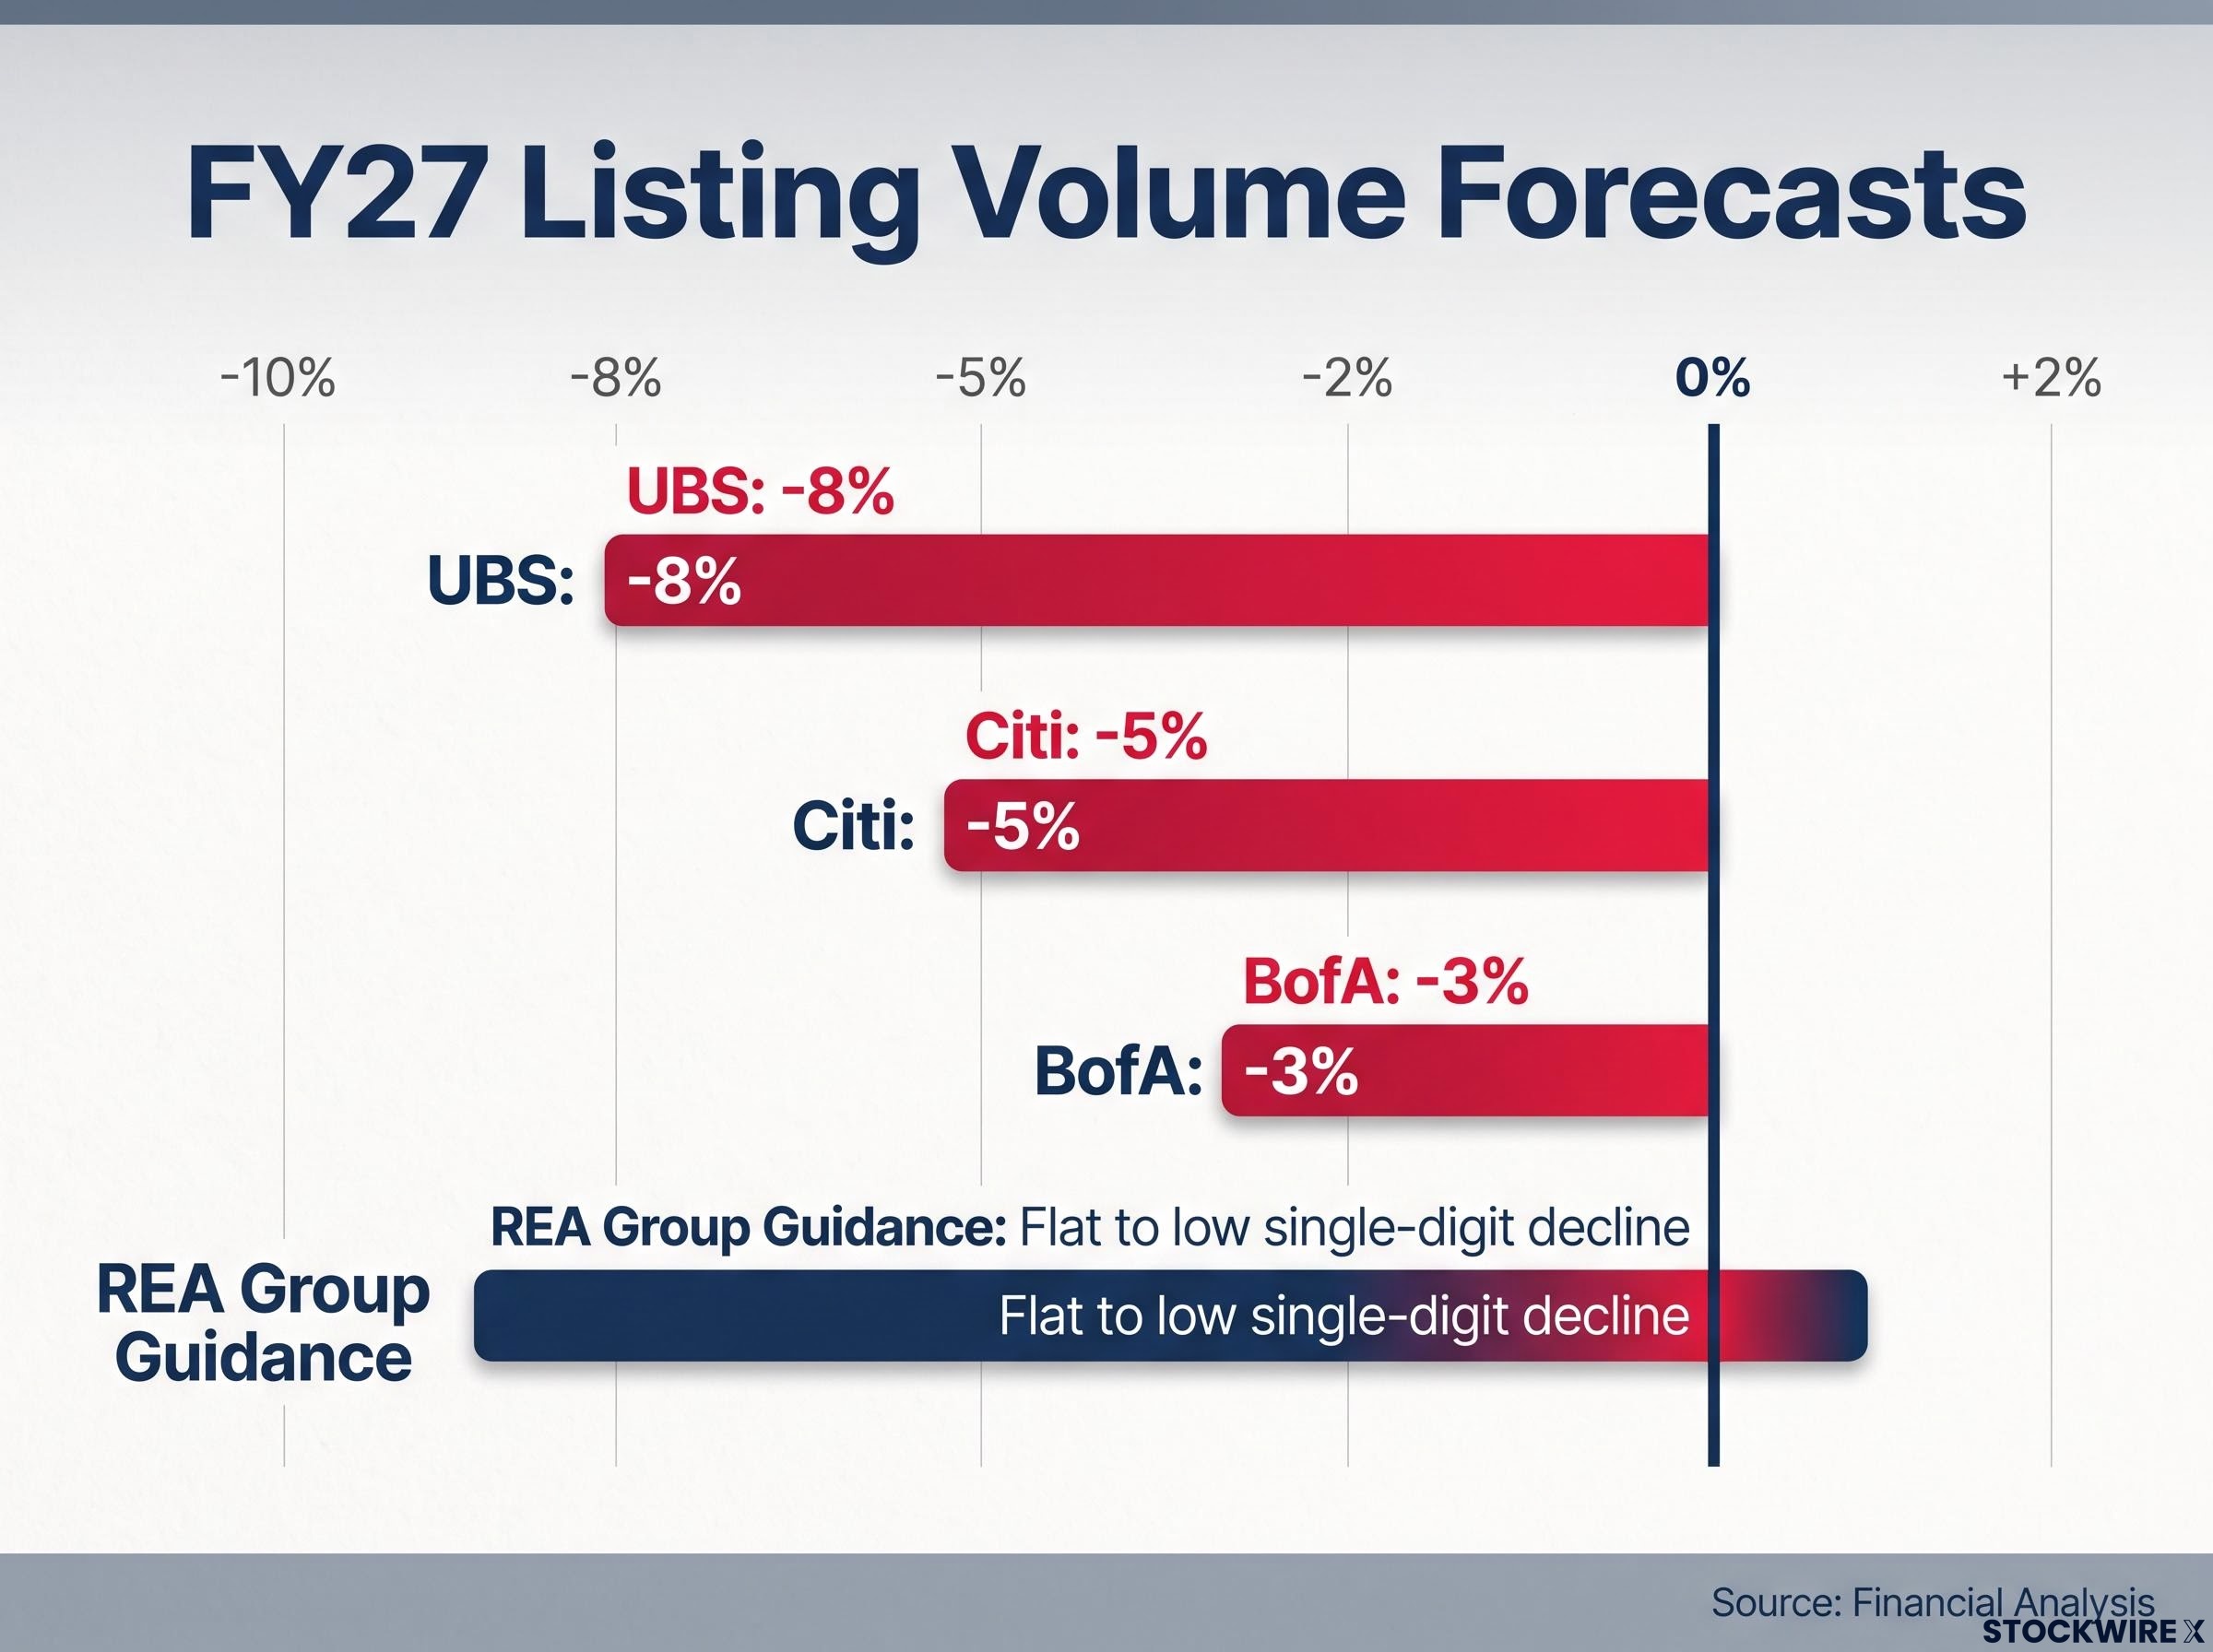
Broker volume forecasts have moved materially lower as a result:
- BofA: approximately minus 3% nationally for FY27
- Citi: minus 5% for FY27
- UBS: revised from flat to minus 8% for FY27, citing investor-focused tax curbs and macro pressure
- REA Group guidance: flat to low single-digit decline
The fact that UBS revised from flat to minus 8% after the budget tells you the policy signal was large enough to force a meaningful re-rating of the volume outlook. REA’s own guidance of flat to low single-digit decline increasingly looks like the optimistic scenario rather than the central case.
Bell Potter has observed that Sydney and Melbourne house prices were drawing close to annual declines as of May 2026, and that REA’s earnings per share have a track record of contracting whenever dwelling prices fall on a year-on-year basis. That historical relationship is the mechanism by which a listing slowdown converts into an earnings revision cycle, and the cycle appears to have begun.
What REA’s pricing strategy can and cannot do
The primary FY27 earnings lever is the 8% Premiere+ price increase, supplemented by add-on product attachment and AI-driven premium product conversion. Three mechanisms support yield growth:
- The base 8% Premiere+ price increase, applied regardless of geography
- Higher attach rates on add-on products per listing
- AI tools deployed to improve conversion to premium products (no revenue figure yet disclosed)
Controllable residential buy yield growth guidance sits in the low double-digit percentage range. That number is achievable on the mechanics alone. CEO Cameron McIntyre has argued that softer market conditions could in fact strengthen the case for premium placement, since vendors whose properties are sitting longer are likely to seek out maximum exposure on the platform commanding the widest audience. The logic is sound: when a listing is harder to sell, the marginal value of premium positioning increases.
Where the pricing story breaks down: geographic mix as a structural diluter
The distinction that matters here is between controllable yield growth and reported blended yield growth. Controllable yield captures what REA can achieve through pricing and product regardless of where listings occur. Reported blended yield captures what actually shows up in the financials after geographic mix is accounted for.
BofA forecasts reported residential buy yield growth of approximately 10.5% in FY27, versus market expectations closer to 12%. That roughly 1.5 percentage point gap is the quantification of the geographic mix problem. It tells you how much the Sydney and Melbourne concentration risk is already costing in yield terms, and it is the benchmark for assessing whether pricing execution can truly offset the volume headwind.
The 8% price rise will not show up as 8% yield growth in reported figures if the listing mix keeps shifting toward lower-value markets. Pricing power is real. Its limits are geographic.
India exit: what selling Housing.com actually changes for the investment case
The sale of Housing.com to Aurum PropTech, with REA retaining a 24.9% minority equity stake, was announced alongside the FY26 results. Brokers had long viewed the Indian segment as a capital consumer with structural differences from the Australian core, and the exit delivers three clear positives:
- A cleaner, more focused Australian cost base
- Improved reporting clarity for analysts modelling the domestic business
- Capital freed for redeployment or return
For FY27, REA has guided operating costs on a continuing operations basis (excluding India) to grow at a mid-single-digit rate, with that figure stepping up to mid-to-high single digits once acquisitions are factored in.
Macquarie forecasts FY27 EBITDA growth of approximately 11% year-on-year, but notes this is conditional on listing volumes holding up and successful execution of the pricing strategy.
The India exit is unambiguously positive for margin clarity. But it sharpens, rather than softens, the concentration question. With the Indian business deconsolidated, every unit of operating leverage is now geared entirely to Australian listing volumes. There is no international buffer. If Sydney and Melbourne listings continue to weaken, the cleaner cost base amplifies the earnings sensitivity rather than offsetting it.
Reading the valuation: what a near decade-low multiple is and is not telling you
At the time of the FY26 results, REA Group was trading at a forward price-to-earnings multiple of approximately 25 times expected earnings, a level that sits close to the lowest point recorded across the past decade and a considerable distance from the premium multiples the company commanded during its high-growth years.
On results day, the stock swung between modest gains and losses across the session, touching intraday peaks of around 5% before returning toward breakeven. The tension was visible in the price action: an earnings beat pulled in one direction, the absence of a volume recovery narrative pulled in the other.
The bull case conditions
For the current multiple to represent genuine value, several things need to be true simultaneously. Volume in Sydney and Melbourne needs to stabilise rather than deteriorate further through FY27. The tax reform impact needs to prove shorter in duration than the most pessimistic scenarios assume. Reported yield growth needs to land at or above BofA’s 10.5% estimate. And the October Investor Day needs to deliver hard audience and conversion data rather than narrative alone.
The bear case path
If volumes fall toward the UBS minus 8% or Citi minus 5% scenario rather than management guidance, earnings revisions follow. The mid-20s multiple could compress further if the market concludes that REA’s structural growth rate has reset permanently lower.
Bell Potter notes that REA’s EPS has historically declined in periods of year-on-year dwelling price declines, a pattern directly relevant given Melbourne and Sydney prices were approaching annual declines as of May 2026.
At 25 times forward earnings, investors are not being asked to pay a premium for certainty. They are being asked to believe the volume decline is cyclical rather than structural, and that distinction is not yet evidenced in the data.
The October Investor Day as a line in the sand for the FY27 thesis
The October 2026 Investor Day is the point at which management must convert the pricing narrative into evidenced data. Three categories of disclosure will either resolve or sustain the market’s current uncertainty, ranked by investor priority:
- Monthly listing trends for Sydney and Melbourne through September, specifically whether the July minus 16% figure was front-loaded tax-reform anxiety or the opening print of a sustained decline
- Granular yield guidance by product tier, including the gap between controllable and reported blended yield after geographic mix effects
- Concrete AI and audience metrics, including audience share versus Domain, engagement data, and measurable conversion improvements from AI-deployed features
REA’s own guidance of flat to low single-digit national decline is the benchmark management must demonstrate remains achievable. The 8% Premiere+ price increase and controllable yield guidance are the deliverables it has committed to.
Defining a credible outcome versus a disappointing one
A credible October event delivers evidence that audience share is growing, premium product adoption is resilient even in weak markets, and reported yield guidance narrows the gap with controllable yield guidance. If those three conditions are met, the near-decade-low multiple starts to look like an entry point.
A disappointing outcome delivers soft aggregate listing data through September, no granular yield disclosure, and AI claims without conversion metrics. If the event is narrative-heavy and the Sydney and Melbourne data remains weak, the market will maintain its view that these two cities represent the central unresolved risk for the stock.
What the Sydney and Melbourne data resolves, and what it does not
The FY26 results confirmed several things:
- REA’s pricing power and domestic dominance remain intact
- The India exit improves cost clarity and operating focus
- Controllable yield growth in the low double digits is mechanically achievable
What the results did not resolve is the one variable that matters most: whether the July listing decline in Sydney and Melbourne is a temporary adjustment or the beginning of a structurally lower turnover environment driven by the tax reform cycle. The broker range tells the story of that uncertainty: BofA at minus 3%, Citi at minus 5%, UBS at minus 8%, and REA guiding flat to low single-digit decline.
At approximately 25 times forward earnings, the near-decade-low multiple is a genuine signal of risk priced in. But it is not a margin of safety unless the listing trajectory in Sydney and Melbourne proves less severe than the most pessimistic broker scenarios suggest. The valuation is conditionally attractive. The key condition is geographic. And the next data that resolves it arrives before and at the October Investor Day.
This article is for informational purposes only and should not be considered financial advice. Investors should conduct their own research and consult with financial professionals before making investment decisions. Past performance does not guarantee future results. Financial projections are subject to market conditions and various risk factors.