
REA Group just delivered a clean sweep on its FY26 earnings, beating analyst forecasts on profit, revenue, dividend, and listings simultaneously. That combination rarely happens in a single reporting period.
The result lands in a property market that spent most of the year generating more caution than confidence. National listing volumes were widely expected to fall. Instead, they held flat. Yield expanded by 13%. Monthly visitors hit a record. The numbers do not describe a company riding a boom; they describe a platform that grew earnings 15% through a mediocre cycle. That is the story worth understanding.
Here is a breakdown of each layer of the FY26 result: what the beat actually signals about REA’s earnings quality, what the dividend move means, and what the cautious FY27 outlook changes for investors sitting on a position or considering one.
The headline numbers: what REA reported and where it beat
The beat was not narrow. REA Group exceeded consensus estimates across every major earnings metric, with profit growing materially faster than revenue, the signature of genuine platform leverage rather than a one-off accounting tailwind.
| Metric | Reported | Consensus | Beat / Miss |
|---|---|---|---|
| Revenue | $1,793M (+7%) | $1,790M | In line |
| Core EBITDA | $1,088M (+12%) | $1,060M | +2.6% |
| Core NPAT | $650.5M (+15%) | $637.3M | +2.1% |
| Core EPS | $4.93 (+15%) | $4.85 | +1.6% |
National Buy listings came in flat, beating the guided decline of 1-3%. The Australian operating margin reached 66%, with costs held steady through the year.
Core NPAT grew 15% on 7% revenue growth. That gap is the clearest signal of earnings quality in the result: profit is compounding faster than the top line, driven by pricing power and cost discipline rather than volume tailwinds.
For investors evaluating whether REA’s growth is structural or cyclical, a multi-metric beat through a mediocre property cycle makes the structural case clearly. This is not a business that needed a boom to deliver.
When big ASX news breaks, our subscribers know first
Why the dividend move deserves separate attention
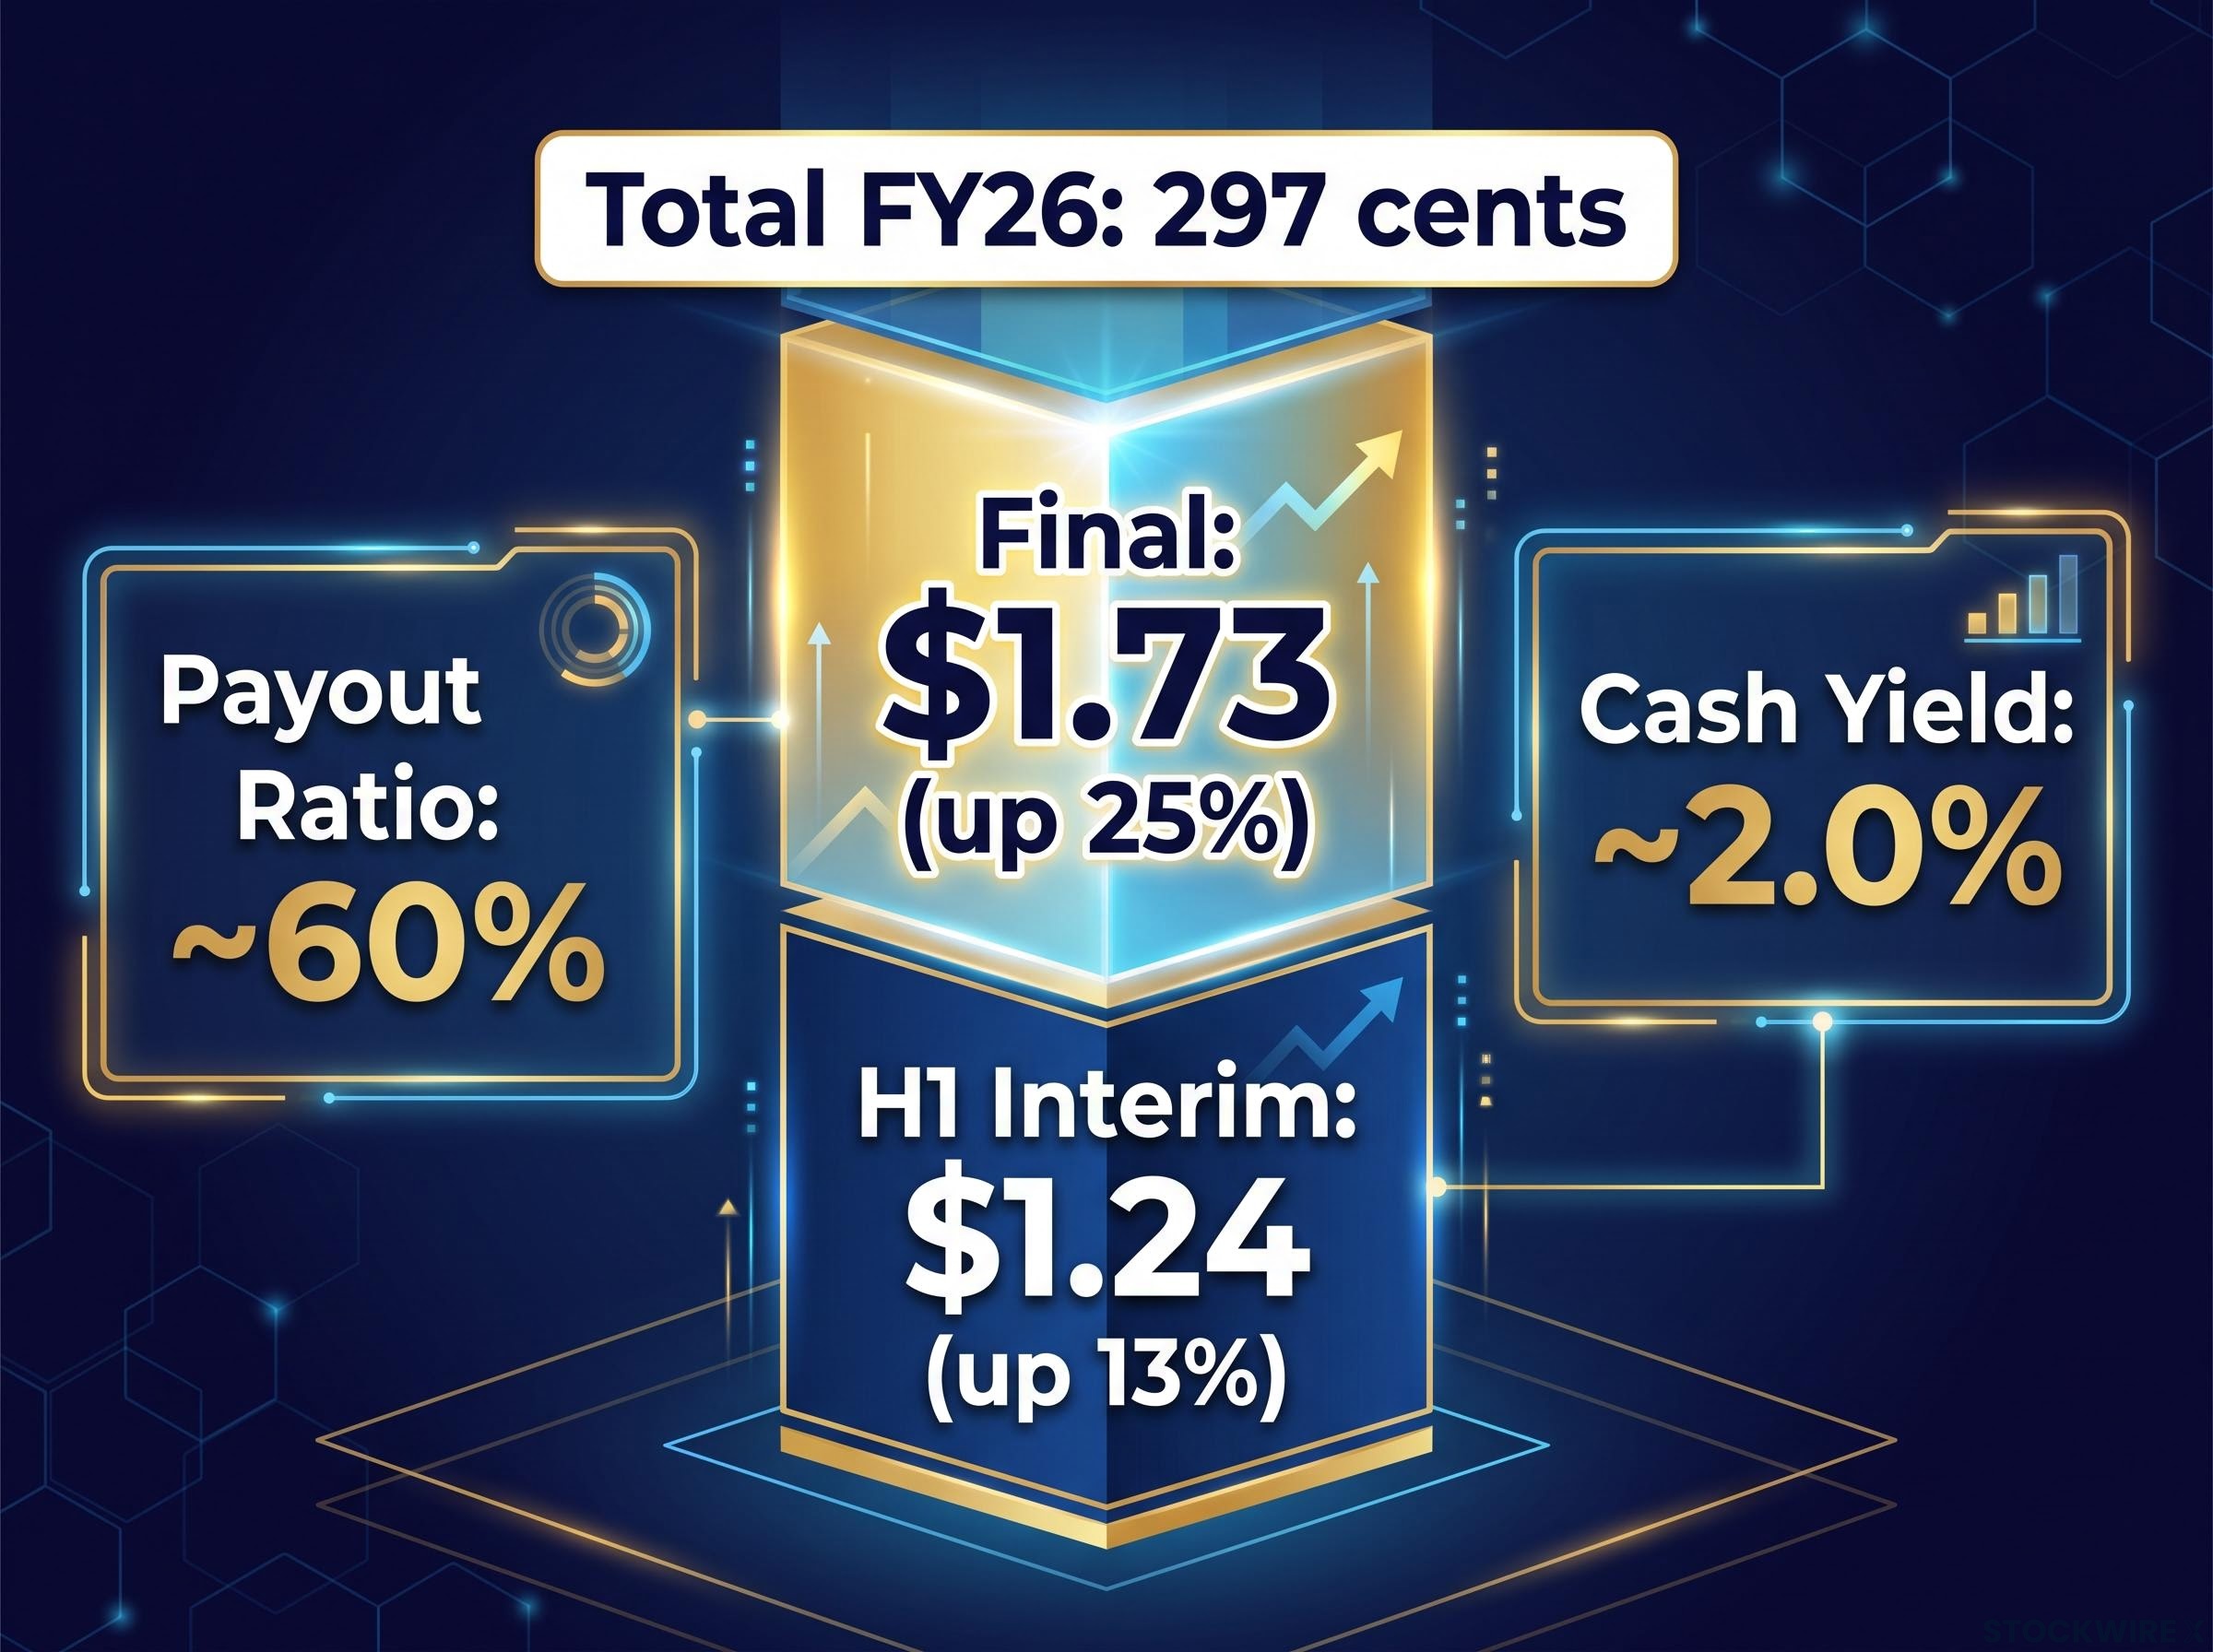
REA closed out FY26 with a fully franked final dividend of $1.73 per share, representing a 25% increase on the prior year. Across the full year, shareholders received a total of 297 cents per share.
- H1 FY26 interim dividend: $1.24 per share, fully franked, up 13%
- Final FY26 dividend: $1.73 per share, fully franked, up 25%
Against analyst estimates, the surprise was material. Macquarie had forecast 295 cents for the full year (marginally behind). Morgans had forecast 281.4 cents, putting the actual result roughly 5.5% above that estimate.
A 25% lift in the final dividend against a payout ratio of approximately 60% signals management confidence that FY26 earnings quality is durable enough to substantially raise shareholder returns without compromising the balance sheet.
The payout ratio is the context that matters here. At approximately 60% of core EPS ($4.93), REA is returning a meaningful portion of earnings while retaining enough cash for reinvestment. The cash dividend yield sits at approximately 2.0% at indicative prices near $147-$148, which is modest in headline terms. But for Australian resident investors, the fully franked nature of the dividend adds after-tax value that a raw yield figure does not capture. The combination of a sustainable payout ratio and a 25% growth trajectory makes this dividend stream more relevant to income-aware portfolios than the headline yield alone suggests.
The franking credit value attached to REA’s fully franked dividend materially alters the after-tax return calculation for Australian resident investors, particularly those in super funds and SMSFs where the effective gross-up can close much of the gap between REA’s modest headline yield and the income requirements of a diversified portfolio.
What flat listings and record audiences actually mean
Flat national Buy listings for FY26 does not sound like a headline. But set against the guided decline of 1-3%, it counts as a beat, and it provides the backdrop for a more important story: REA’s ability to grow earnings regardless of what listings do.
- National Buy listings: came in at zero growth for the full year, ahead of the company’s own guidance for a decline of 1-3%
- Residential Buy yield growth: delivered 13% across FY26, consistent with what the business had guided investors to expect
- Average monthly visitors: reached 12.7 million on a monthly average basis, a figure CEO Cameron McIntyre confirmed as a new record for the platform
The listings result is relief, not strength. The property cycle remains cautious. What matters more is the 13% yield growth that ran through the entire year, converting a flat volume environment into 15% profit growth.
KPMG’s Australian housing market outlook for 2026-2027 flags rising rates and affordability constraints as ongoing headwinds to listing supply, providing context for why REA’s ability to grow earnings through a flat volume environment carries particular weight in the current cycle.
The yield-versus-volume equation
The clearest demonstration came early. In Q1 FY26, national listings fell 8%. Residential revenue still grew 4%. The compensating mechanism is yield: REA charges agents and vendors for listing exposure, and the value of that exposure depends on audience depth. With 12.7 million monthly visitors and no comparable alternative, REA can raise pricing without proportionate volume loss.
CEO McIntyre highlighted the platform’s audience scale as a stabilising force in a soft listings market. That framing is accurate. Sellers and agents pay premium pricing because the audience is structurally hard to replicate. The combination of a record audience and 13% yield growth in a soft volume year tells investors that REA’s pricing power is audience-driven rather than cycle-driven, which is why the platform can compound earnings even when the property market is not cooperating.
REA’s competitive moat rests on roughly 80% of Australian real estate audience minutes and a visit frequency approximately three times that of Domain, a structural asymmetry that gives the platform its pricing leverage and makes the audience-driven yield story defensible across cycles.
Understanding REA’s platform economics for new investors
REA Group makes money by charging real estate agents and property vendors for listing exposure on realestate.com.au. The value of that exposure is directly tied to audience size: more buyers and renters on the platform means more reason for sellers to pay for premium placements.
What makes the business unusual is its cost structure. The platform is already built. Servers, software, and sales teams are largely fixed costs. When a new listing goes live or another user visits the site, the incremental cost to REA is minimal. That means incremental revenue drops largely to the bottom line.
This is operating leverage, and the FY26 result shows it clearly:
- Fixed cost base: Australian operating costs held steady through FY26, so revenue growth flowed to profit
- Audience-driven pricing power: Record monthly visitors of 12.7 million give REA the leverage to push yield higher each year
- Incremental margin leverage: EBITDA (earnings before interest, tax, depreciation, and amortisation) grew 12% on just 7% revenue growth, producing an Australian operating margin of 66%, up from 62% at the half-year
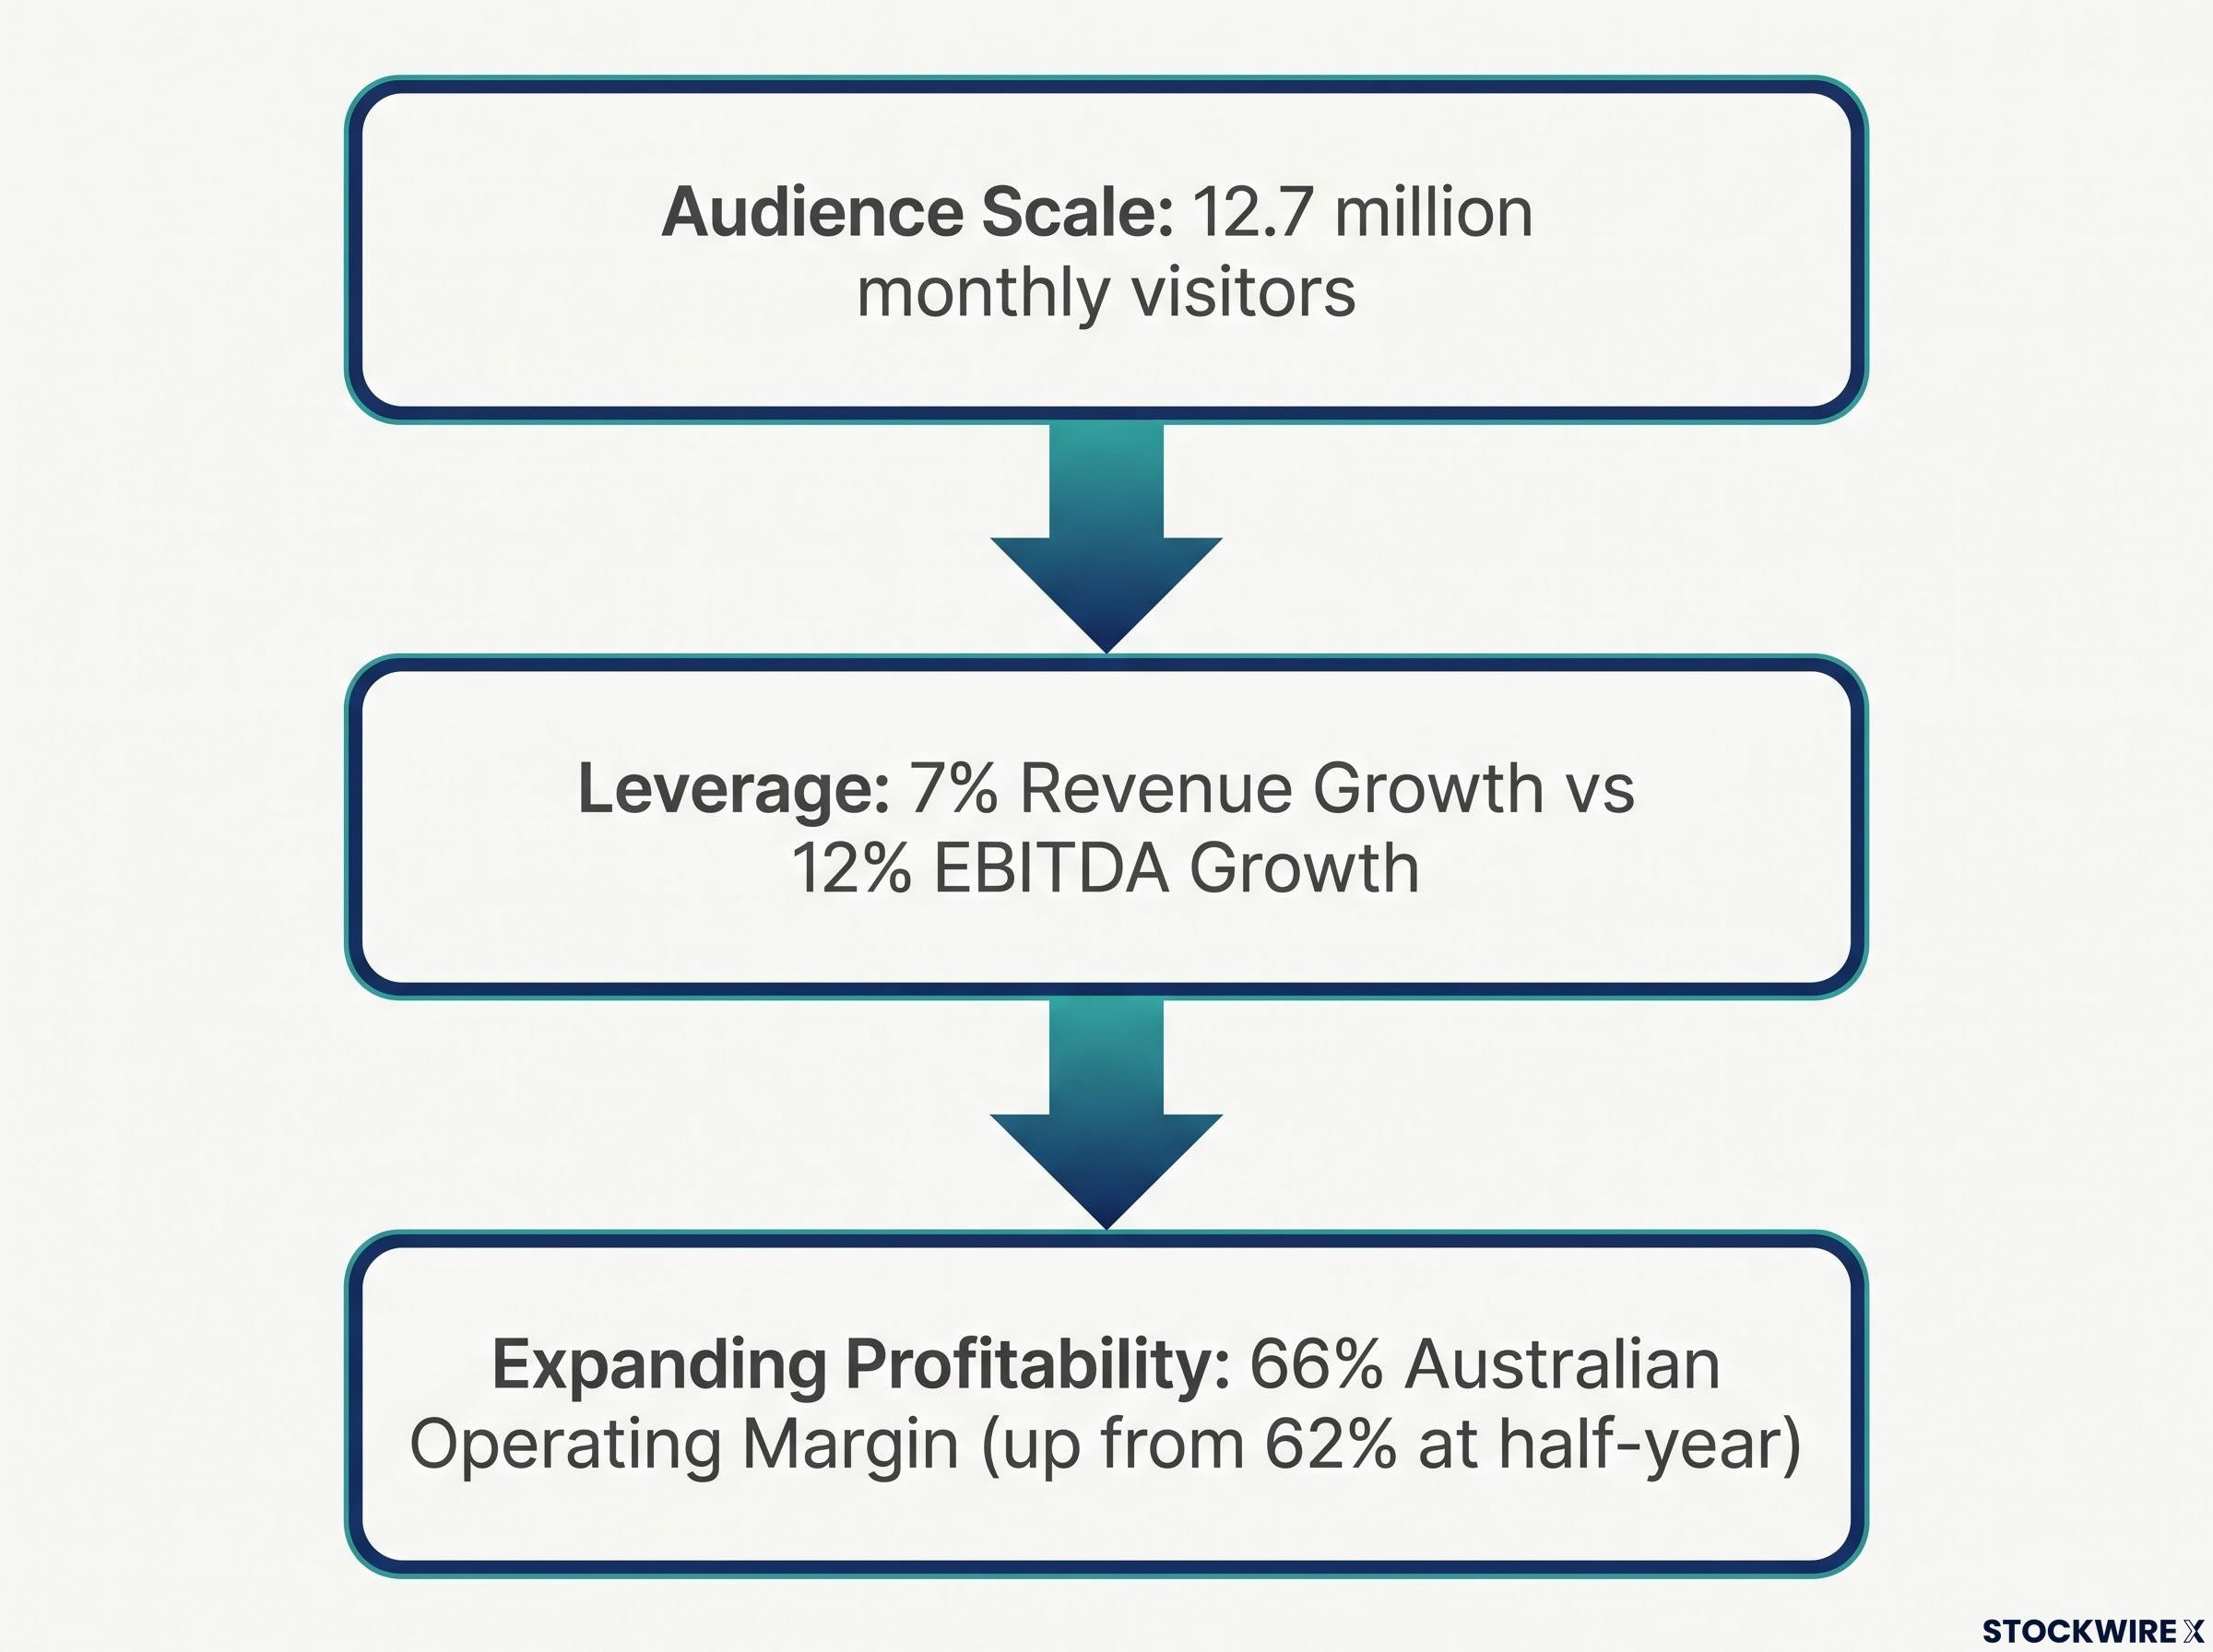
For investors unfamiliar with platform economics, the 66% margin with costs held steady is the clearest proof that REA’s cost base does not scale with revenue. Profit growth will structurally outpace revenue growth for as long as the platform retains its audience dominance. Without understanding this dynamic, the margin expansion and profit-beating-revenue pattern look like accounting noise rather than a structural signal.
Five variables that will shape FY27
Management’s cautious FY27 framing is not a red flag. It is a reset of expectations after a better-than-expected FY26. The business is not signalling deterioration; it is guiding conservatively into a year where several external variables remain genuinely uncertain.
- Listing volumes and the property cycle: FY26 volumes came in better than feared despite Q1 listings falling 8%. Whether that stabilisation repeats depends on interest rates, sentiment, and policy. If listings soften again, the question is whether yield can continue to compensate.
- Yield sustainability: At 13-14% annual yield increases in recent periods, there is a genuine question about how far pricing can be pushed before agents and vendors meaningfully resist or shift spend. This is the single most important internal variable to monitor.
- Cost discipline and margin trajectory: The 66% Australian operating margin is the FY26 baseline. Continued investment in technology, data, and adjacent businesses could temper margin growth, though it may also enhance long-term value.
- International contributions: India and other ventures were in investment or rebuild mode during FY26, with Australia carrying most of the earnings load. Whether these segments begin contributing more meaningfully to group profit is an upside lever for the medium term.
- Competitive dynamics: Domain remains the primary competitor in Australian property listings (a structural feature of the market rather than a new FY26 development). Any shifts in relative market share or pricing strategy between the two platforms would be material.
| Watchpoint | Primarily Internal or External |
|---|---|
| Listing volumes | External (property cycle, macro rates) |
| Yield sustainability | Internal (pricing strategy, product mix) |
| Margin trajectory | Internal (cost discipline, investment choices) |
| International contributions | Internal (execution, capital allocation) |
| Competitive dynamics | External (Domain strategy, market share shifts) |
Investors who understand which variables are within REA’s control versus which are macro-dependent will be better positioned to assess whether any future slowdown reflects business-specific issues or broader cycle pressure.
Prior selloffs in REA shares have been driven primarily by macro multiple compression rather than any deterioration in underlying business fundamentals, a pattern that helps distinguish between cycle-driven price weakness and genuine earnings risk when assessing the FY26 result in context.
What the FY26 result actually changes for investors
The FY26 result confirms quality. It does not reset valuation. That distinction matters depending on what kind of investor is reading.
| Investor Profile | What FY26 Confirms | Key Watchpoint |
|---|---|---|
| Quality Growth | Core EPS +15%, 66% margin, record audience: compounding capacity is intact | Can mid-teens EPS growth sustain beyond FY26? |
| Income | Growing, fully franked dividends at a sustainable ~60% payout ratio | Cash yield remains modest at ~2.0%; trajectory matters more than current level |
| Value | Premium is backed by genuine earnings quality, not speculative momentum | P/E of ~30x requires continued mid-teens EPS growth to justify |
At a trailing price-to-earnings ratio of approximately 30x core FY26 EPS (based on an indicative and unverified share price near $147-$148), REA is not cheap. If mid-teens EPS growth continues and the multiple stays broadly stable, total returns could be attractive. If growth slows to high single digits and the multiple compresses, outcomes would be more modest.
REA’s valuation framework requires cross-referencing forward PE, PEG, and DCF scenarios rather than treating any single metric as a buy signal, because the historical price-to-sales average includes COVID-era conditions that pushed multiples structurally above sustainable levels.
The FY26 beat does not make REA inexpensive. It confirms that the premium is backed by genuine earnings quality rather than speculative momentum. That is a meaningful distinction for long-term investors evaluating entry or hold decisions. The tension between an excellent business, a cautious near-term outlook, and a demanding valuation is real. The decision depends on which of those three elements you weight most.
This article is for informational purposes only and should not be considered financial advice. Investors should conduct their own research and consult with financial professionals before making investment decisions. Past performance does not guarantee future results. Financial projections are subject to market conditions and various risk factors.