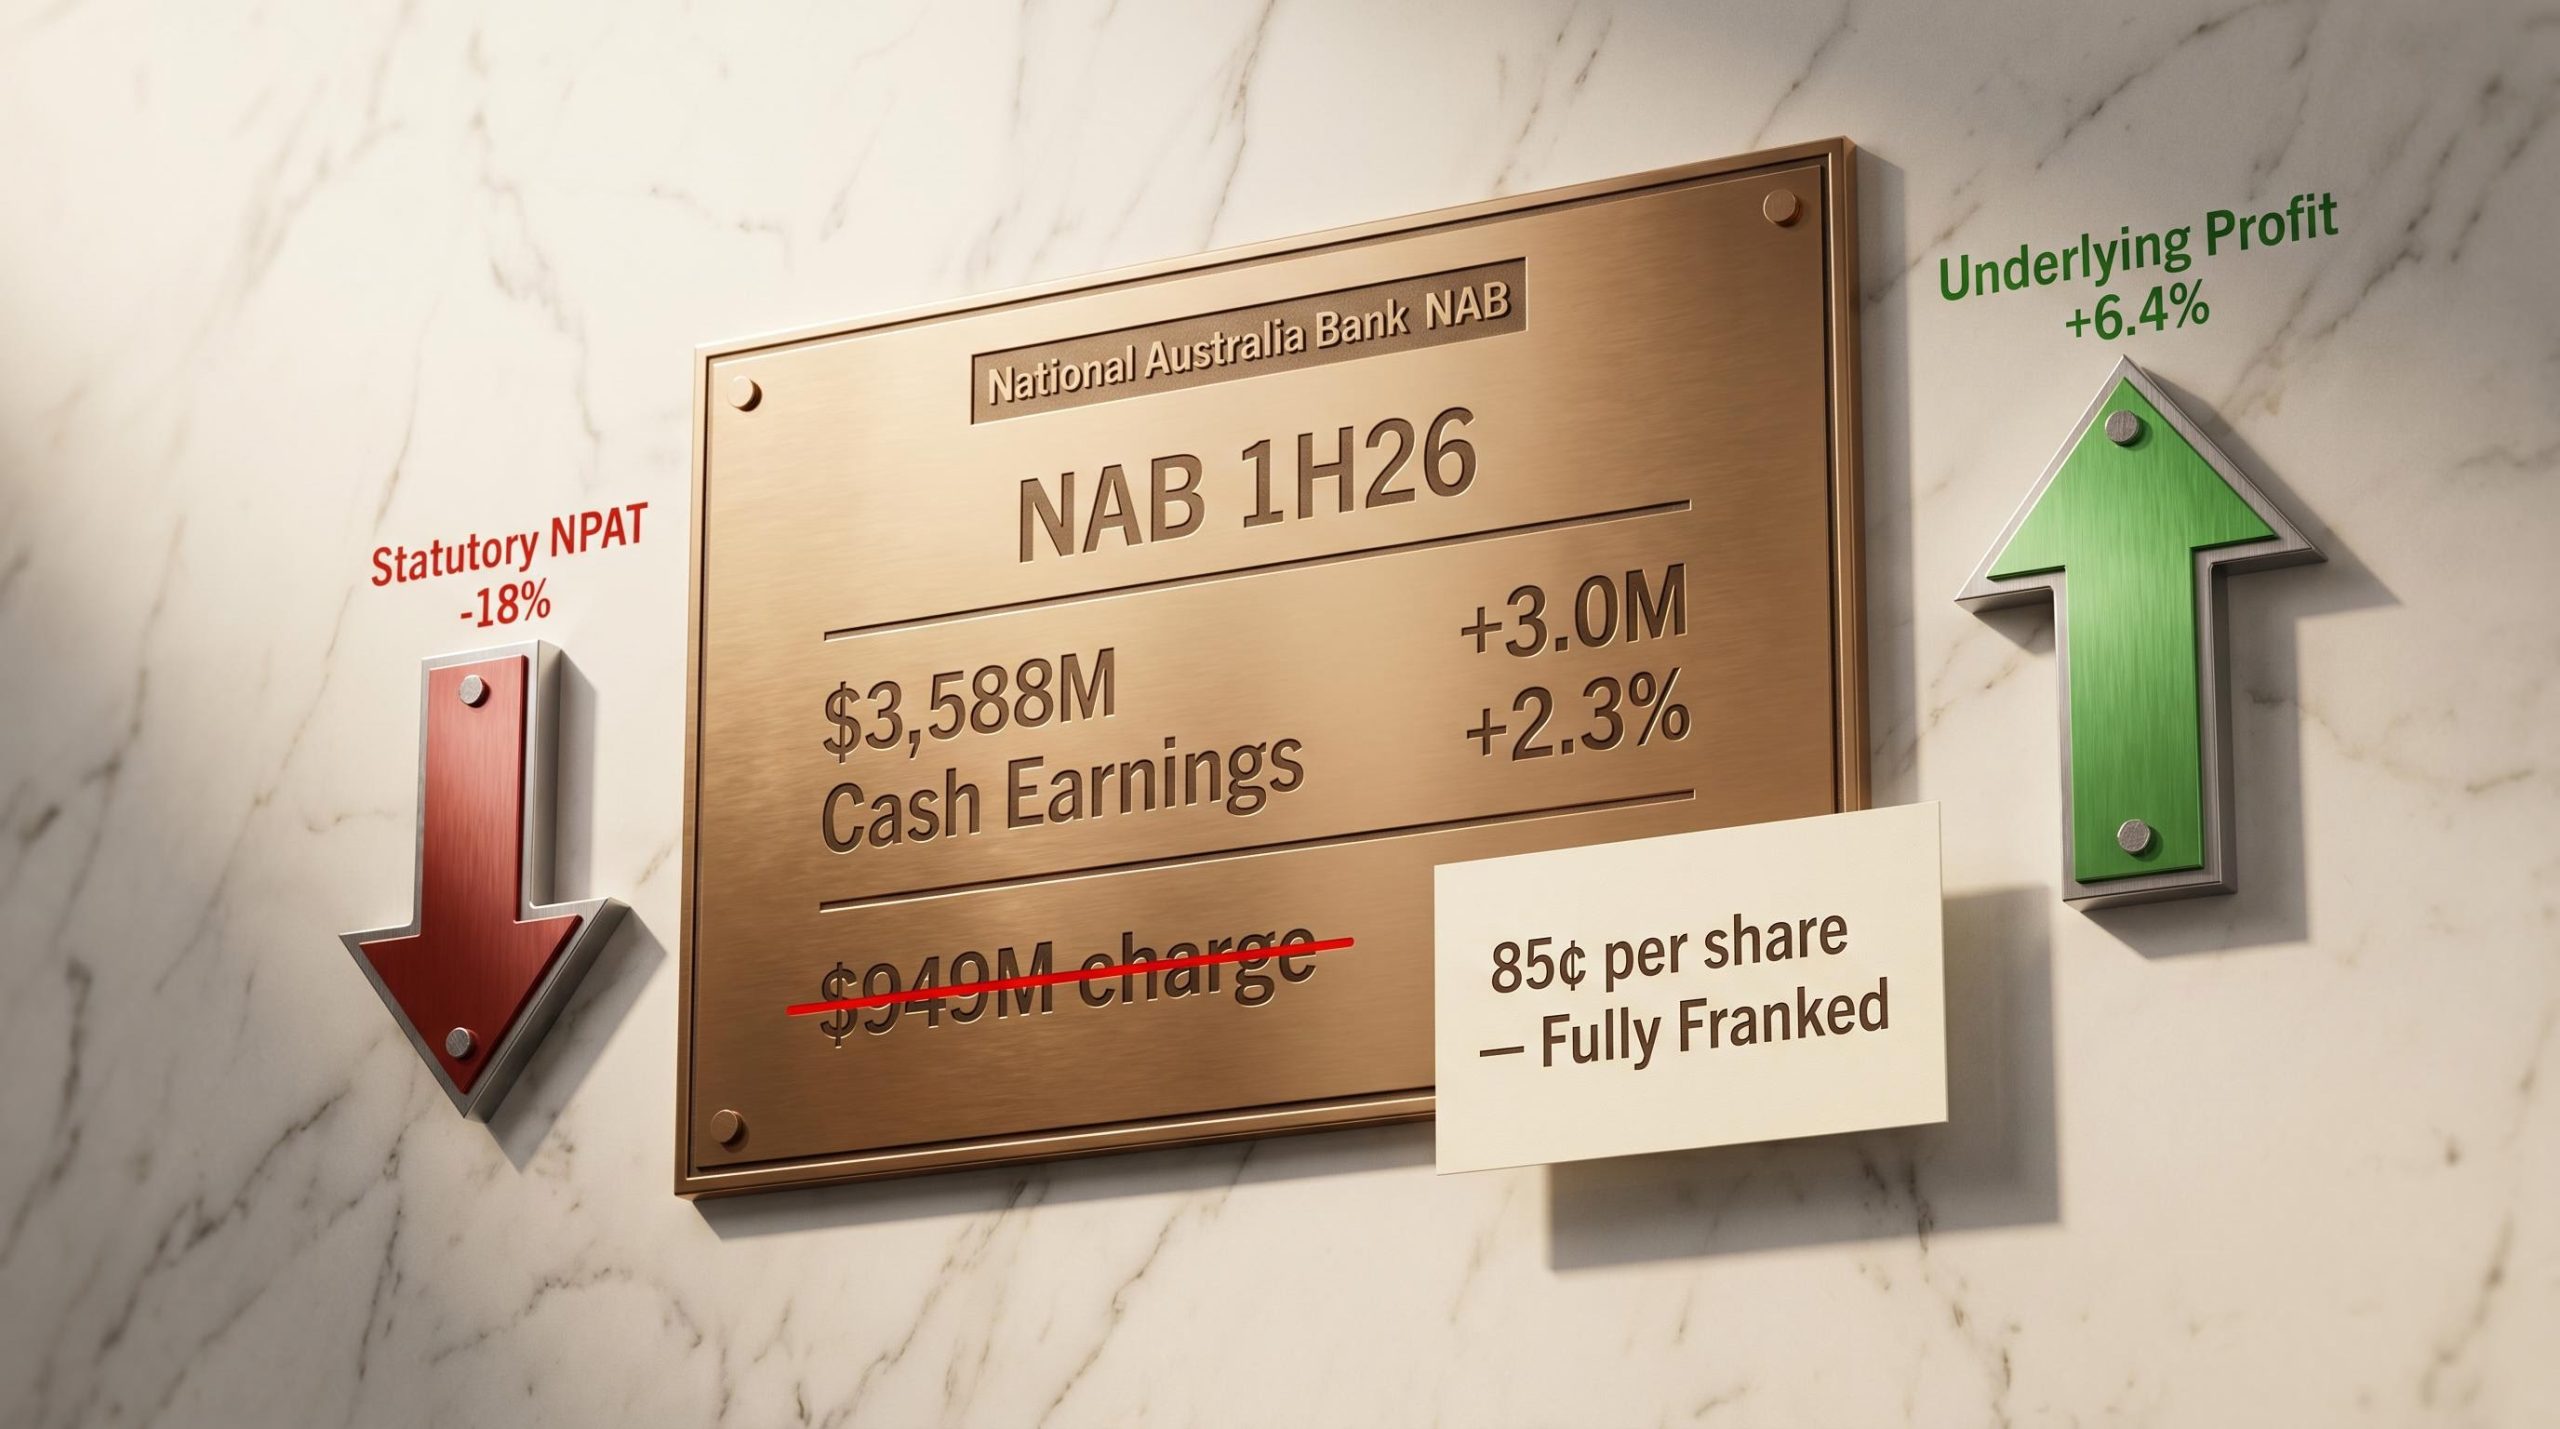
National Australia Bank reported a statutory net profit after tax of $2,750 million for the first half of FY26, a decline of 18% that will dominate headlines on Monday 4 May 2026. Beneath that figure sits a different story. Cash earnings excluding large notable items reached $3,588 million, up 2.3% on the prior half, and underlying profit grew 6.4% once a one-off software capitalisation charge is stripped out. The gap between the statutory result and the operational result is unusually wide, and it traces back to a single accounting policy decision rather than any deterioration in the bank’s lending or deposit franchise. What follows separates the noise from the signal across NAB’s first-half result, covering the software charge, divisional performance, margins, provisions, the dividend, and the outlook, so investors can assess what actually changed.
The number that looks bad and the number that matters more
The statutory figure lands first, and it stings. A $2,750 million net profit after tax, down 18%, is the kind of headline that prompts a reflexive sell.
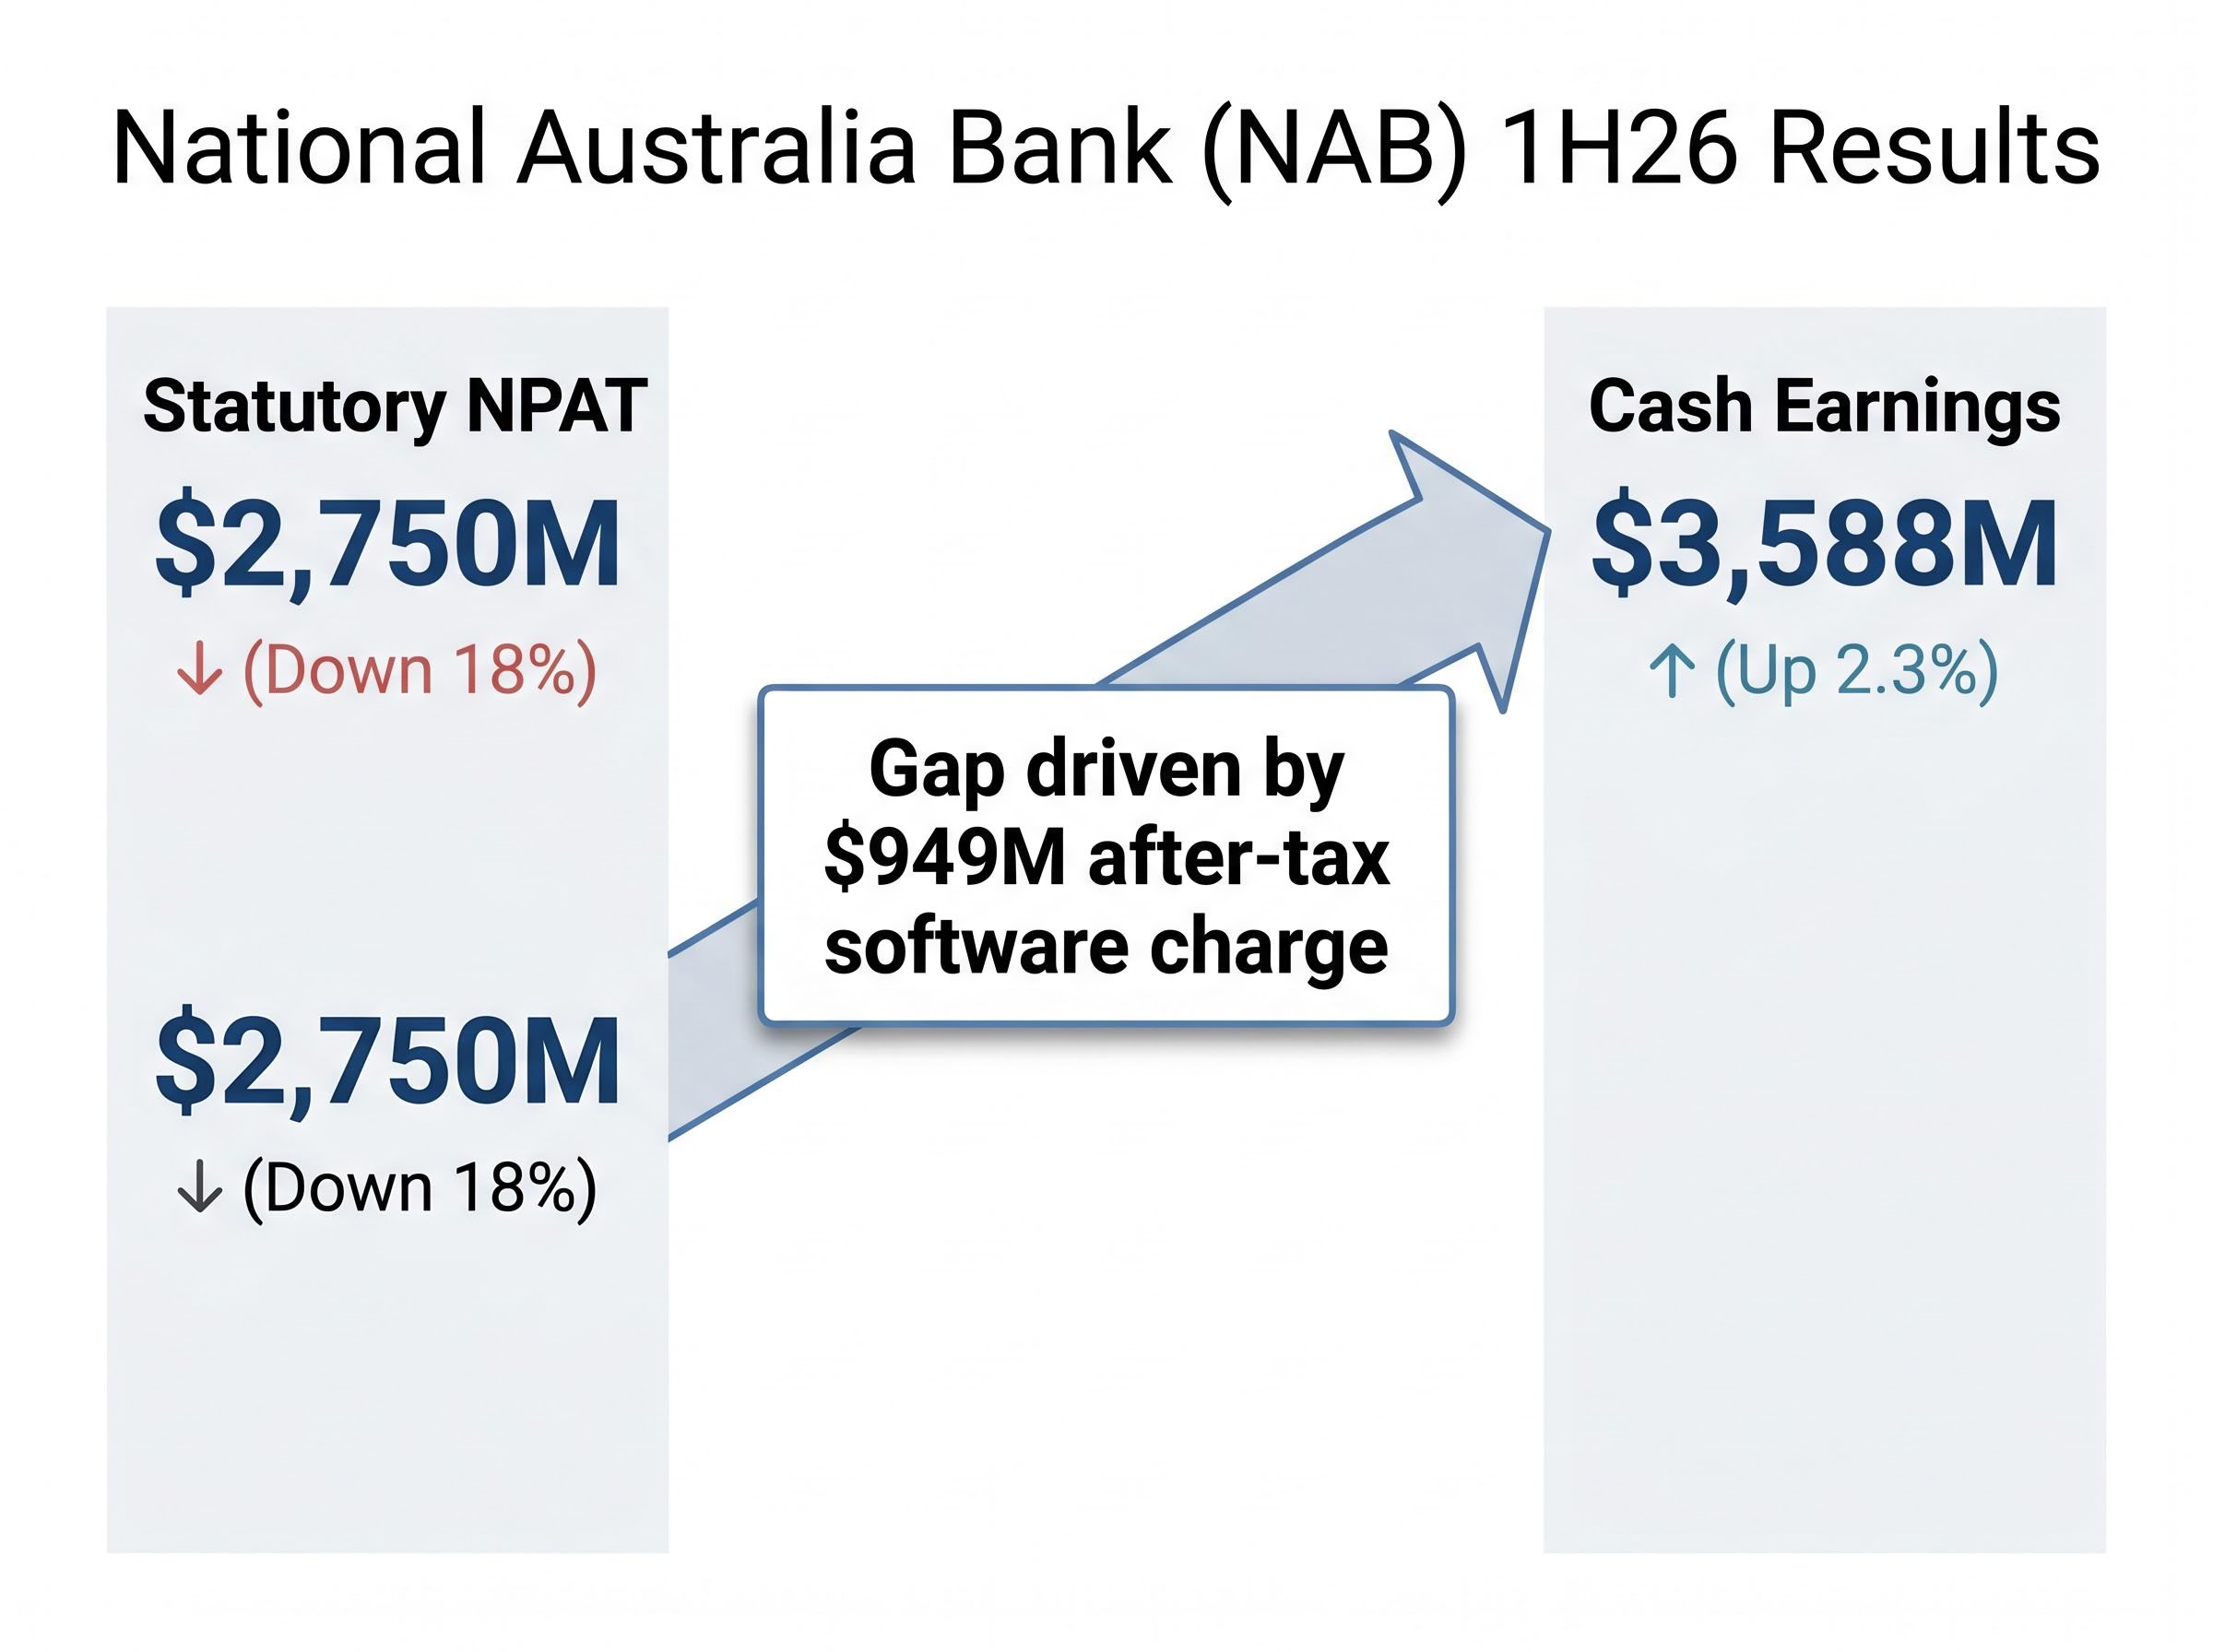
The operational picture tells a different story. Cash earnings excluding the large notable item came in at $3,588 million, representing 2.3% growth on the second half of FY25. Underlying profit, which strips out the software amortisation charge entirely, grew 6.4%. Net interest income rose to $9,163 million, also up 2.3%.
The divergence between these two numbers is not a rounding error or a collection of small adjustments. It is driven almost entirely by a single named accounting decision: a change to NAB’s software capitalisation policy that produced a $949 million after-tax charge. Understanding that charge is the prerequisite for reading the rest of this result accurately.
| Metric | 1H26 Result | Half-on-Half Change |
|---|---|---|
| Statutory NPAT | $2,750M | Down 18% |
| Cash Earnings (ex. large notable items) | $3,588M | Up 2.3% |
| Net Interest Income | $9,163M | Up 2.3% |
When big ASX news breaks, our subscribers know first
What the $949 million software charge actually is
Key figure: The software amortisation charge totalled $1,347 million before tax, translating to $949 million after tax. It was classified as a large notable item and excluded from underlying cash earnings.
NAB changed its accounting policy for software capitalisation during the half. The result was an accelerated amortisation of previously capitalised software costs, producing the charge above. In practical terms, the bank decided to write down the carrying value of internally developed software faster than its prior policy required. This is a policy reset, not an operating failure.
The AASB 138 intangible assets standard governs how Australian entities recognise, measure, and amortise internally developed software, establishing the framework within which NAB’s policy change and the resulting accelerated write-down must be evaluated.
Three distinctions matter for investors:
- What it is: A one-off accounting adjustment reflecting a change in how NAB amortises its software assets, accelerating the recognition of costs that would otherwise have been spread over future periods.
- What it is not: It is not a signal that NAB’s banking operations, revenue, or lending capacity have deteriorated. Day-to-day earnings generation was unaffected.
- What it means going forward: Future software amortisation run-rates should be lower now that the accelerated write-down has been absorbed. NAB’s pro forma CET1 ratio was expected to remain above 12% despite the charge, confirming the balance sheet absorbed the impact without capital stress.
The $300 million forward-looking provision build sits alongside a broader set of NAB capital initiatives announced before the result, including up to $1.8 billion in balance sheet strengthening measures and a discounted DRP structure designed to add approximately 40 basis points to the CET1 ratio in the second half.
Business banking drives the growth, and that is by design
NAB has staked its strategic identity on being Australia’s leading business bank, and the first-half numbers suggest that bet continued to pay off.
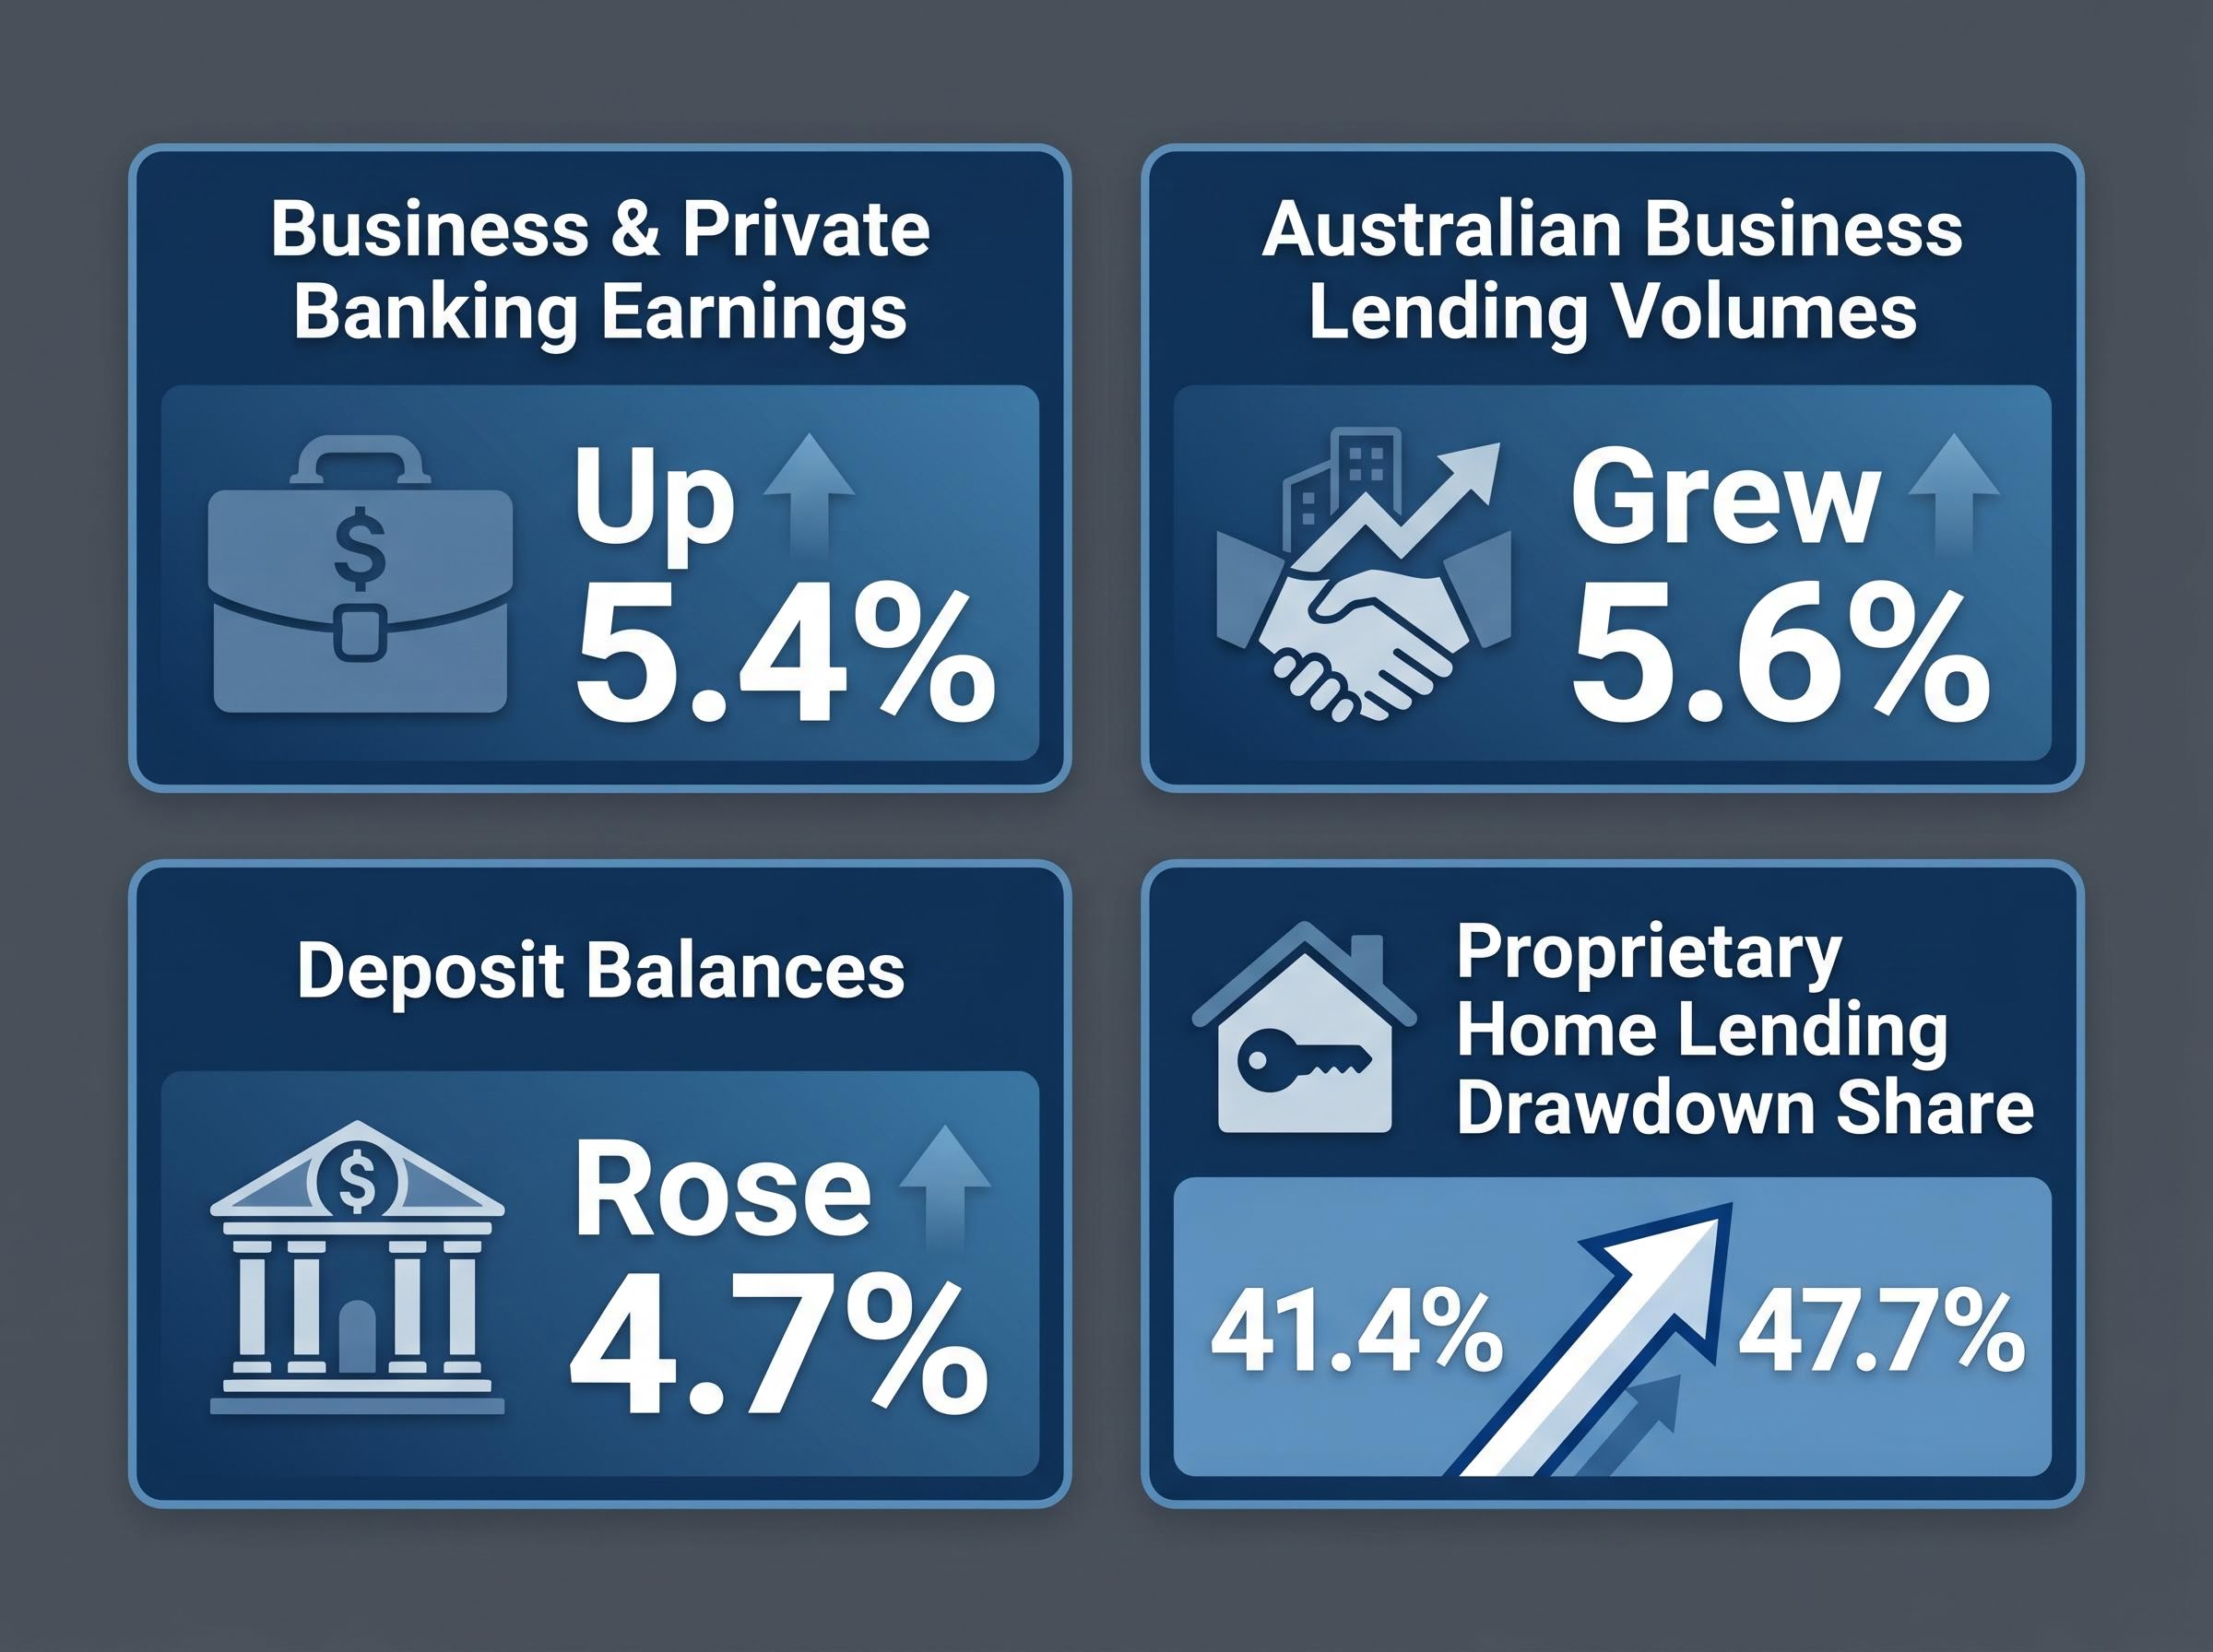
The Business and Private Banking division delivered earnings growth of 5.4% for the half, making it the primary contributor to NAB’s underlying result. This was not a one-quarter anomaly. Volume data across the division confirmed sustained momentum.
- Australian business lending volumes grew 5.6% over the half-year period.
- Deposit balances across Business and Private Banking and Personal Banking combined rose 4.7%.
- Proprietary home lending drawdown share increased from 41.4% to 47.7%, reflecting a deliberate shift toward NAB’s own distribution channels rather than third-party mortgage brokers.
The proprietary channel shift is worth watching. It signals management’s intent to reduce acquisition costs per loan while strengthening the direct customer relationship, a move that supports margin over time even if it constrains near-term volume growth relative to broker-originated lending.
What net interest margin and provisions reveal about the operating environment
NAB’s net interest margin widened by three basis points to 1.81%, a modest but directionally positive move after a period in which competitive deposit pricing compressed margins across the major banks.
Three basis points will not transform the earnings trajectory on its own. But in a half where deposit competition remained intense, any expansion signals that NAB’s pricing discipline and asset mix held up. The direction matters more than the magnitude.
The provisioning story carries a different tone.
CEO Andrew Irvine noted that the bank remains “well-positioned to manage through heightened volatility,” citing the proactive steps taken to strengthen the provision buffer.
NAB increased forward-looking collective provisions by $300 million during the half, a deliberate management decision aimed at building buffers against geopolitical and economic risks rather than responding to deteriorating credit quality in the existing loan book.
The two charges serve different analytical purposes:
- Credit impairment charge of $706 million: Reflects actual and expected losses within the current lending portfolio for the half.
- $300 million forward-looking provision build: A precautionary overlay, management’s insurance policy against risks that have not yet materialised in the loan book.
Taken together, the message is one of caution without alarm. Management is building buffers while the balance sheet is strong enough to absorb them.
The sector-wide provisioning outlook adds weight to NAB’s cautious internal messaging: Morgans forecasts total Big Four provisions rising from approximately $2.4 billion in FY25 to approximately $5.5 billion by FY27, a trajectory that frames NAB’s $300 million forward-looking build as an early move in what may be a multi-year provisioning cycle.
The 85-cent dividend and what the capital ratio says about its sustainability
The income investor’s headline: NAB declared an interim dividend of 85 cents per share, fully franked.
For Australian retail investors eligible for franking credit offsets, the fully franked status carries material after-tax value. The dividend itself was consistent with prior guidance.
For Australian retail shareholders eligible for franking offsets, the grossed-up yield on NAB’s dividend lifts the effective income return meaningfully above the headline 85-cent figure, with the after-tax outcome varying across personal income, superannuation accumulation, and SMSF pension-phase accounts.
- Interim dividend: 85 cents per share
- Franking: Fully franked at the 30% corporate tax rate
- Dividend reinvestment plan (DRP): Structured with a discount and partial underwriting, allowing NAB to return cash to shareholders while simultaneously preserving capital through share issuance to DRP participants
The capital position behind the payout warrants attention. NAB’s pro forma CET1 ratio was expected to remain above 12% at 31 March 2026, with the pre-announced guidance confirming the balance sheet was expected to absorb the software amortisation charge without falling below that threshold.
An expectation of above 12% CET1 remains comfortably above APRA’s minimum requirements, and the DRP structure provides a partial capital offset mechanism. However, investors focused on dividend durability should monitor whether the ratio rebuilds toward 12% or above during the second half, particularly if credit growth slows and provisioning demands persist.
This article is for informational purposes only and should not be considered financial advice. Investors should conduct their own research and consult with financial professionals before making investment decisions.
NAB’s forward settings in a cautious environment
Management’s guidance for the remainder of FY26 was measured rather than expansive, reflecting the same caution visible in the provisioning decisions.
NAB outlined three priorities heading into the second half:
- Broadening the deposit base to reduce funding cost volatility and support margin stability.
- Expanding proprietary home lending distribution to grow the direct channel share beyond the 47.7% reached in 1H26.
- Maintaining cost discipline, with productivity savings targeted at more than $450 million for full FY26 and cost growth projected to remain under 4.6%.
Geopolitical risks and lingering inflationary pressures were cited as headwinds, though management’s language was cautionary rather than alarming. The focus on cost discipline over volume ambition suggests NAB is prioritising operating leverage in an environment where credit growth may moderate.
For context, NAB shares have risen approximately 11% over the trailing 12 months, compared with approximately 7% for the S&P/ASX 200 (XJO) over the same period. That outperformance reflects the market’s prior confidence in NAB’s business banking positioning, a thesis this result broadly supports without dramatically extending it.
Reading NAB’s 1H26 as an investor: signal versus noise
The signals to carry forward from this result:
- Underlying cash earnings grew 2.3%, with underlying profit up 6.4% once the software charge is excluded.
- Business and Private Banking delivered 5.4% earnings growth, confirming the core franchise is expanding.
- Net interest margin widened modestly to 1.81%, a positive directional signal.
- The 85-cent fully franked interim dividend was maintained.
The noise to set aside:
- The $949 million after-tax software charge is a one-off accounting policy reset. It reduced statutory profit but does not impair NAB’s capacity to generate earnings in future periods.
- The statutory 18% profit decline is a function of that charge, not a reflection of deteriorating business performance.
The open question is whether NAB’s cautious capital management, its deliberate provisioning build, and its subdued credit growth outlook represent prudent positioning for an uncertain second half, or an early signal that the operating environment is tightening faster than the headline numbers suggest. That distinction will become clearer as the remaining Big Four banks report and as the macroeconomic picture develops through the second half of calendar 2026.
For investors weighing whether to act on NAB’s result as part of a broader Australian equity allocation, our full explainer on ASX bank valuations and index concentration examines how the S&P/ASX 200’s 2026 gains are almost entirely dependent on Big Four performance, and why Morningstar has flagged all four major banks as overvalued at current multiples.
Past performance does not guarantee future results. Financial projections are subject to market conditions and various risk factors.
—