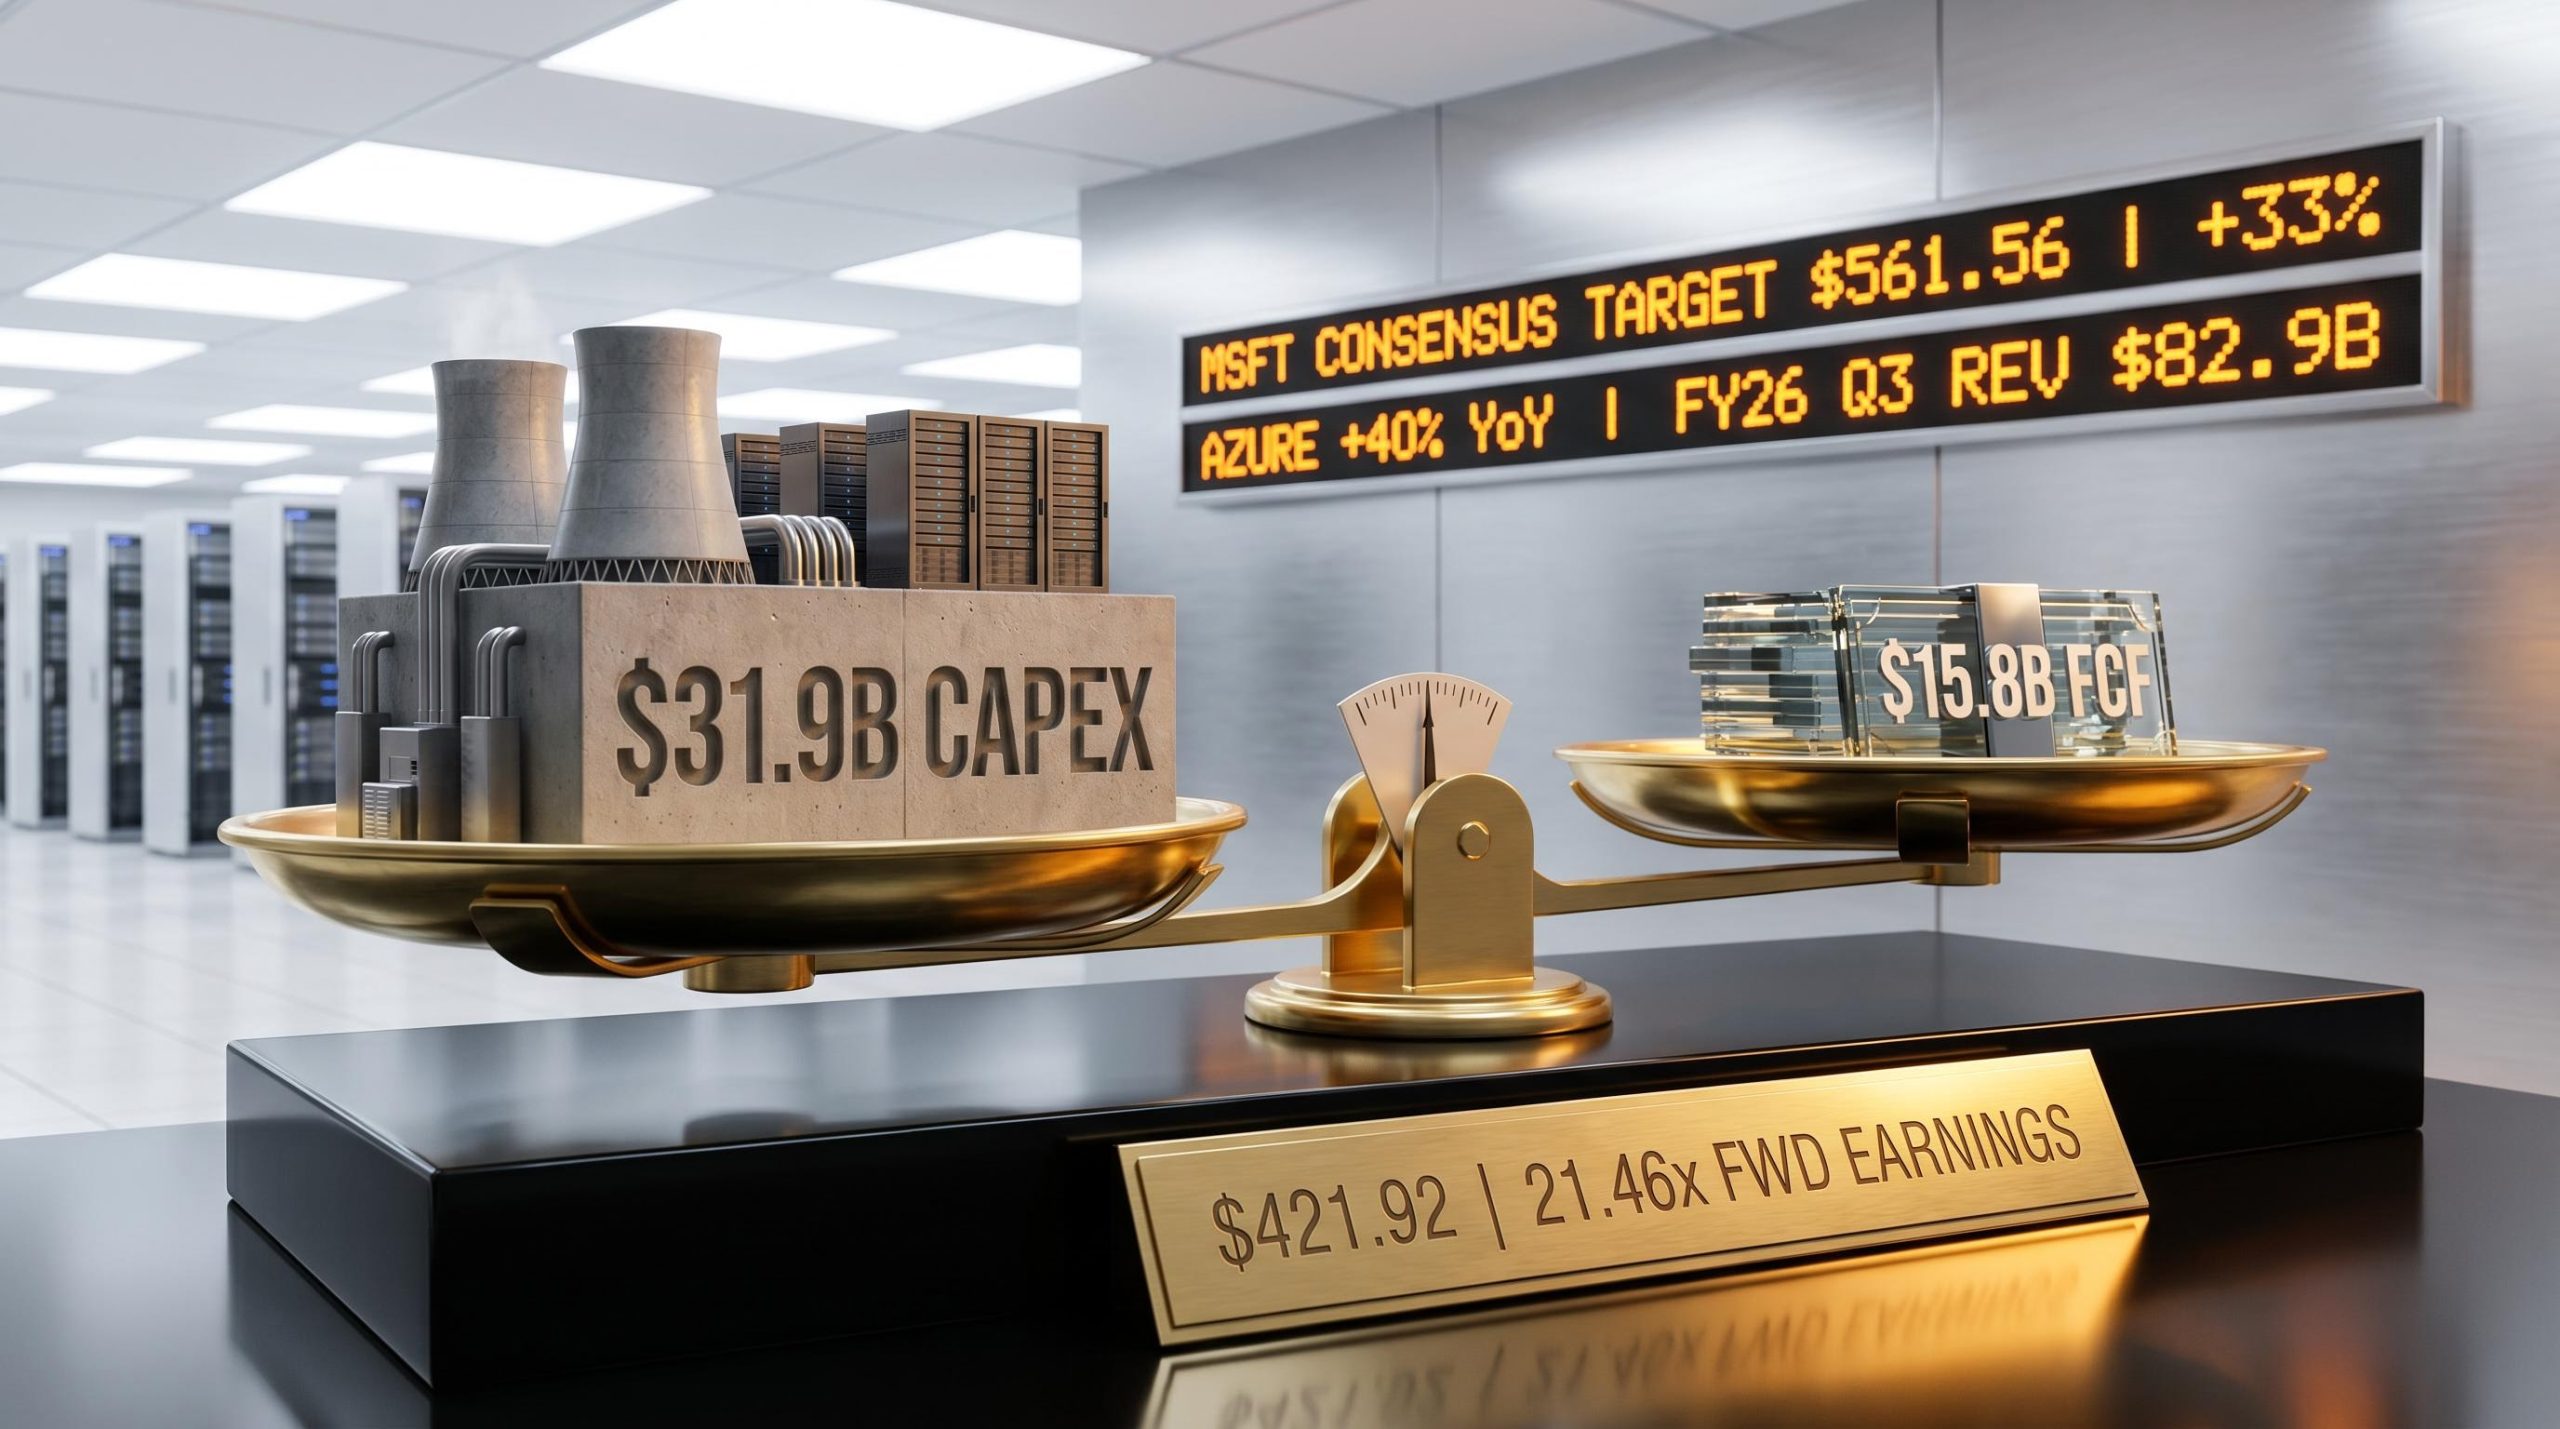
At $421.92 per share, Microsoft trades at 21.46x forward earnings, near its lowest valuation multiple in a decade, while a consensus of analysts targets $561.56, implying roughly 33% upside. That gap between price and target is either an opportunity or a trap, and the answer turns on what an investor makes of $31.9 billion in capital expenditure in a single quarter.
Bill Ackman’s decision in Q1 2026 to exit Alphabet and build a comparably sized Microsoft stake at current prices has re-opened the debate about whether MSFT at approximately $3 trillion in market capitalisation still offers genuine long-term compounding or whether it is a well-understood blue chip priced for mediocrity. The most recent quarter (FY26 Q3, ended 31 March 2026) provides the clearest picture yet of both the opportunity and the tension at the heart of this investment case.
What follows works through Microsoft’s business pillars, its most recent financial results including the numbers that do not make the headlines, the structural risks that could impair the thesis, and a grounded return framework so a reader can form an independent view on whether MSFT belongs in a long-term portfolio at this price.
The business underneath the brand: what actually generates Microsoft’s value
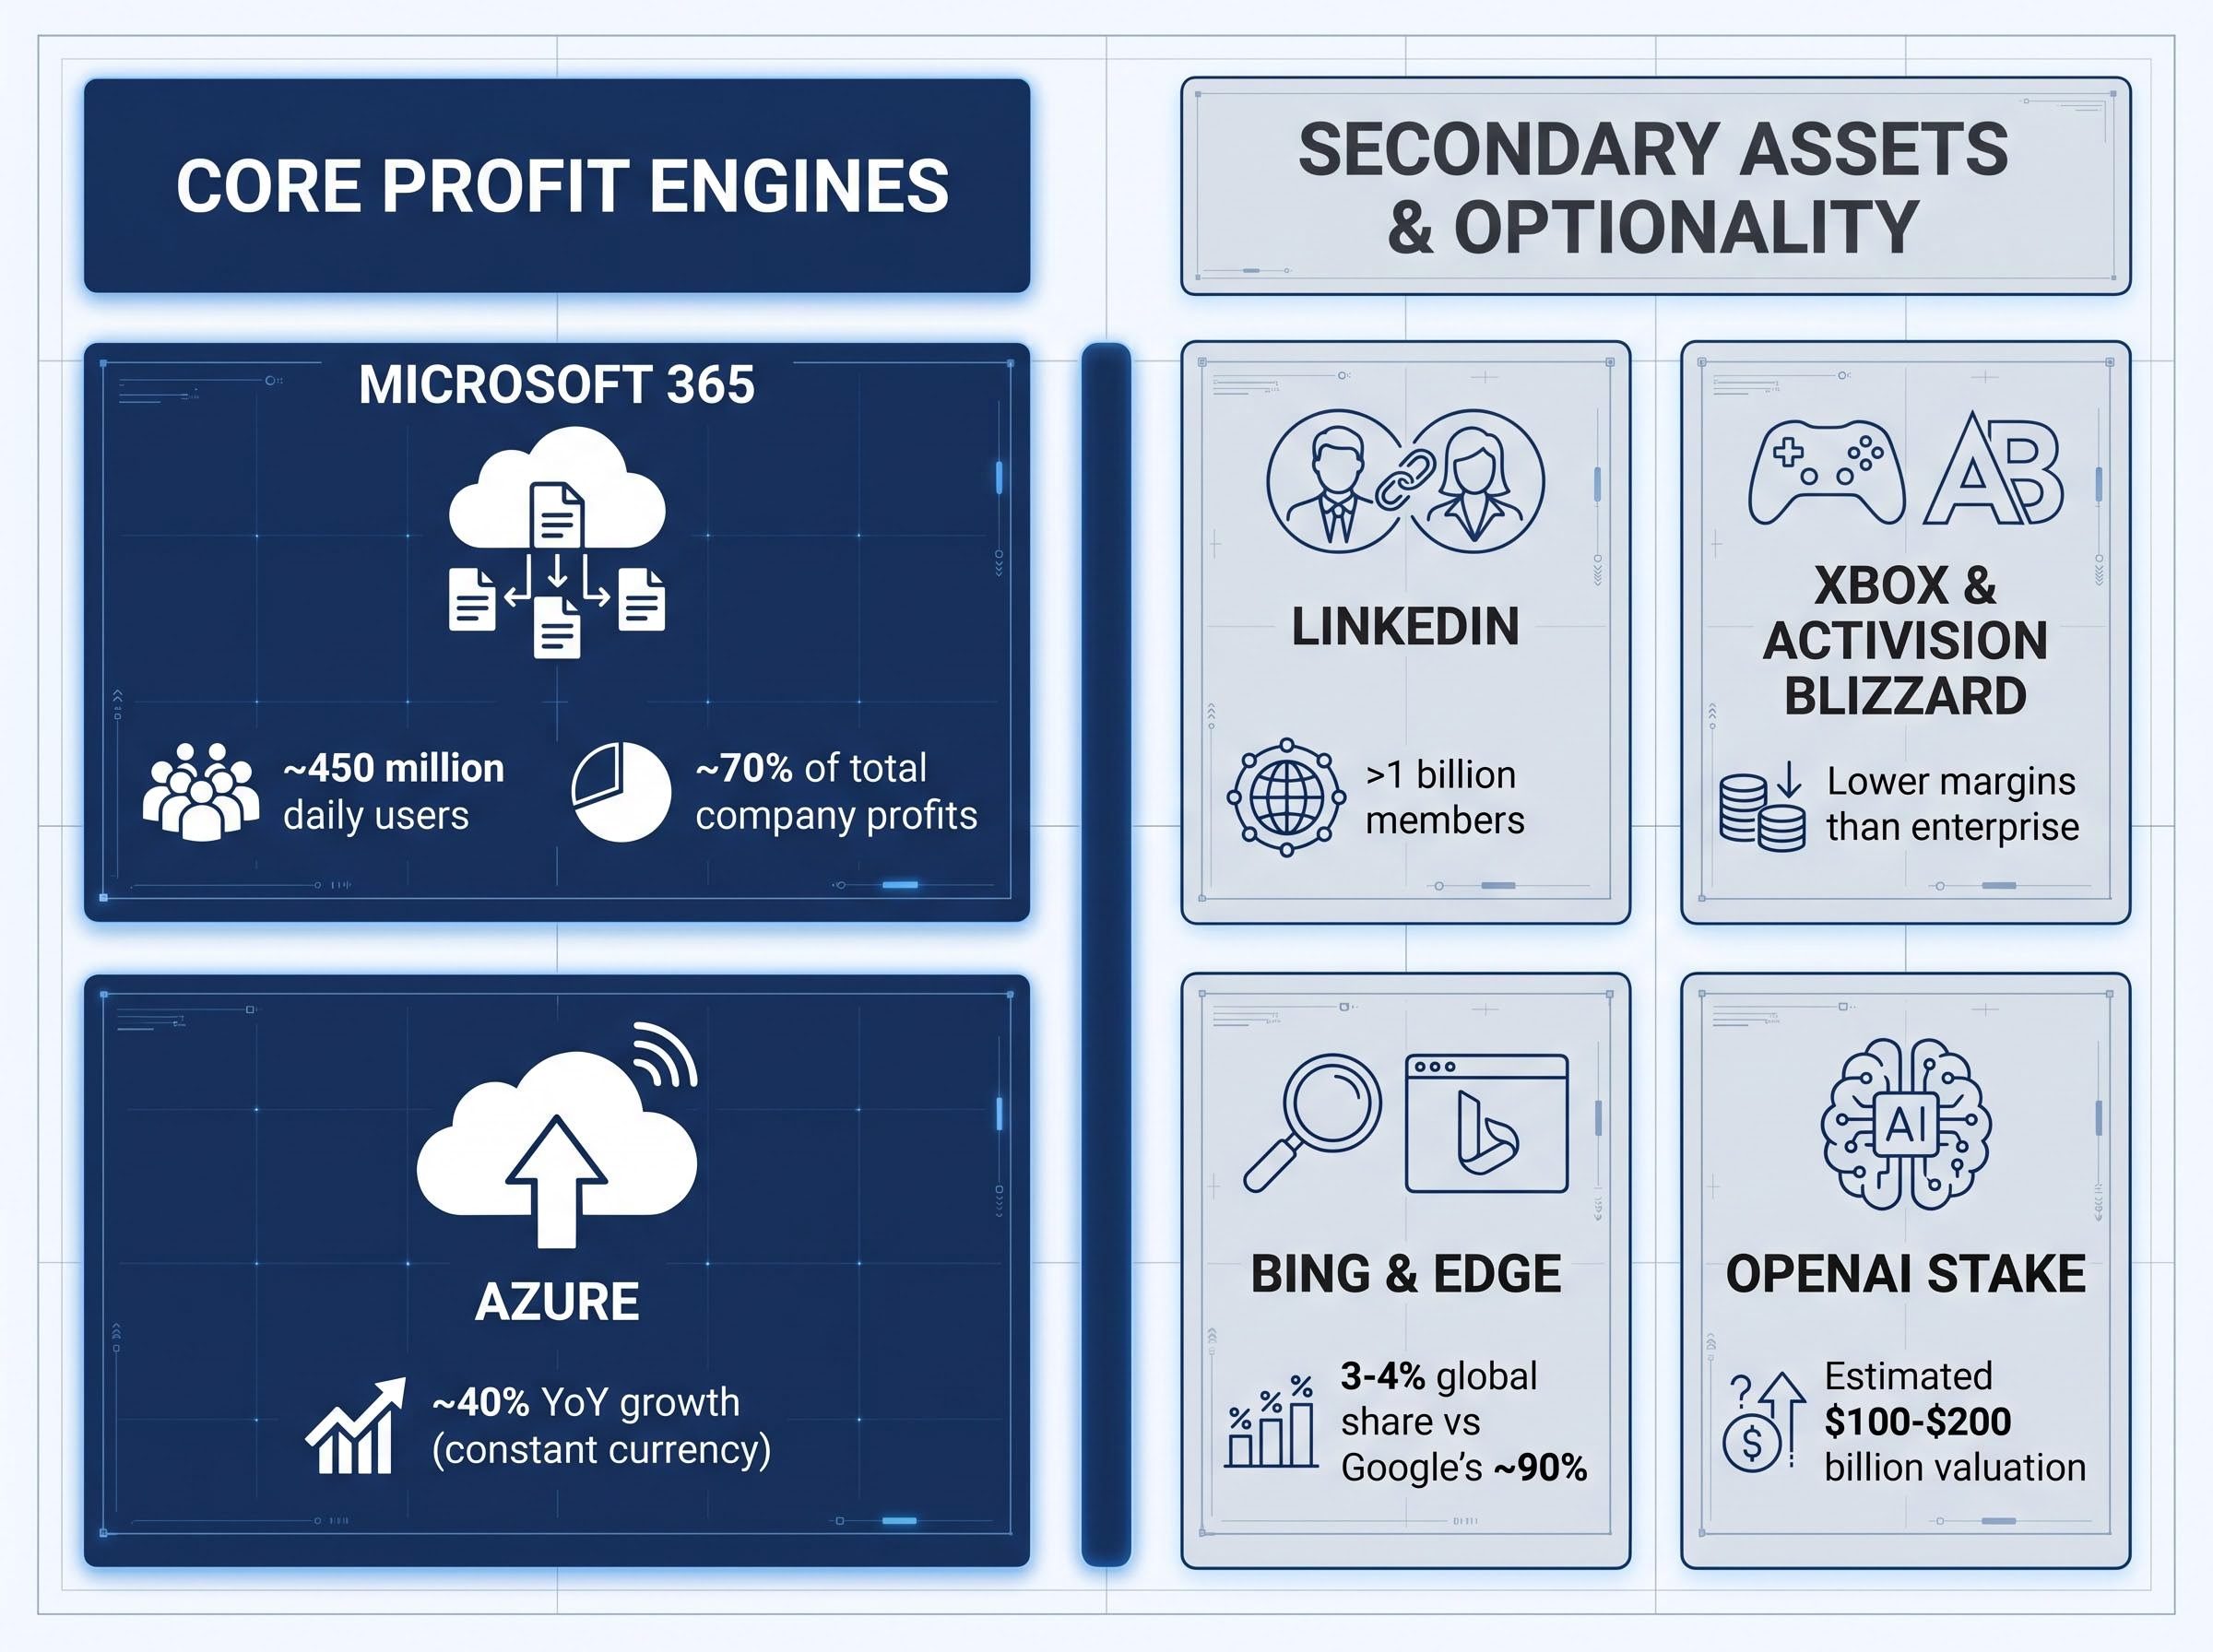
Strip away the brand familiarity and two profit engines explain nearly everything about Microsoft’s investment case. The first is Microsoft 365, the productivity and cloud suite serving approximately 450 million daily users and contributing roughly 70% of total company profits. This is not a software subscription in the traditional sense; it is an enterprise operating platform embedded in compliance workflows, security protocols, and daily business operations across virtually every major corporation. Switching costs are structurally high.
The second is Azure, the world’s second-largest hyperscale cloud platform, growing at approximately 40% year-over-year in constant currency. Analysts at Jefferies project re-acceleration into the low-40s through FY26, driven by AI workload demand. Together, these two segments define the stock’s earnings trajectory.
Everything else is secondary:
- LinkedIn: Surpassed one billion members, a valuable data and recruitment asset, but not a primary profit driver at the group level.
- Xbox and Activision Blizzard: A content-rich gaming division generating meaningful revenue but operating at lower margins than the enterprise businesses.
- Bing and Edge: Approximately 3-4% global search share versus Google’s approximately 90%, with search advertising revenue growth well behind the industry leader.
- OpenAI stake: Estimated at $100-$200 billion depending on future public market pricing, entirely contingent on a future IPO and not reflected in operating earnings.
Secondary assets and optionality
The LinkedIn, Xbox, and Bing businesses are best understood as optionality rather than core thesis drivers. LinkedIn’s scale provides a data moat in professional services, but its contribution to group operating income remains modest relative to the cloud and productivity segments. The Activision Blizzard acquisition expanded gaming content, though integration benefits are still maturing.
The OpenAI stake is the wildcard. Its estimated $100-$200 billion valuation would be material if realised through a public listing, but that outcome remains speculative and timing-dependent. None of these secondary assets need to work for the base investment case to hold; if they do, they represent upside.
When big ASX news breaks, our subscribers know first
What FY26 Q3 actually revealed: strength, and the number that complicates it
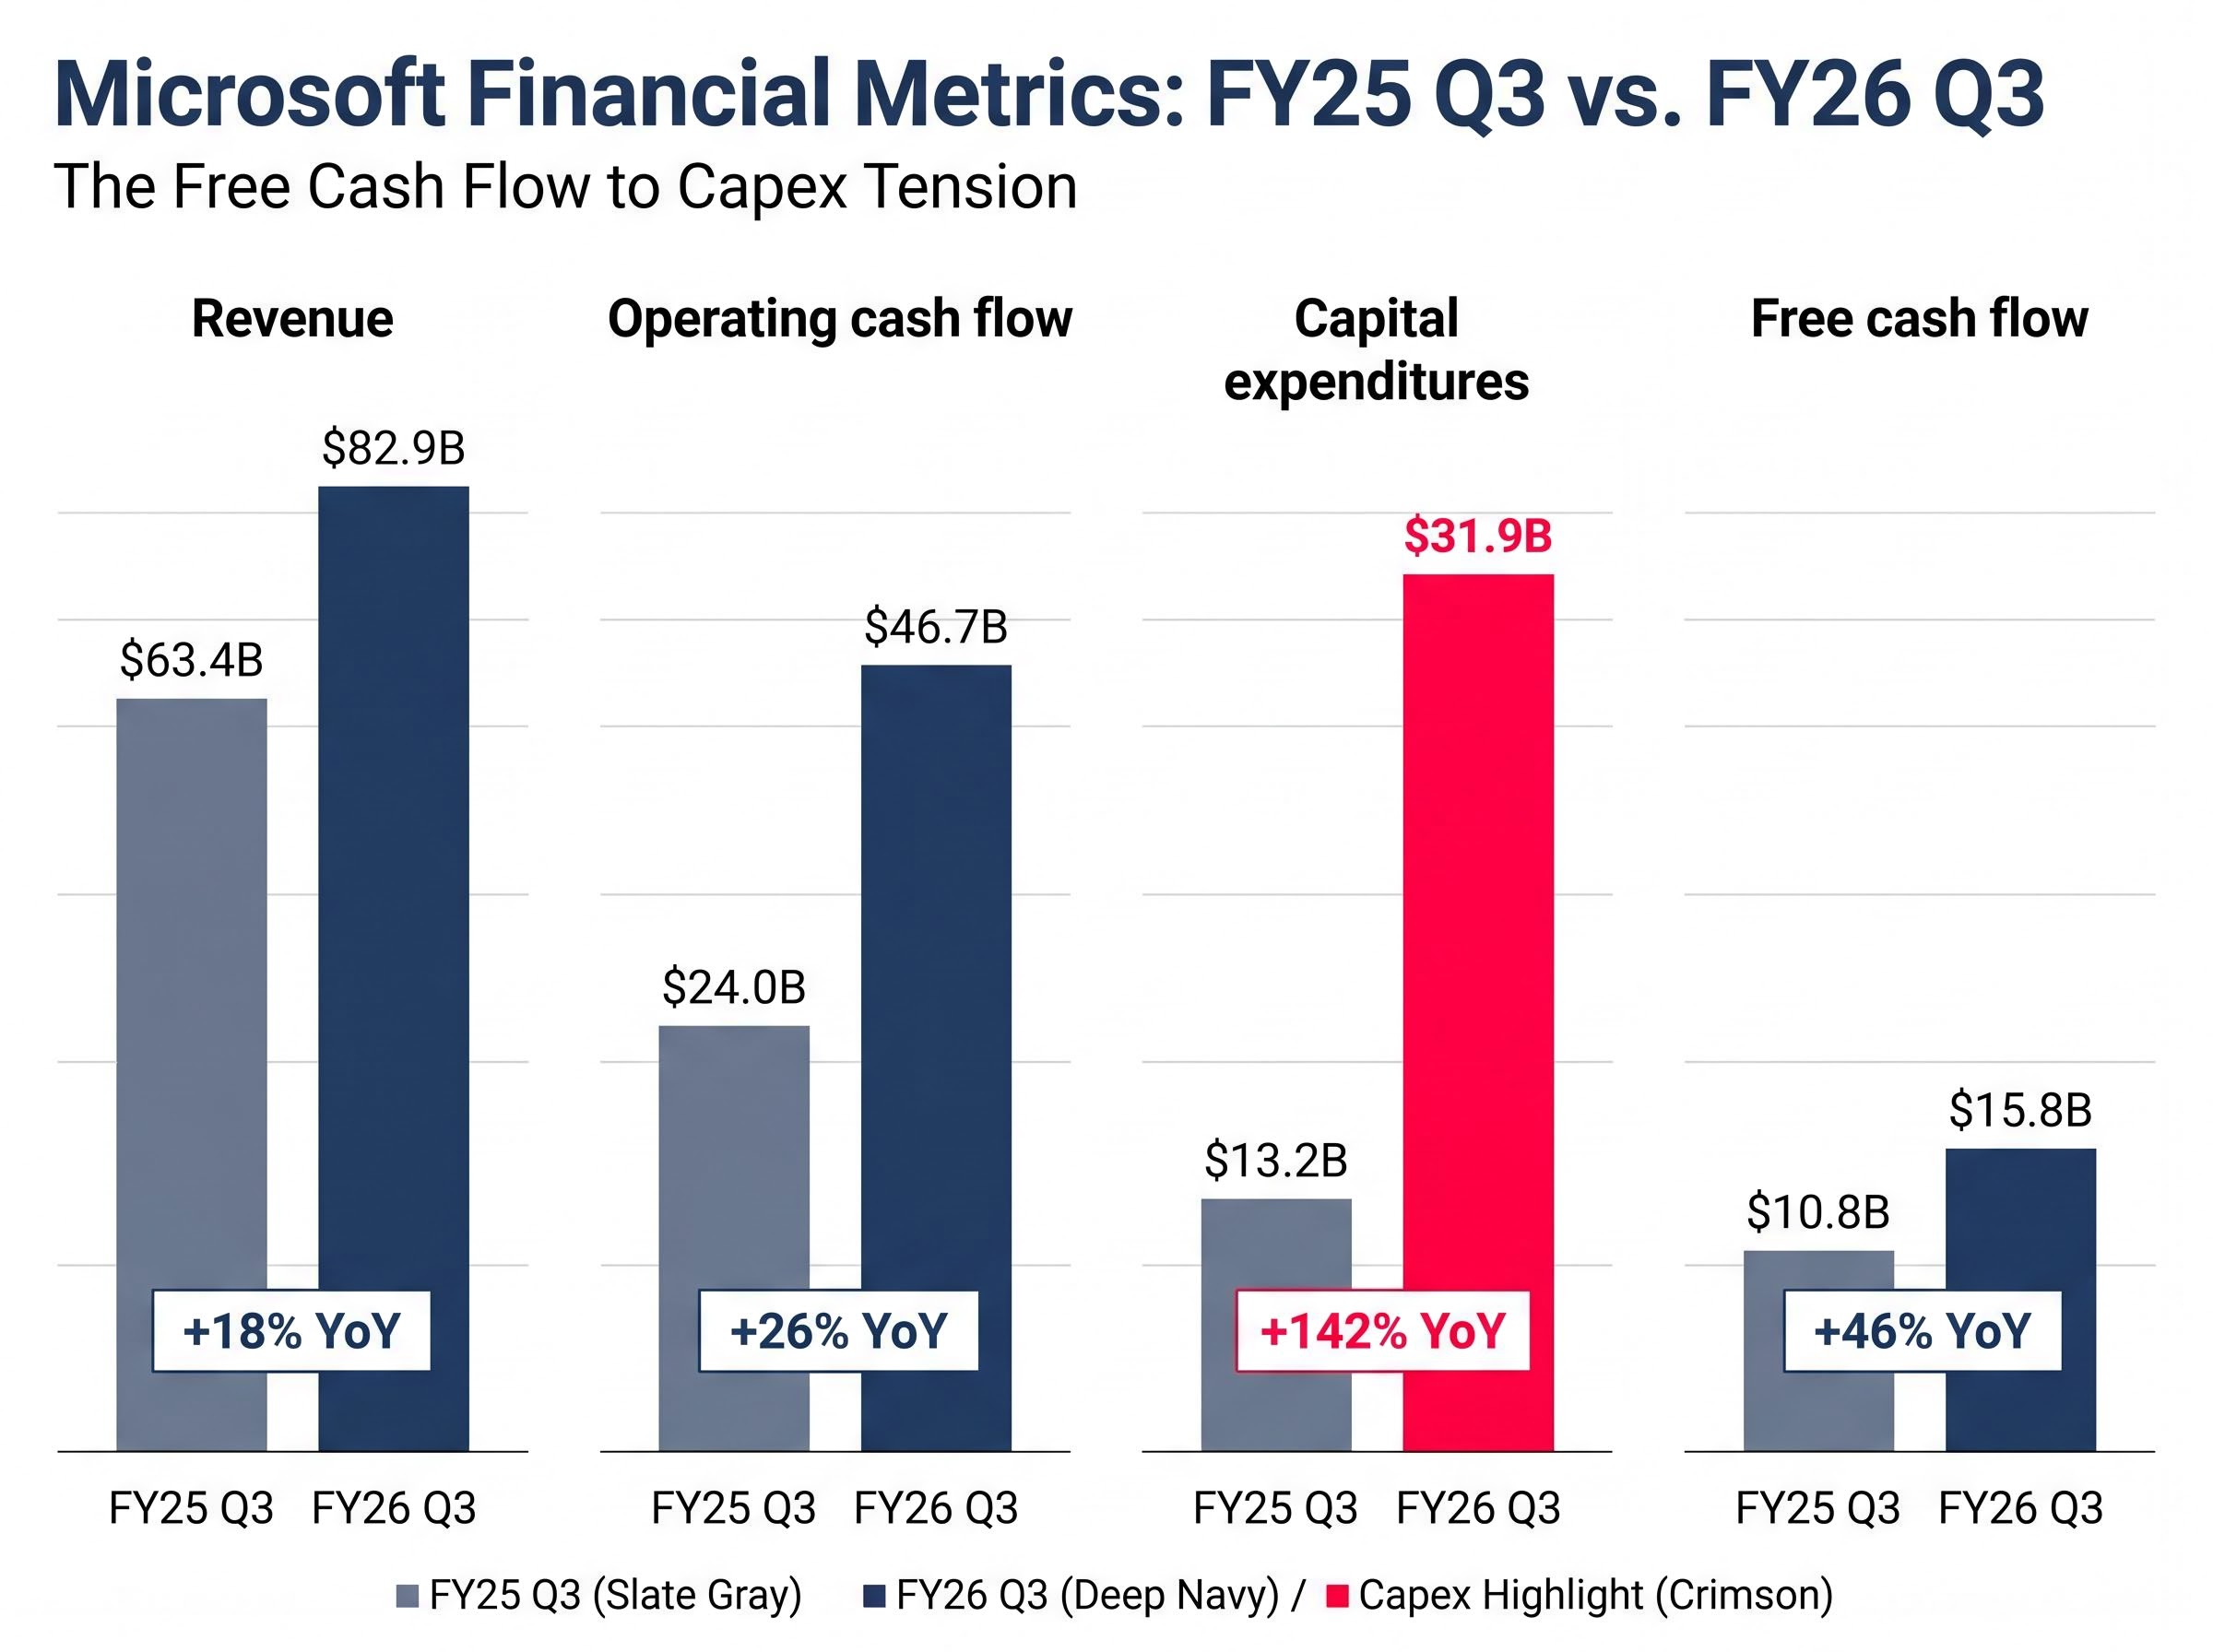
The headline numbers from FY26 Q3 justify Microsoft’s premium relative to most large-cap equities. Revenue reached $82.9 billion, up 18% year-over-year (15% in constant currency). Operating income grew 20% year-over-year, with operating margins sitting at approximately 46%. Earnings per share growth exceeded 20% year-over-year. Operating cash flow hit $46.7 billion, up 26% year-over-year.
Then there is the number that complicates the narrative.
Capital expenditures reached $31.9 billion in the quarter, compared to $13.2 billion in FY25 Q3, a near-doubling. Free cash flow came in at $15.8 billion, up from $10.8 billion a year earlier in absolute terms, but representing a dramatically compressed FCF margin on a much larger revenue base.
| Metric | FY26 Q3 | FY25 Q3 | Change |
|---|---|---|---|
| Revenue | $82.9B | $63.4B | +18% YoY |
| Operating cash flow | $46.7B | $24.0B | +26% YoY |
| Capital expenditures | $31.9B | $13.2B | +142% YoY |
| Free cash flow | $15.8B | $10.8B | +46% YoY |
The free cash flow to capex tension: In FY26 Q3, Microsoft spent $31.9 billion building infrastructure to generate $15.8 billion in free cash flow. For a company long celebrated as one of the most capital-efficient businesses on the planet, this represents a meaningful, if potentially temporary, reversal of the cash-generative narrative investors have relied on.
Two other signals inside the quarter deserve attention. Commercial bookings declined approximately 4% year-over-year, a softness that bears monitoring even if one quarter does not constitute a trend. Windows OEM and devices revenue also declined year-over-year. Search advertising revenue rose approximately 12% reported (approximately 9% constant currency), well below Google’s comparable approximately 20% growth.
The quarter does not tell a clean story in either direction.
Azure’s 40% growth against Google Cloud’s 63% in Q1 2026 places Microsoft second in the current AI infrastructure race, a gap that matters for competitive positioning even as both companies draw from the same enterprise demand pool and management attributes the difference partly to supply constraints rather than demand weakness.
Understanding the AI capital expenditure cycle (and why it is not automatically a problem)
The $31.9 billion capex figure is the number most likely to determine whether Microsoft delivers mid-teens or single-digit returns from here. Understanding why requires distinguishing between two types of capital spending.
Maintenance capex keeps existing operations running. Growth capex builds capacity that did not previously exist, targeting revenue streams that are not yet fully materialised. Microsoft’s current spending falls overwhelmingly into the latter category: data centres, networking infrastructure, and specialised hardware designed to serve AI and cloud workloads that are growing at 40% annually.
The AI capex cycle converts to shareholder value if three conditions hold:
- Azure AI demand continues to broaden beyond a small number of large customers, with enterprise adoption driving consumption across industries.
- Revenue per dollar of capex improves as utilisation rates increase on newly built infrastructure, converting fixed costs into margin expansion.
- Capex intensity peaks and moderates within a defined timeframe, allowing free cash flow margins to recover.
According to Bank of America, Microsoft has entered a “capex super-cycle” with AI-related spending likely to double versus FY24 levels, peaking in FY26. J.P. Morgan projects capex will remain elevated through at least FY27 but characterises it as “revenue-accretive” given AI cloud services demand. Management has indicated capex intensity is expected to normalise beyond FY26 as the AI build-out matures, though no precise FY27 numerical guidance was provided.
GPU utilisation thresholds above 80% by end of deployment year are the single credibility test Wall Street applies when distinguishing revenue-accretive AI infrastructure spend from speculative overbuilding, and Azure’s reported utilisation trajectory has been the primary reason Goldman Sachs maintained its Buy rating through the capex surge.
Morgan Stanley adds that Azure AI consumption is “increasingly diversified” across enterprises building their own models, not solely dependent on OpenAI.
The case for scepticism
The counterargument is straightforward. Capex commitments are largely fixed once data centres are built, while AI revenue demand remains subject to enterprise adoption timing that could lag projections. If utilisation rates disappoint, Microsoft will be carrying billions in depreciating infrastructure with insufficient revenue to justify the spend.
In the near term, the free cash flow pressure limits buybacks and dividend growth, which matters for total return calculations. A company spending two dollars on infrastructure for every dollar of free cash flow is making a bet, not generating the reliable cash returns that underpinned the stock’s historical valuation premium.
Hyperscaler debt issuance reached $121 billion in 2025, approximately four times the five-year average, adding a financing risk layer to the capex cycle that rarely appears in earnings-focused analysis but carries implications for free cash flow if rates remain elevated through the build-out period.
The risks that could break the thesis
Four distinct risk vectors warrant attention, ordered by near-term materiality.
- OpenAI dependency risk (moderate, monitorable): A prior earnings call disclosure indicated approximately 45% of Azure’s backlog was attributable to OpenAI. Reports from Reuters (January 2025) and the Financial Times (February 2025) noted OpenAI discussing multi-cloud possibilities with AWS and Google, though analysts characterise this as an incremental risk rather than a base-case near-term threat.
- Interest rate sensitivity (near-term, market-wide): The 10-year Treasury yield sits at 4.60%. Bank of America outlines a stress scenario in which a move to 5.5% could produce 10-20% valuation downside for mega-cap tech even with strong earnings, via higher discount rates compressing justified P/E multiples.
- Agentic AI disruption to Microsoft 365 (theoretical, not yet observable): If autonomous AI agents replace bundled productivity workflows, the 70% profit contribution from Microsoft 365 faces structural risk. This is not yet visible in reported metrics but warrants monitoring over a multi-year horizon.
- Bing search stagnation (secondary): At approximately 3-4% global share versus Google’s approximately 90%, and with search advertising revenue growth at approximately 9% constant currency versus Google’s approximately 20%, the search business remains a marginal contributor unlikely to move the investment needle.
The OpenAI multi-cloud expansion reports, citing both Reuters and the Financial Times, confirmed that Microsoft lost exclusive access to OpenAI’s technology and that OpenAI moved to offer its products through Amazon and Google Cloud, giving the dependency risk described by analysts a concrete and documented basis.
Rate stress scenario: According to Bank of America, if the 10-year Treasury yield rises to 5.5%, “AI leaders like Microsoft, Nvidia, and Alphabet could see 10-20% valuation downside” even if earnings estimates hold, driven by multiple compression on higher discount rates.
None of these risks are reasons to automatically avoid the stock. They are the variables that could push a base-case 10% annual compounder toward a materially lower outcome.
What the numbers actually say about returns from here
At $421.92, Microsoft trades at 21.46x forward earnings with a consensus 12-month target of $561.56. The implied 33% upside to consensus is notable, but consensus targets are projections, not guarantees. A more grounded framework works through three scenarios.
| Scenario | Key assumption | Implied annual return |
|---|---|---|
| Base case | Azure growth sustains mid-30s; FCF margins recover as capex peaks; multiple stable | ~10% compounding |
| Bull case | AI monetisation exceeds estimates; Azure re-accelerates; multiple expands modestly | Low-to-mid teens |
| Bear case | Capex fails to convert; rates move to 5%+; multiple compresses to 18-19x | Low single digits or flat |
For historical calibration, prior analysis at $340 in mid-2023 projected approximately 10% annual compounding; shares subsequently rose approximately 20-30%, broadly validating the framework at that entry point.
Ackman’s Q1 2026 entry at approximately 21-22x forward earnings, near a decade-low multiple, reflects a structural argument: at approximately $3 trillion in market capitalisation, there are very few businesses on the planet capable of compounding at mid-teens rates with this degree of competitive insulation. Jim Cramer has publicly expressed concern about the position’s size, though the disagreement is more about portfolio concentration than the underlying thesis.
Ackman’s consumption-pricing thesis centres on the shift from per-seat Microsoft 365 licensing toward usage-based Azure and Copilot billing, a structural change that ties the $190 billion infrastructure commitment directly to revenue scaling with AI adoption rather than headcount growth.
The $100-$200 billion OpenAI stake, if realised through an eventual IPO, would represent additional upside not captured in the operating earnings framework.
A blue chip at fair value, or a compounder worth owning for the decade
Microsoft at $421.92 is not a deep-value opportunity. It is a reasonably valued position in one of the highest-quality businesses in the world, priced for approximately 10% annual compounding in a base case with meaningful upside if AI monetisation outperforms.
The investment decision hinges on two variables this analysis has laid out in detail. First, whether the AI capex cycle converts to durable, margin-accretive revenue or becomes a drag on free cash flow. Second, whether the Microsoft 365 bundle maintains its structural integrity against emerging agentic AI disruption over a multi-year horizon.
The monitoring variables going forward are specific: Azure growth trajectory (acceleration or deceleration from the approximately 40% constant currency run rate), free cash flow margin recovery as capex intensity is expected to moderate beyond FY26, and the commercial bookings trend as a lead indicator of enterprise demand.
Investors evaluating a position may find it useful to revisit Microsoft’s quarterly earnings with this framework, treating the FCF margin recovery and Azure growth as the two signals that most directly confirm or challenge the base case.
This article is for informational purposes only and should not be considered financial advice. Investors should conduct their own research and consult with financial professionals before making investment decisions. Past performance does not guarantee future results. Financial projections are subject to market conditions and various risk factors.