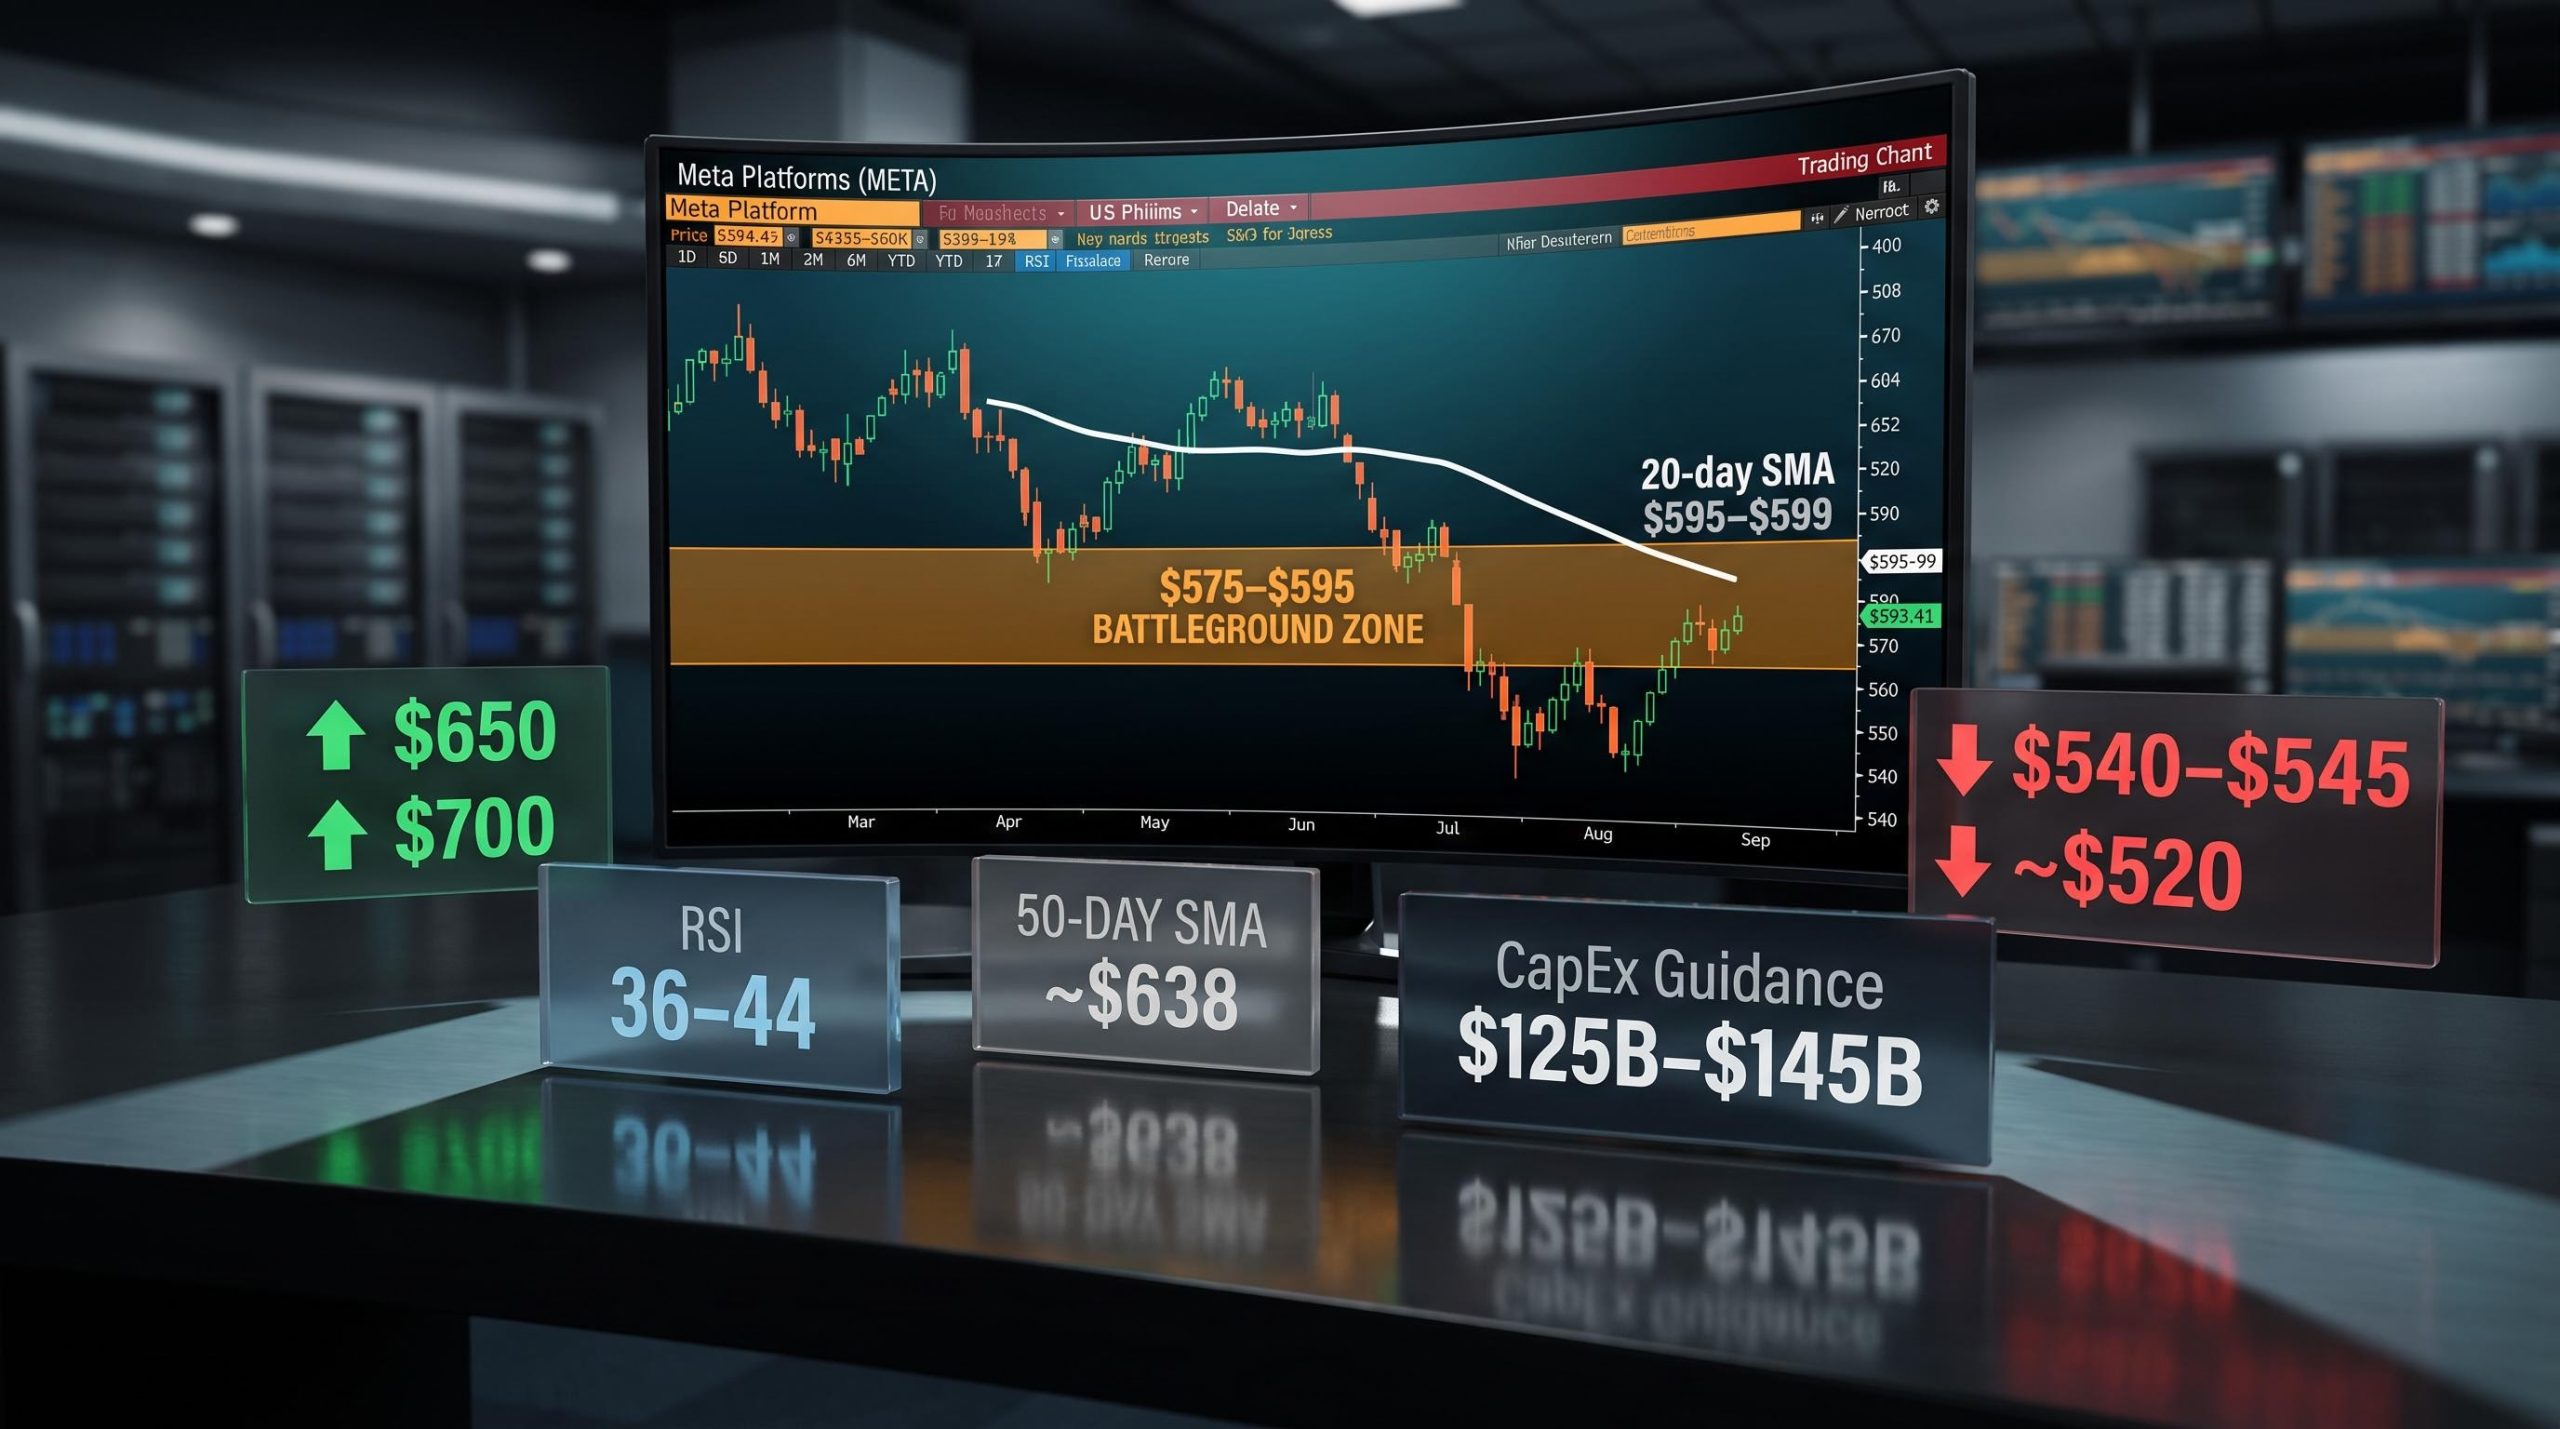
Meta Platforms is trading at $593.41 as of the July 28 close, sitting fractionally below a cluster of technical reference points that have been converging for weeks. Every indicator in the framework, moving averages, Bollinger Bands, RSI, points to the same narrow zone as the fulcrum. And the catalyst that will break the stalemate arrives after the close today.
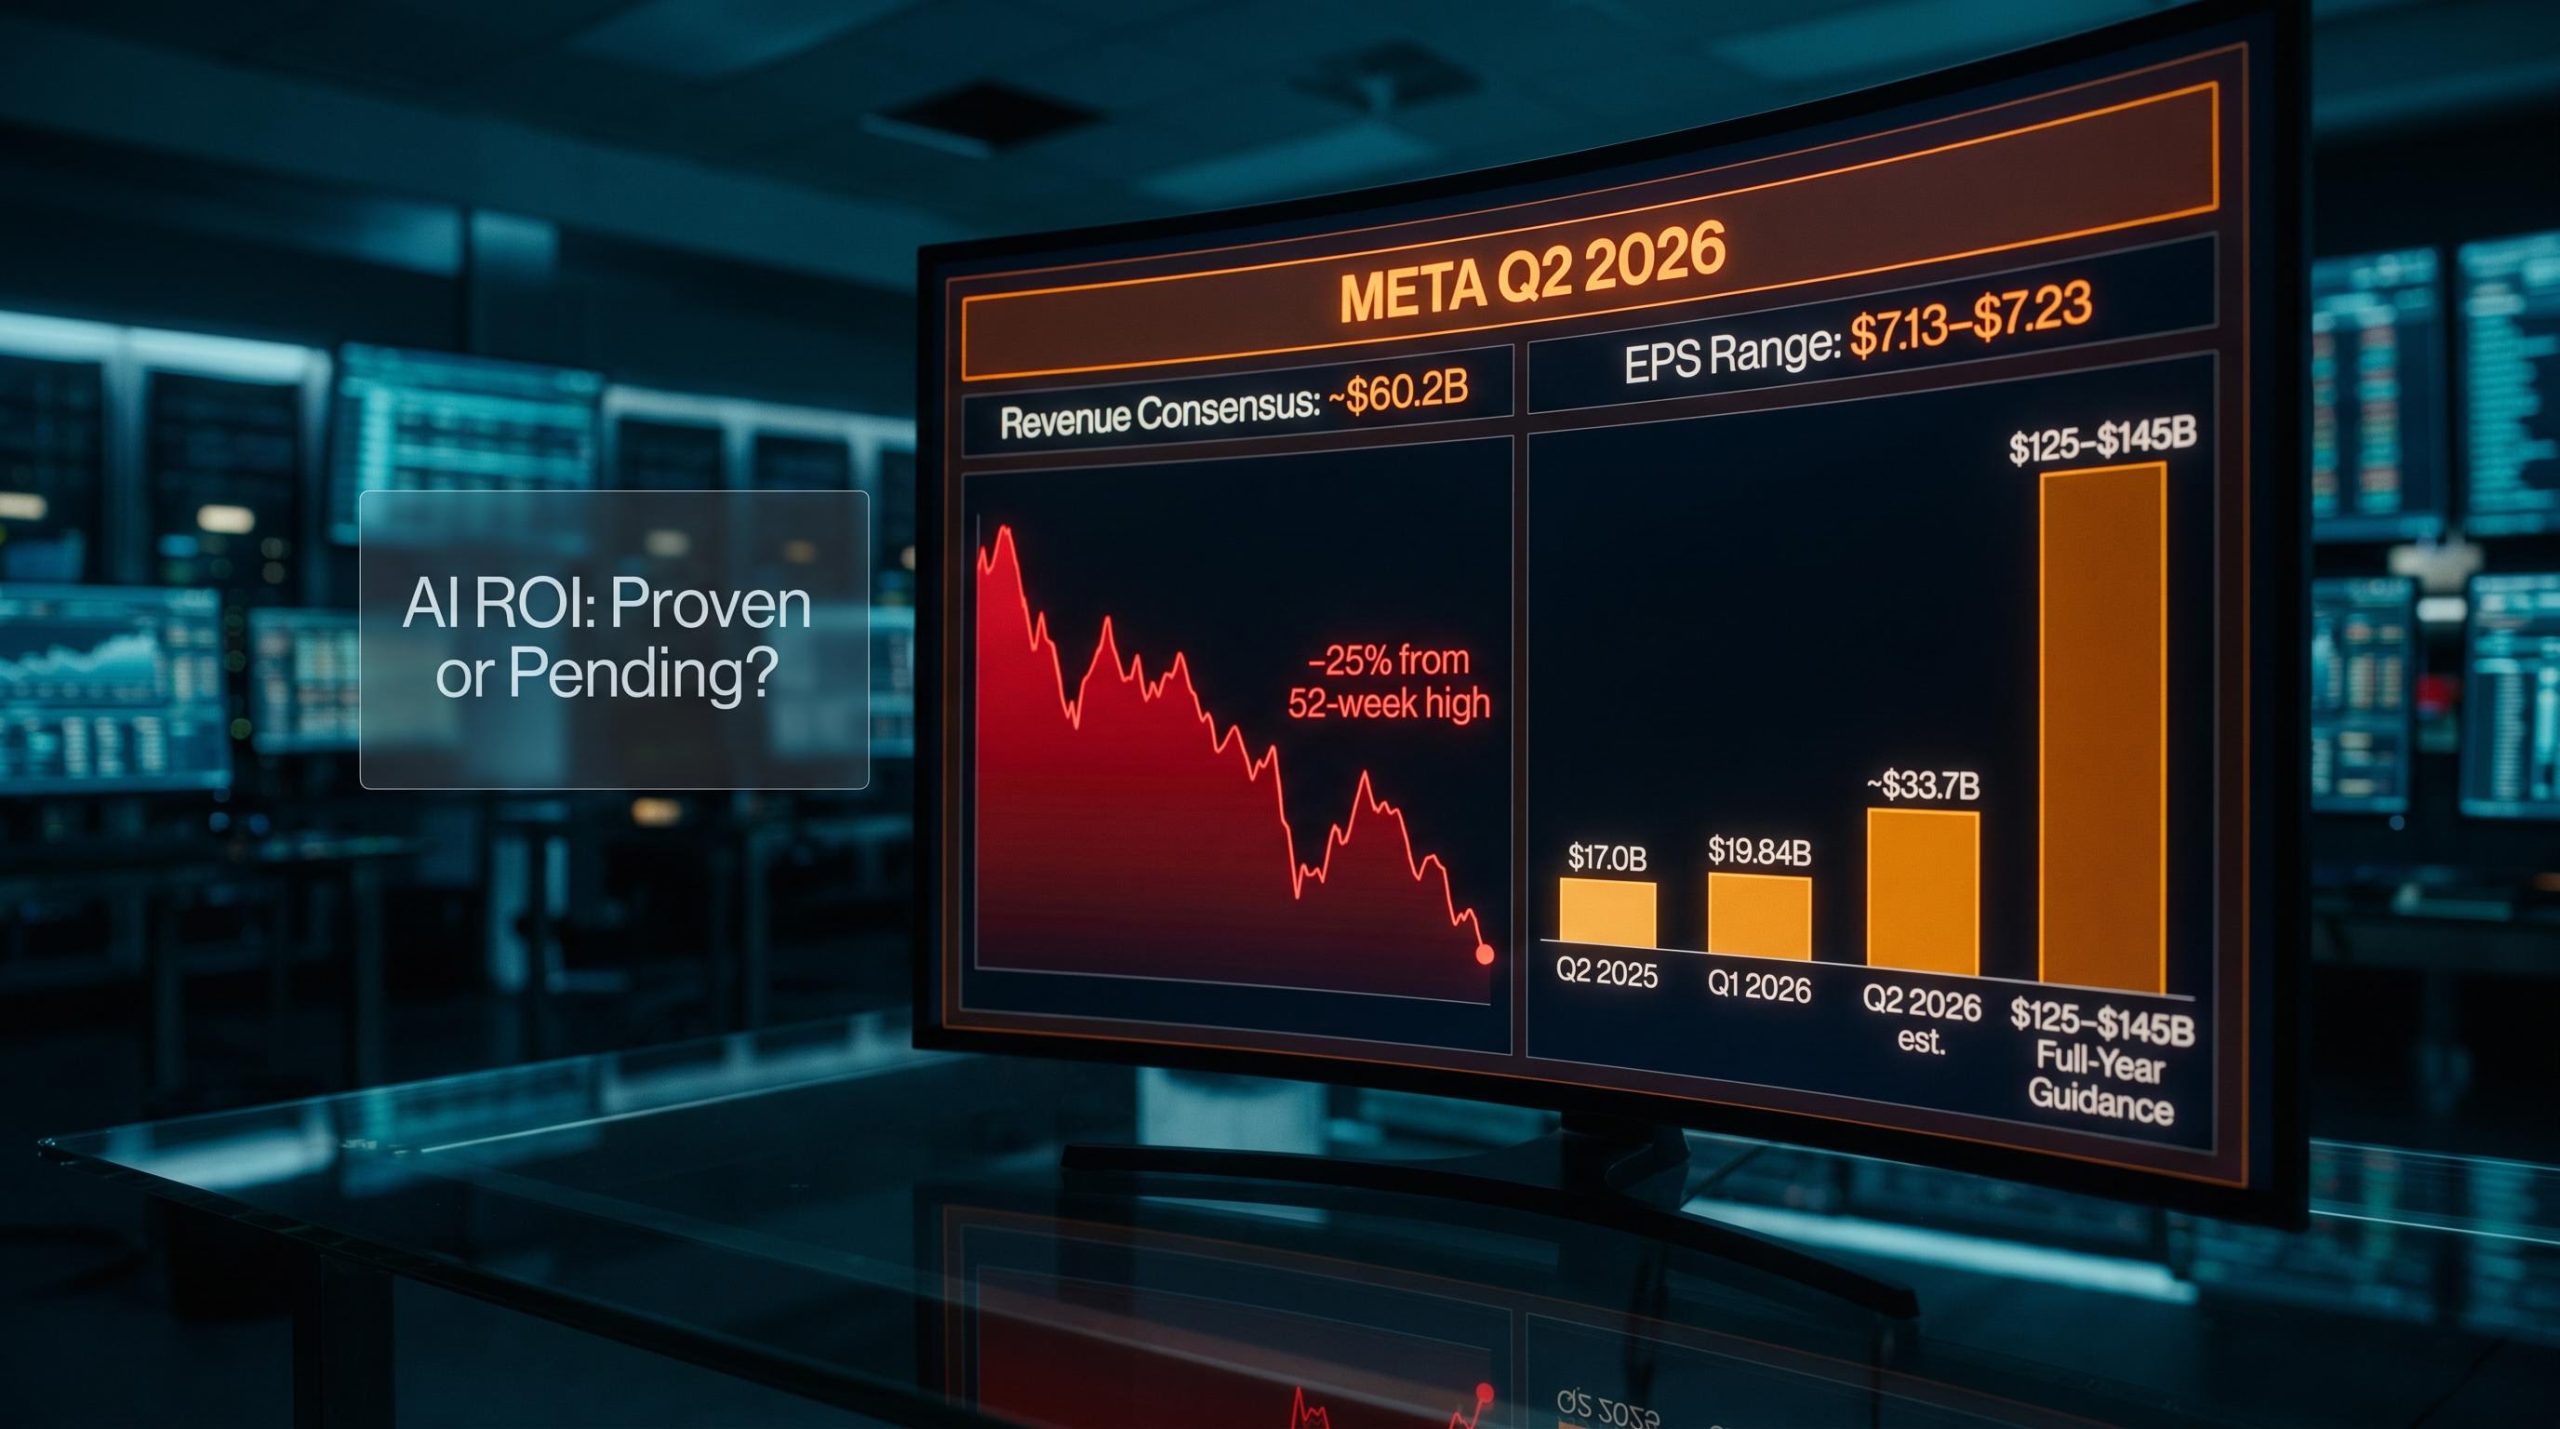
The timing matters. Meta’s Q2 2026 earnings land after market close on July 29, and they arrive at a moment when the short-term trend and the long-term trend are pulling in opposite directions. Price is below the 20-day simple moving average (SMA), which tells you the near-term momentum has already tilted bearish. But the broader multi-month structure still reads as a constructive uptrend. That divergence makes tonight’s earnings release more technically consequential than a routine quarterly report, particularly given that investor attention will centre on whether Meta’s record AI capital spending is producing returns.
Here is the technical framework that maps the exact price levels where the market will draw its verdict, built so you can approach the event with a decision structure rather than reacting after the move has already happened.
Where Meta stands technically heading into earnings
The intraday range on July 29 sits at $587-$601, straddling the lower edge of what has become the stock’s most watched technical zone. The July 28 close of $593.41 places price just below the 20-day SMA at approximately $595-$599, a level that has functioned as both support and resistance across the past several months.
That positioning is not neutral. Price below its 20-day average on the day of a major earnings release tells you the market has already made a modest bearish statement. The earnings result will either ratify or reverse that positioning; it will not arrive at neutral ground.
The live battleground: Meta’s July 29 trading range ($587-$601) converges with the 20-day SMA ($595-$599), placing price directly inside the zone that will determine post-earnings trend direction.
The 52-week range of approximately $520-$796 provides the structural canvas. The current pullback sits well above the $520 floor but has given back significant ground from the highs, with the 50-day SMA at approximately $638 overhead as a medium-term reminder of how far the short-term trend has deteriorated. The stock is caught between a longer-term uptrend that remains intact and a short-term correction that has not yet resolved.
When big ASX news breaks, our subscribers know first
The $575-$595 battleground zone explained
The $575-$595 band is not a single line on a chart. It is a convergence of independent technical signals that all point to the same narrow range, and that convergence is what gives it weight.
This band established itself as a base where purchasing activity repeatedly emerged throughout the April-June 2026 consolidation window, demonstrating that market participants have treated this price area as a floor worth defending. At its upper edge, the 20-day SMA at approximately $595-$599 reinforces the ceiling. A separate trendline breakout level at $595 independently corroborates the same area. And from a Fibonacci perspective, an April 2026 outlook flagged $573-$575 as the 0.236 support zone, with $595.12 forming the first resistance cluster above.
Fibonacci retracement levels derive their practical weight from collective trader recognition, which creates self-reinforcing price behaviour at key zones; the $573-$575 level flagged in the battleground band represents the 0.236 retracement, the shallowest of the standard Fibonacci ratios and typically the first level the market tests before deciding whether a correction has further to run.
The band also has internal structure. The $574.66 level is the critical lower boundary. Between there and the upper edge sits an interim demand zone at $580-$585, where put-support activity has concentrated.
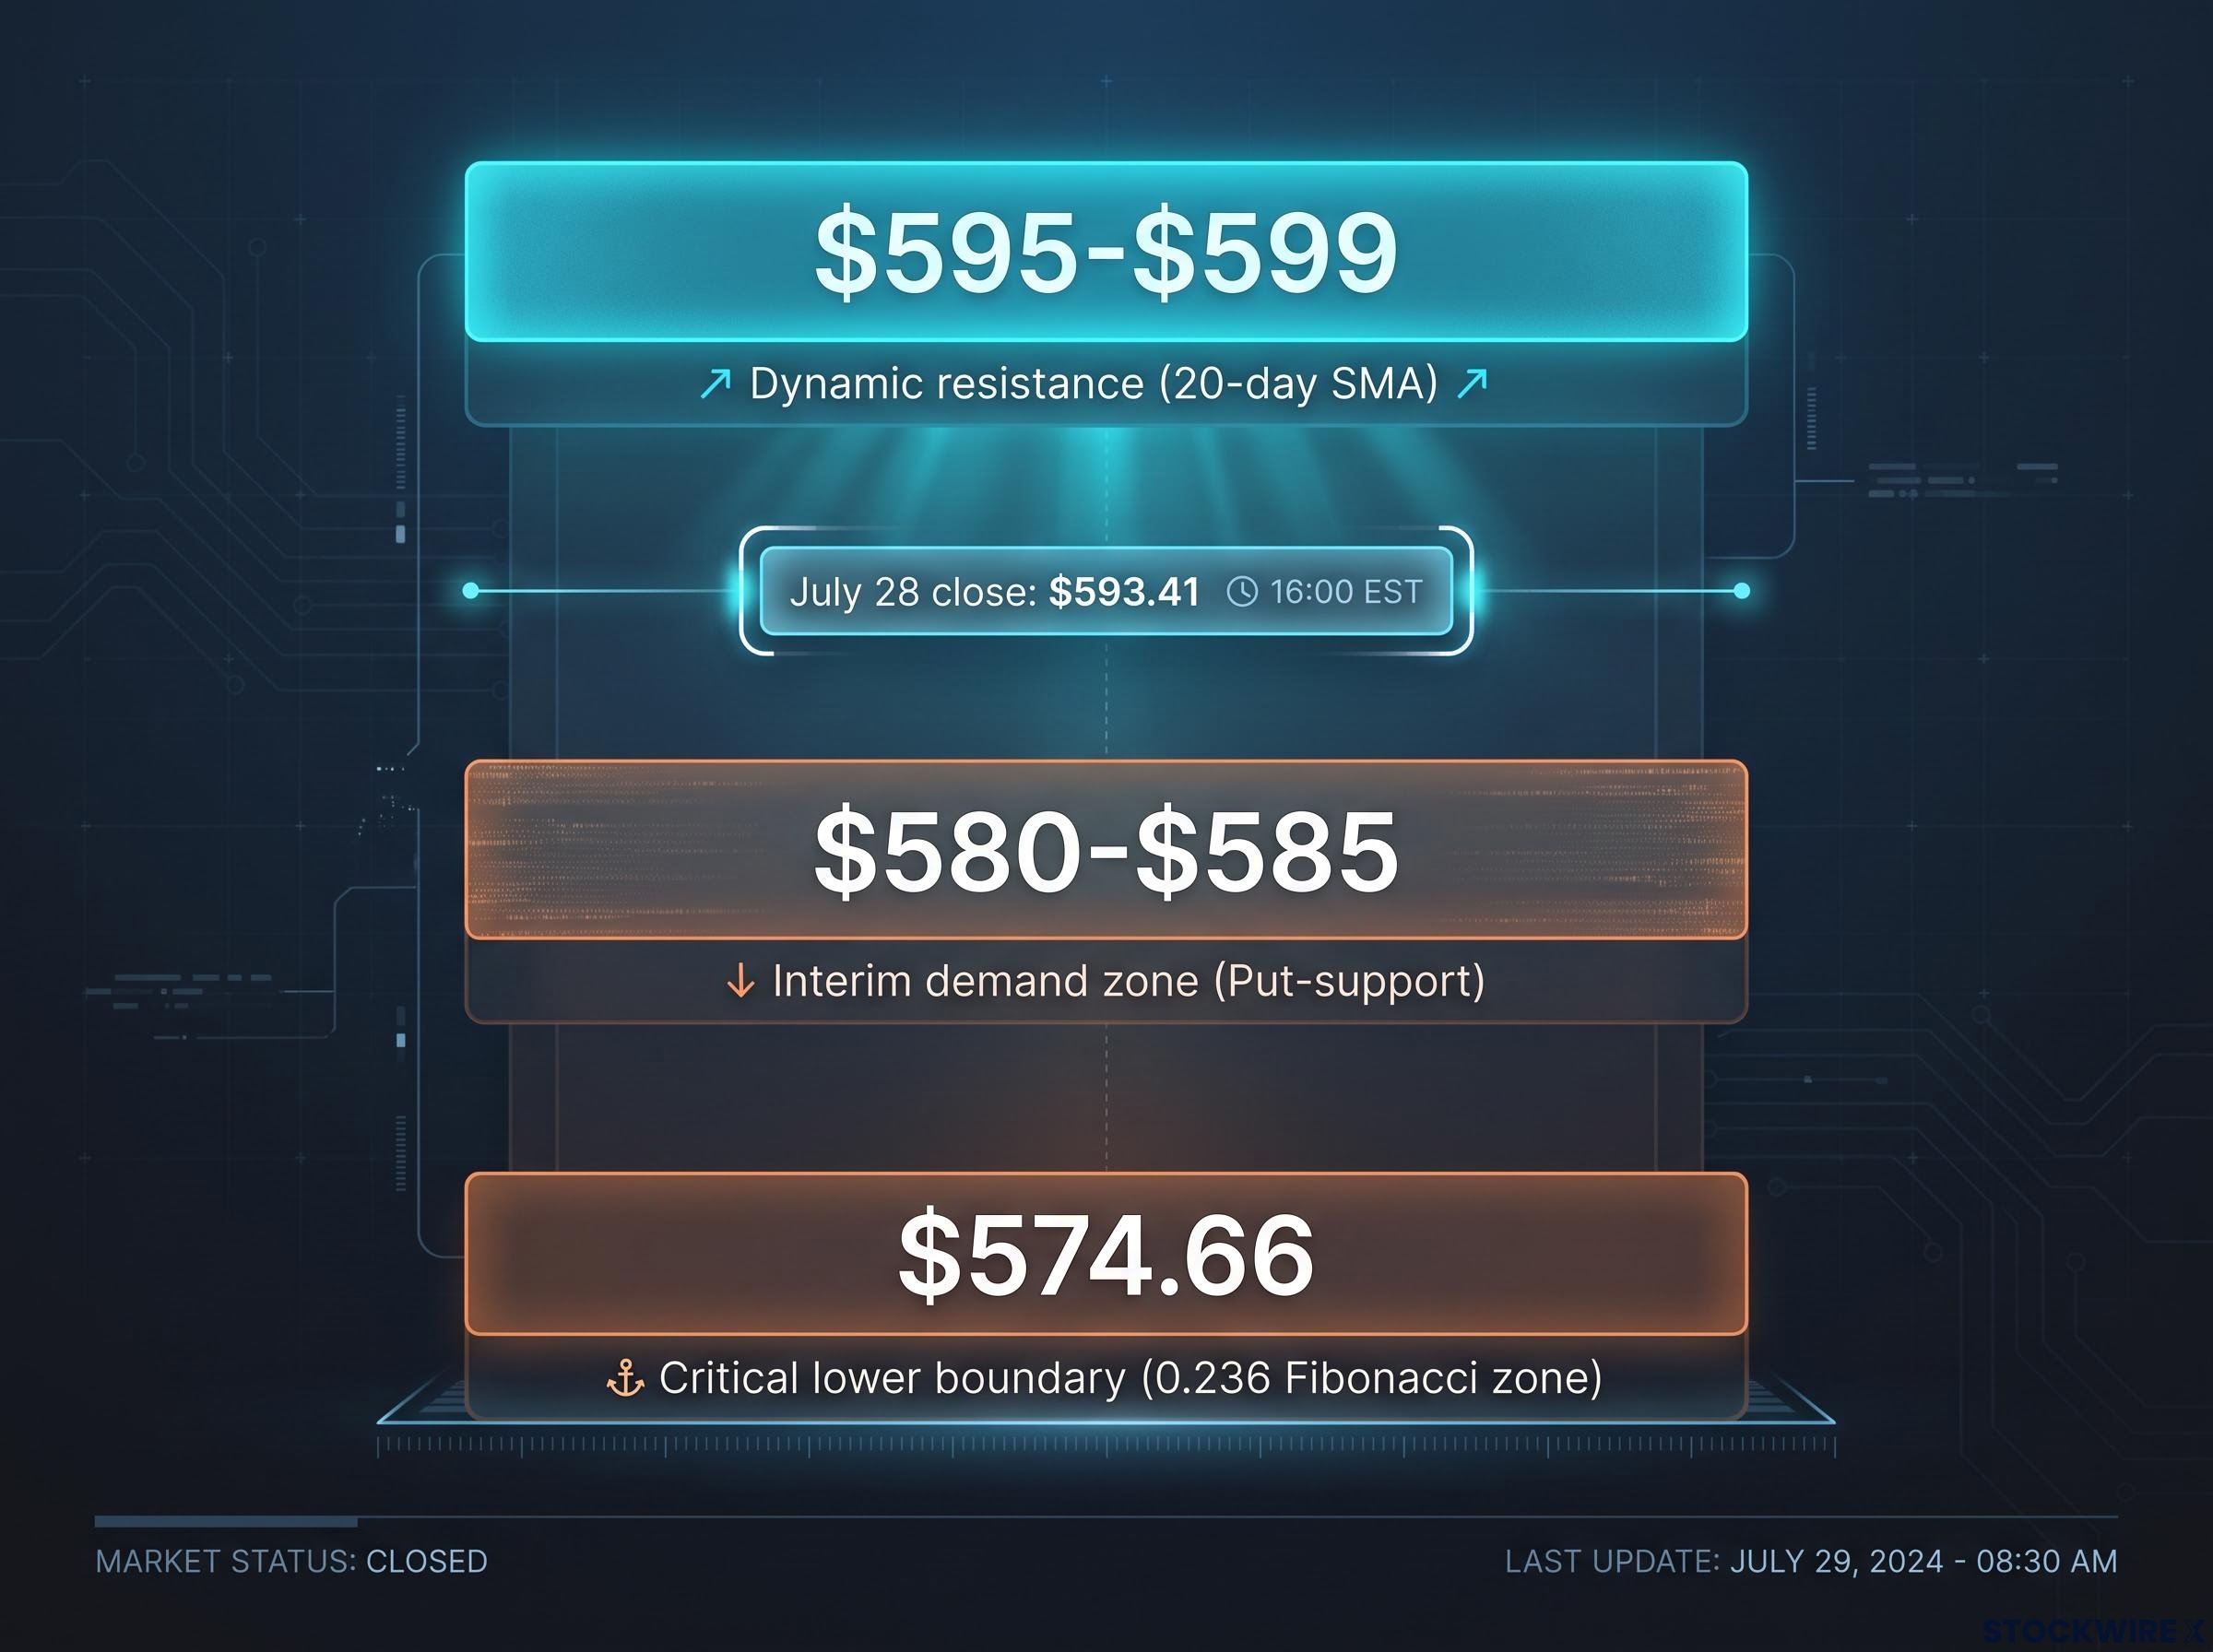
What “reclaiming” this zone means technically is specific: a daily close above $595-$600 on strong volume is the first sign bulls are regaining control. An intraday spike above that level that fades by the close does not count.
Multiple independent analytical methods all marking the same narrow price band is the technical market’s way of identifying the line in the sand. Understanding that convergence is what separates an informed read from a guess.
| Level | Price | Technical basis | Significance |
|---|---|---|---|
| Critical lower boundary | $574.66 | 0.236 Fibonacci zone ($573-$575) | Break below triggers deeper move |
| Interim demand zone | $580-$585 | Put-support concentration | First internal floor within the band |
| Dynamic resistance | $595-$599 | 20-day SMA / trendline breakout | Must close above for bullish reclaim |
How Bollinger Bands and RSI frame the earnings coil
Before the explanatory detail, here is the pre-earnings indicator snapshot:
- Bollinger mid-band position: Price is trading below the mid-band (approximately $595-$620 depending on period), confirming the short-term bearish lean.
- Bollinger upper band target zone: Upper bands extend into the $630-$690+ range, with some longer-period setups reaching $691-$707, aligning with the $650-$700 resistance band.
- RSI (14-day) range: Readings sit at 36-44, approaching oversold but not at extreme levels.
The Bollinger Band framework tells a specific story at this juncture. With price below the mid-band, a sustained push toward the upper band ($650-$700 zone) requires first reclaiming the mid-band at $595-$620. There is no shortcut to bypassing it. A post-earnings gap above the mid-band on strong volume would be the first signal that the Bollinger structure is shifting from bearish lean to bullish expansion.
The RSI reading adds a layer of coiled tension. At 36-44, momentum has softened but has not reached the extreme oversold levels (below 30) that typically precede mechanical bounces. RSI, or the Relative Strength Index, measures the speed and magnitude of recent price changes on a scale of 0 to 100, with readings below 30 considered oversold and above 70 considered overbought.
The RSI coil: Readings in the mid-30s to low-40s on earnings day mean the market is not oversold enough to guarantee a bounce, but has softened enough that a positive fundamental surprise would likely produce a sharper-than-normal upside reaction. Equally, a disappointment can accelerate selling from already weakened momentum.
There is no current evidence of an extreme Bollinger squeeze (a period of unusually compressed volatility that often precedes large moves), but the combination of sub-mid-band price action and a coiled RSI means the earnings catalyst has the technical conditions to produce a decisive move in either direction.
What is technical analysis and why earnings events test it
Technical analysis is the practice of using historical price behaviour, chart patterns, and statistical indicators to identify where a stock is likely to find support, meet resistance, or signal a change in trend direction. Rather than asking “what is this company worth?”, it asks “where are buyers and sellers drawing their lines?”
Four indicator types are at work in the Meta setup:
- Support and resistance levels measure fixed price zones where buying or selling pressure has previously concentrated (the $575-$595 band).
- Moving averages track the average closing price over a specified period, creating a dynamic line that moves with price (the 20-day SMA at approximately $595-$599).
- Bollinger Bands measure volatility by plotting bands above and below a moving average, showing whether price is stretched or compressed relative to recent norms.
- RSI (Relative Strength Index) measures momentum, specifically whether recent price moves have been predominantly upward or downward over a set period.
Why earnings events are high-stakes moments for the framework
Earnings compress months of fundamental reassessment into a single post-market reaction. The price move that follows either validates or invalidates the chart structure that had been building. In Meta’s case, the stock was already at a technically significant zone before the news, meaning the reaction is amplified rather than starting from a neutral position.
The expectations gap mechanics explain why a technically significant zone amplifies post-earnings reactions: with 84% of S&P 500 companies beating estimates in Q1 2026 against a 10-year average of 76%, the market has already priced in a beat, meaning Meta’s reaction tonight will hinge on guidance and AI return commentary rather than the headline revenue figure.
The convergence logic from the battleground zone section applies here too: when multiple independent signals all mark the same price area, that area carries more weight than any single indicator could provide on its own.
Understanding that technical levels are not predictions but probability frameworks changes how you use them. They become decision rules (if price does X, then Y) rather than forecasts, which is a more structured and honest way to approach a binary event like earnings.
The two upside targets and two downside scenarios post-earnings
The framework below is designed as a decision tree, not a prediction. The market will not give a single verdict signal but a sequence of confirmations.
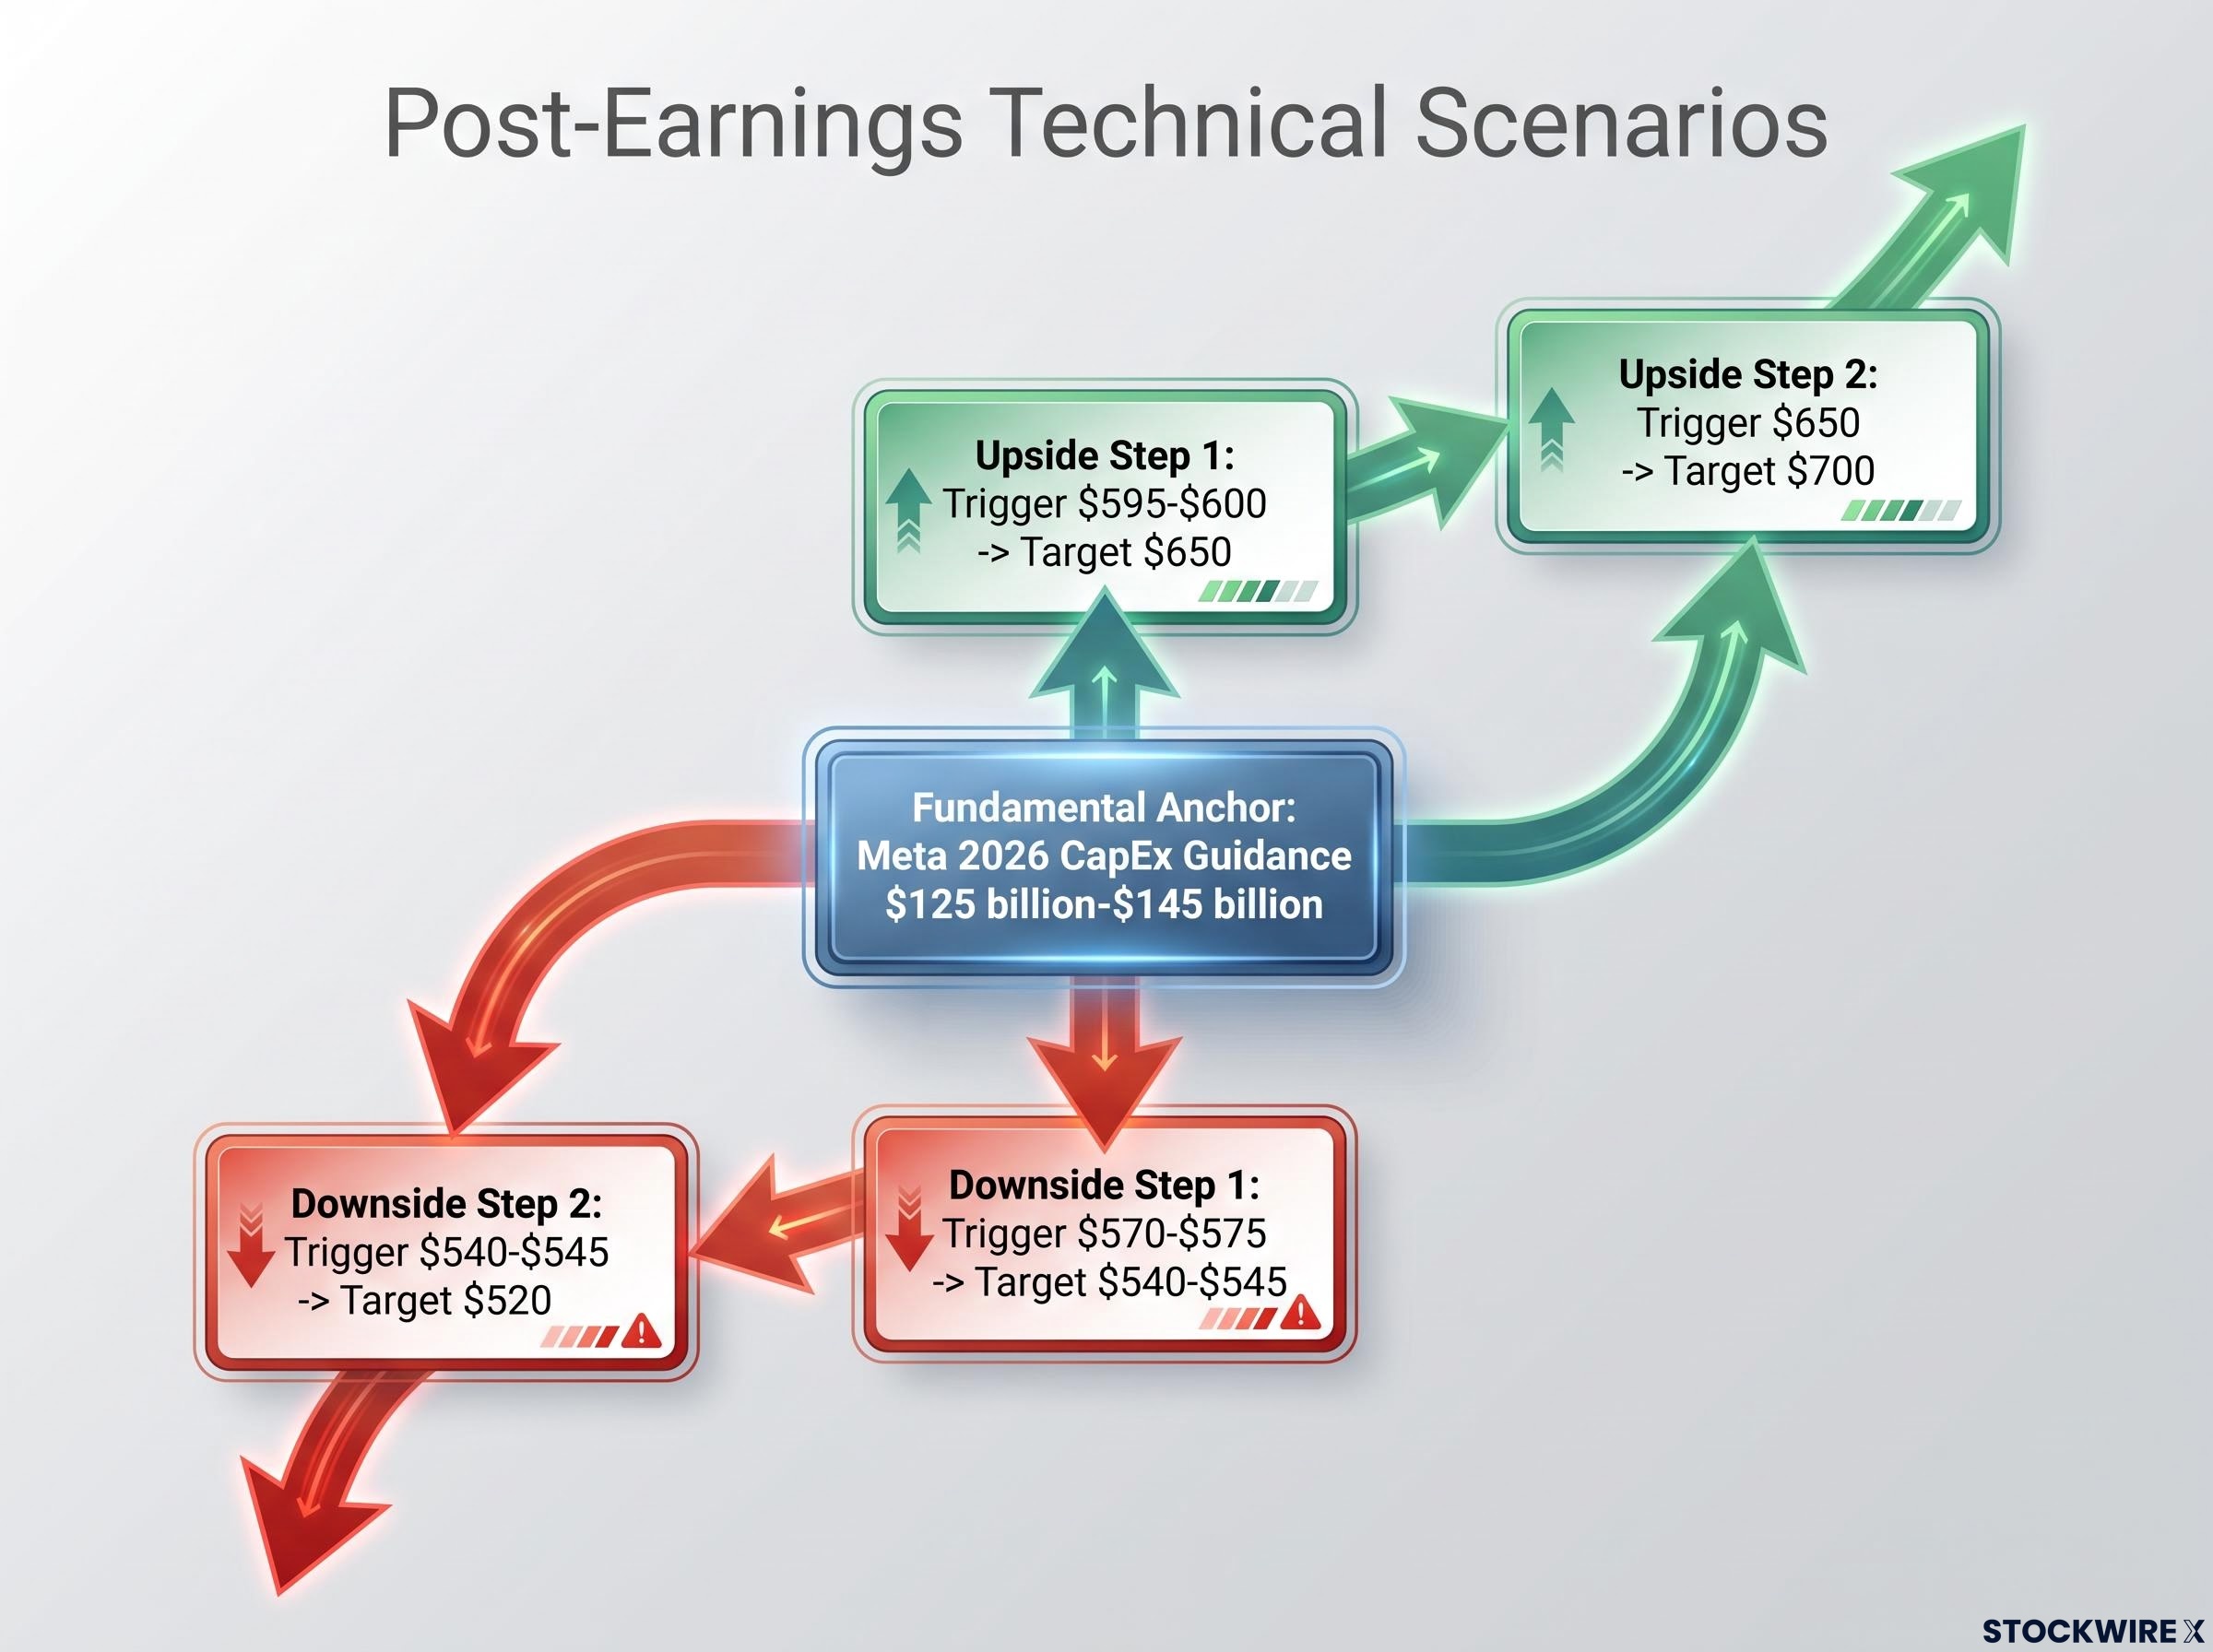
Upside path, step one: A daily close above $595-$600 on strong volume confirms the $575-$595 battleground zone is reclaimed. That is the first technical sign bulls are regaining control.
Upside path, step two: A decisive break above $650 (the July 2026 swing high, with the 50-day SMA at approximately $638 as an intermediate hurdle) opens the technically clean path toward $700.
Downside path, step one: A close below $570-$575 with follow-through selling signals the market has moved beyond a routine pullback.
Downside path, step two: A sustained close below $540-$545 opens the path toward prior lows near $520.
The fundamental catalyst maps directly to these levels. Strong revenue, margin resilience, and concrete evidence that AI spending is generating returns maps to the upside sequence. Heavy AI capital expenditure commentary without clear payback timelines maps to the downside sequence.
The fundamental anchor: Meta’s 2026 capital expenditure guidance of $125 billion-$145 billion is the number the market will weigh against tonight’s commentary. Alphabet’s prior-week CapEx announcement has already set the benchmark against which Meta’s AI spending will be assessed.
Meta’s CapEx commitment has been the central investor concern since Q1 2026, when the company raised full-year guidance to $125-$145 billion and revised free cash flow estimates fell from approximately $35 billion to $25 billion, establishing the fundamental tension that tonight’s commentary will either ease or deepen.
The two-step structure of both scenarios tells you that the market will deliver a sequence of confirmations, not a single signal. Waiting for that confirmation rather than anticipating the move is what separates a structured approach from speculation.
| Scenario | Trigger level | Confirmation signal | Next target |
|---|---|---|---|
| Upside step 1 | $595-$600 | Daily close on strong volume | $650 |
| Upside step 2 | $650 | Break above swing high / 50-day SMA | $700 |
| Downside step 1 | $570-$575 | Close below with follow-through selling | $540-$545 |
| Downside step 2 | $540-$545 | Sustained close below | $520 |
What different investor profiles should watch for after the close
The same technical levels carry genuinely different meanings depending on your time horizon and risk tolerance. Here is how the framework applies to three distinct profiles.
Short-term traders
- Watch for the gap-and-hold pattern on earnings morning: a strong open above the $575-$595 zone that sustains in the first hour on high volume signals momentum, not just short-covering.
- A rejection near $598-$603 (the 20-day SMA ceiling) sustains the short-term downtrend and favours the bearish lean.
- First-hour volume is the confirmation mechanism. A gap without volume is noise.
Swing traders
- Aggressive entry: Look for a reclaim of $575-$595 with RSI turning up from the mid-30s, targeting $650 as first take-profit.
- Conservative entry: Wait for a clear daily close above $650, then use that level as new support with $700 as the next objective.
- The distinction matters: the aggressive setup offers a wider profit window but requires sitting through volatility in a contested zone. The conservative setup sacrifices the first leg of the move for higher-probability confirmation.
Longer-term investors
- The longer-term uptrend remains constructive above major multi-month support, with the 200-week moving average serving as the structural reference for buy-on-dislocation approaches.
- A controlled pullback into long-term moving average support is a buy zone if AI and monetisation commentary from the earnings call confirms the fundamental thesis.
- If earnings and guidance undermine the AI return thesis and price fails to reclaim $575-$595 over subsequent weeks, the corrective phase may be evolving into structural derating, warranting patience rather than commitment.
The same $650 level means a take-profit exit for the swing trader and a confirmation entry point for the conservative longer-term investor. Technical levels are not universally directional signals; they are tools you calibrate to your own time horizon.
What the chart will confirm once the dust settles
The technical framework does not predict whether tonight’s earnings will be strong or weak. What it does is ensure you will know within the first full trading session whether the bullish or bearish scenario is activating, because the levels are defined, the confirmation signals are specific, and the sequence is clear.
Both paths require two steps, not one. The market will deliver a sequence, and reading that sequence in real time is the framework’s purpose.
The longer-term perspective holds regardless of the immediate reaction: Meta’s position within a broader multi-year uptrend means the chart will continue to provide structured reference points. The fundamental question about AI capital expenditure returns, framed by the $125 billion-$145 billion CapEx guidance, will not be answered in one earnings call. That means this technical framework has durability beyond tonight.
The AI infrastructure return debate framing Meta’s Q2 setup mirrors the central question that emerged after Q1, specifically whether the company’s compute buildout resembles Amazon’s early AWS investment cycle or the pattern of the 2021-2022 metaverse overbuild, a distinction that shapes how analysts interpret any single earnings call.
| Zone | Price level | Role |
|---|---|---|
| Deep support | ~$520 | 52-week low / prior base |
| Secondary support | $540-$550 | Floor if $575 fails |
| Critical support | $570-$575 | Break triggers deeper move |
| Primary battleground | $575-$595 | Must reclaim for bullish case |
| First major resistance | $650 | July 2026 swing high / Fibonacci reference |
| Major upside target | $700 | Psychological barrier / upper Bollinger zone |
This article is for informational purposes only and should not be considered financial advice. Investors should conduct their own research and consult with financial professionals before making investment decisions. Past performance does not guarantee future results. Technical levels represent probability frameworks, not guaranteed outcomes, and are subject to change based on market developments and company performance.
—