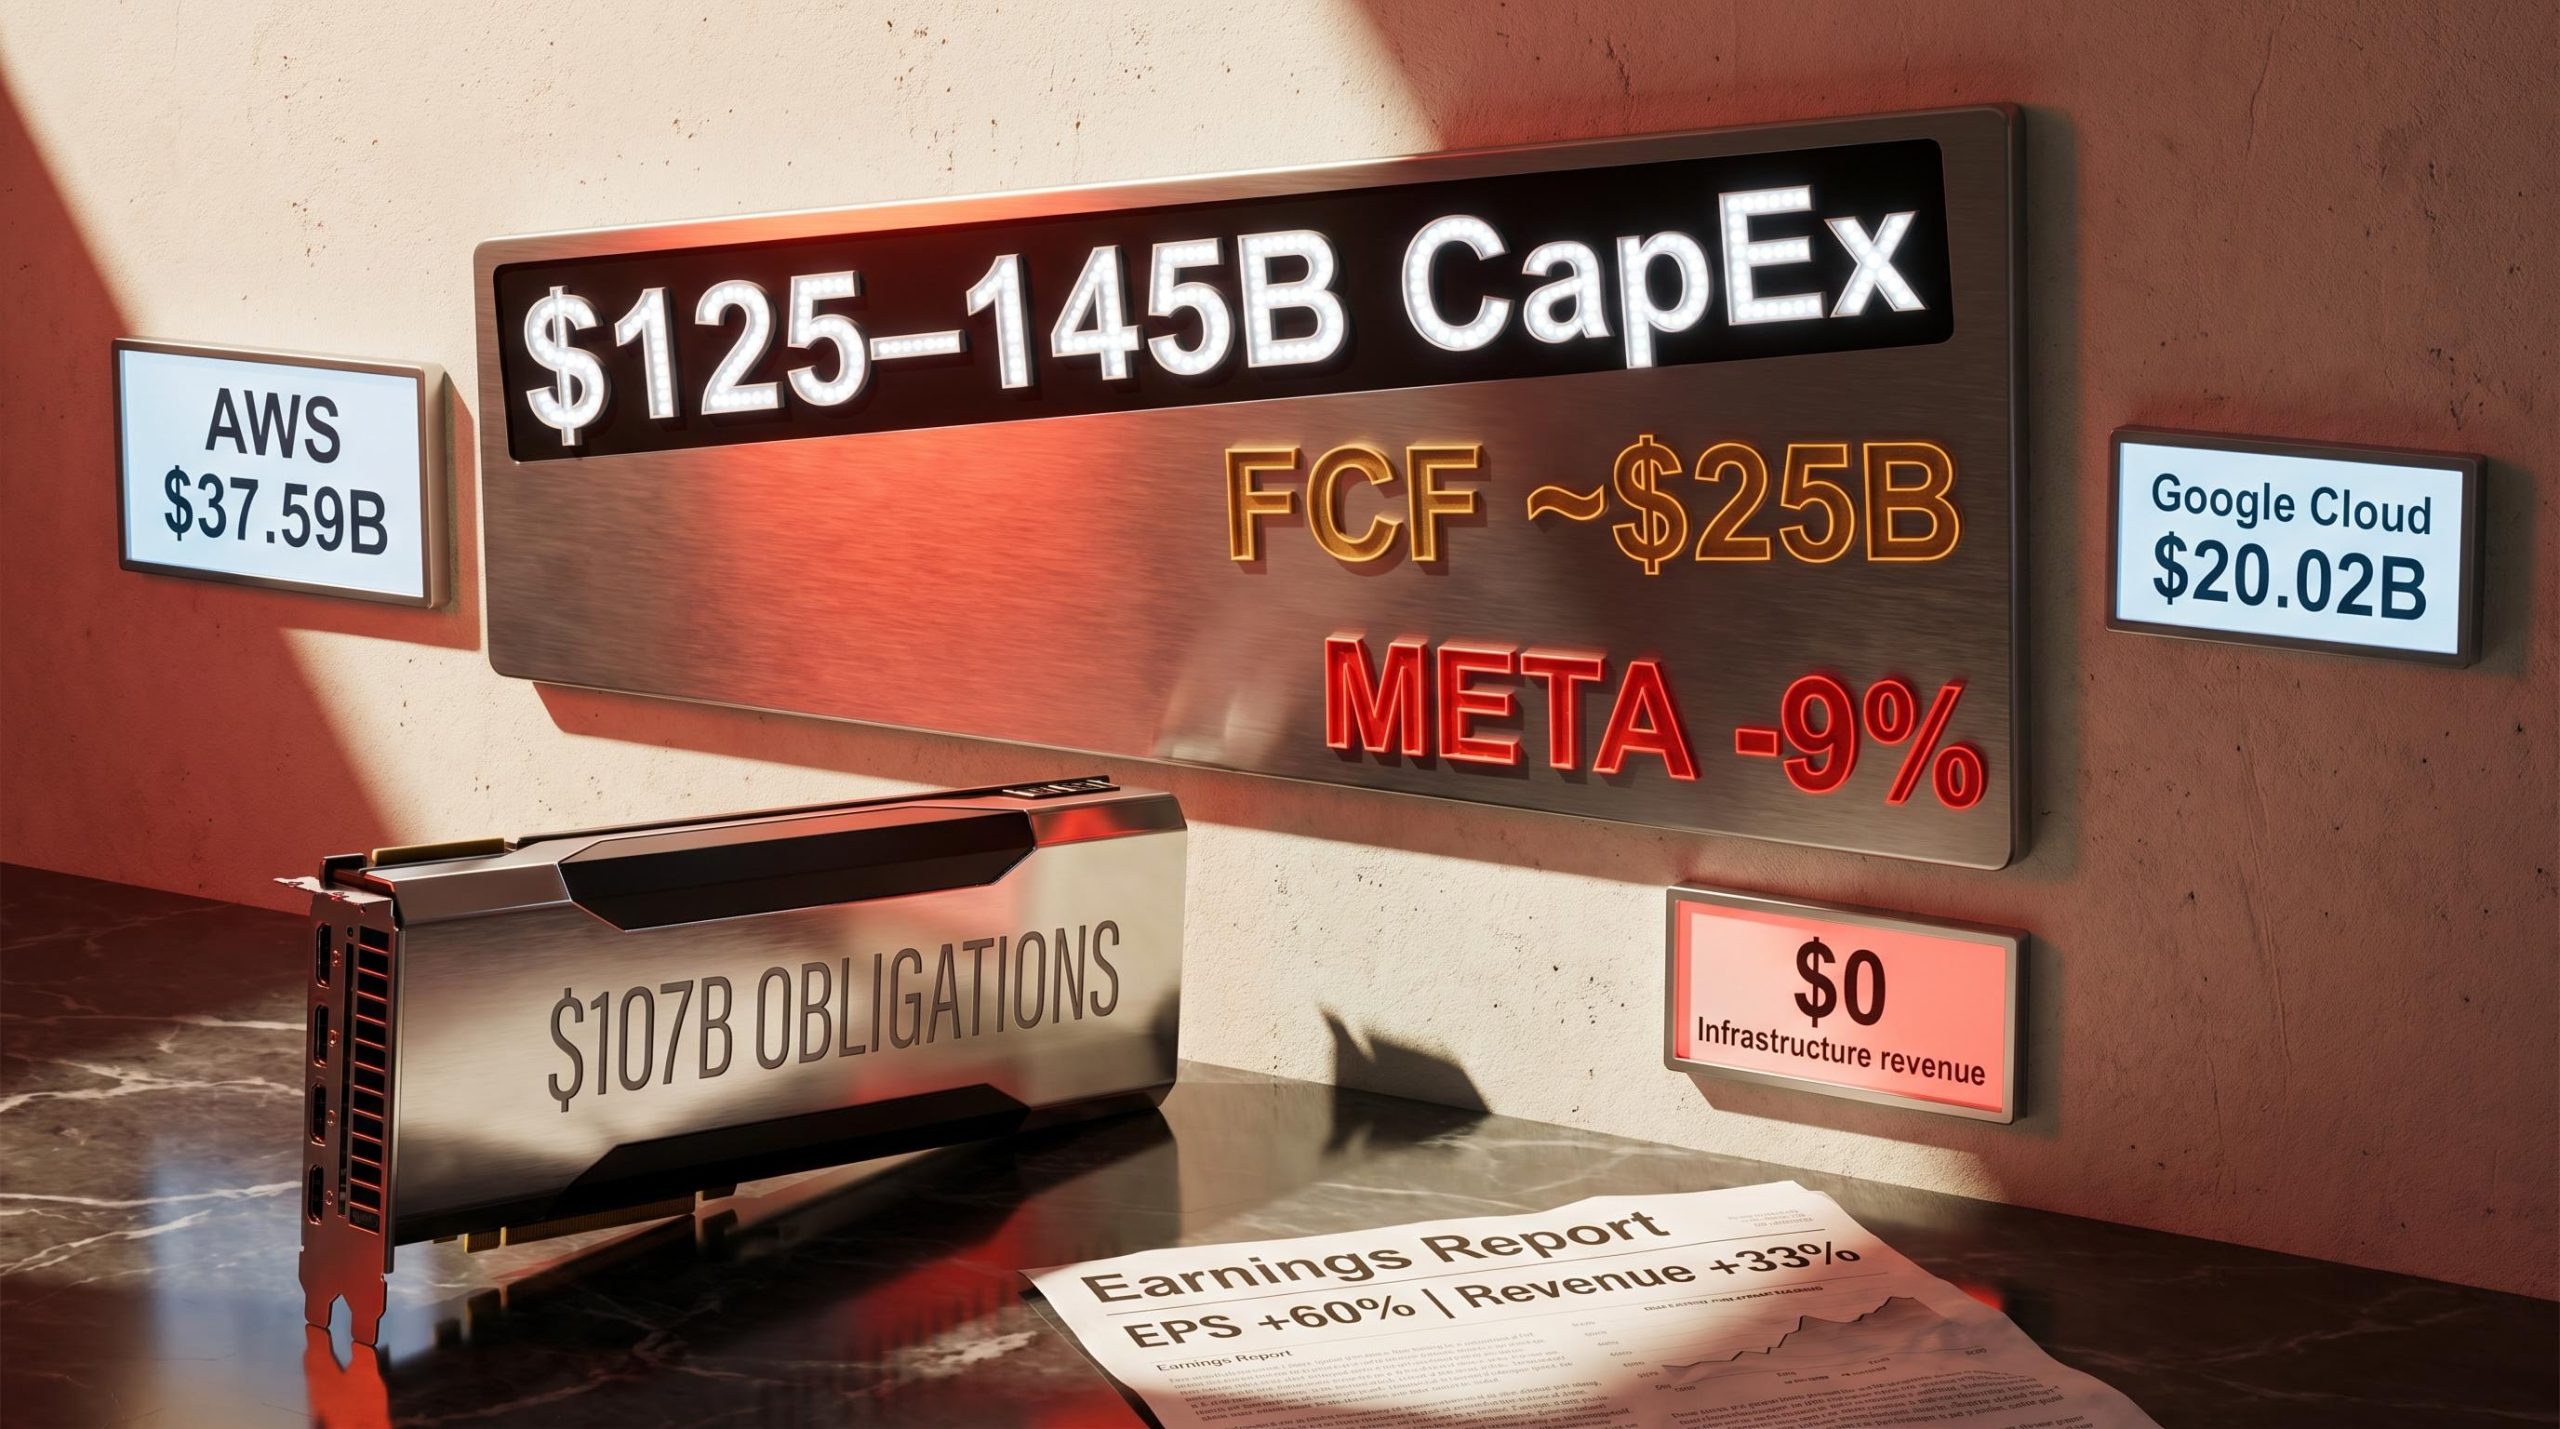
Meta Platforms delivered 33% revenue growth and 60% earnings-per-share expansion in its Q1 2026 results. The stock fell roughly 9% in the session that followed, erasing approximately $150 billion in market capitalisation. The numbers were not the problem. The capital commitments were. Meta’s earnings call disclosed that the company had materially underestimated its compute requirements, triggering a full-year capital expenditure guidance raise to $125-145 billion and revealing $107 billion in near-term infrastructure obligations. For investors evaluating a stock that has historically operated as a capital-light advertising platform, these figures introduce a structurally different set of questions. This analysis works through what Meta’s infrastructure escalation means for free cash flow, how the spending model compares to cloud-monetising peers, what early AI return signals look like, and what the range of return scenarios implies for investors holding or considering the stock near its current price of approximately $610.
The admission investors were not expecting
The Q1 2026 results were, on their own terms, exceptional. Revenue grew approximately 33% year-over-year. Earnings per share expanded roughly 60%. These are numbers that would normally produce a gap-up open.
Instead, Meta shares dropped approximately 9% in after-hours trading, touching an intraday low near $605. The asymmetry between operating performance and market reaction tells investors something specific: the sell-off was not about what the company earned but about what it intends to spend.
The big tech earnings setup heading into the Q1 2026 reporting period was itself unusual, with options markets pricing 5-7% post-earnings moves across Alphabet, Amazon, Meta, and Microsoft simultaneously, a configuration that amplified the market impact of any single company’s guidance revision.
Meta’s Chief Financial Officer disclosed during the Q1 2026 earnings call that the company had materially underestimated its compute requirements, a statement that reframed the CapEx guidance raise from a conservative adjustment to an acknowledgement that prior projections were wrong.
Business Insider’s Q1 2026 earnings coverage confirmed CFO Susan Li’s direct acknowledgement that Meta had underestimated its compute requirements, a disclosure that shifted the market’s interpretation of the CapEx raise from a growth signal to an admission of prior forecasting failure.
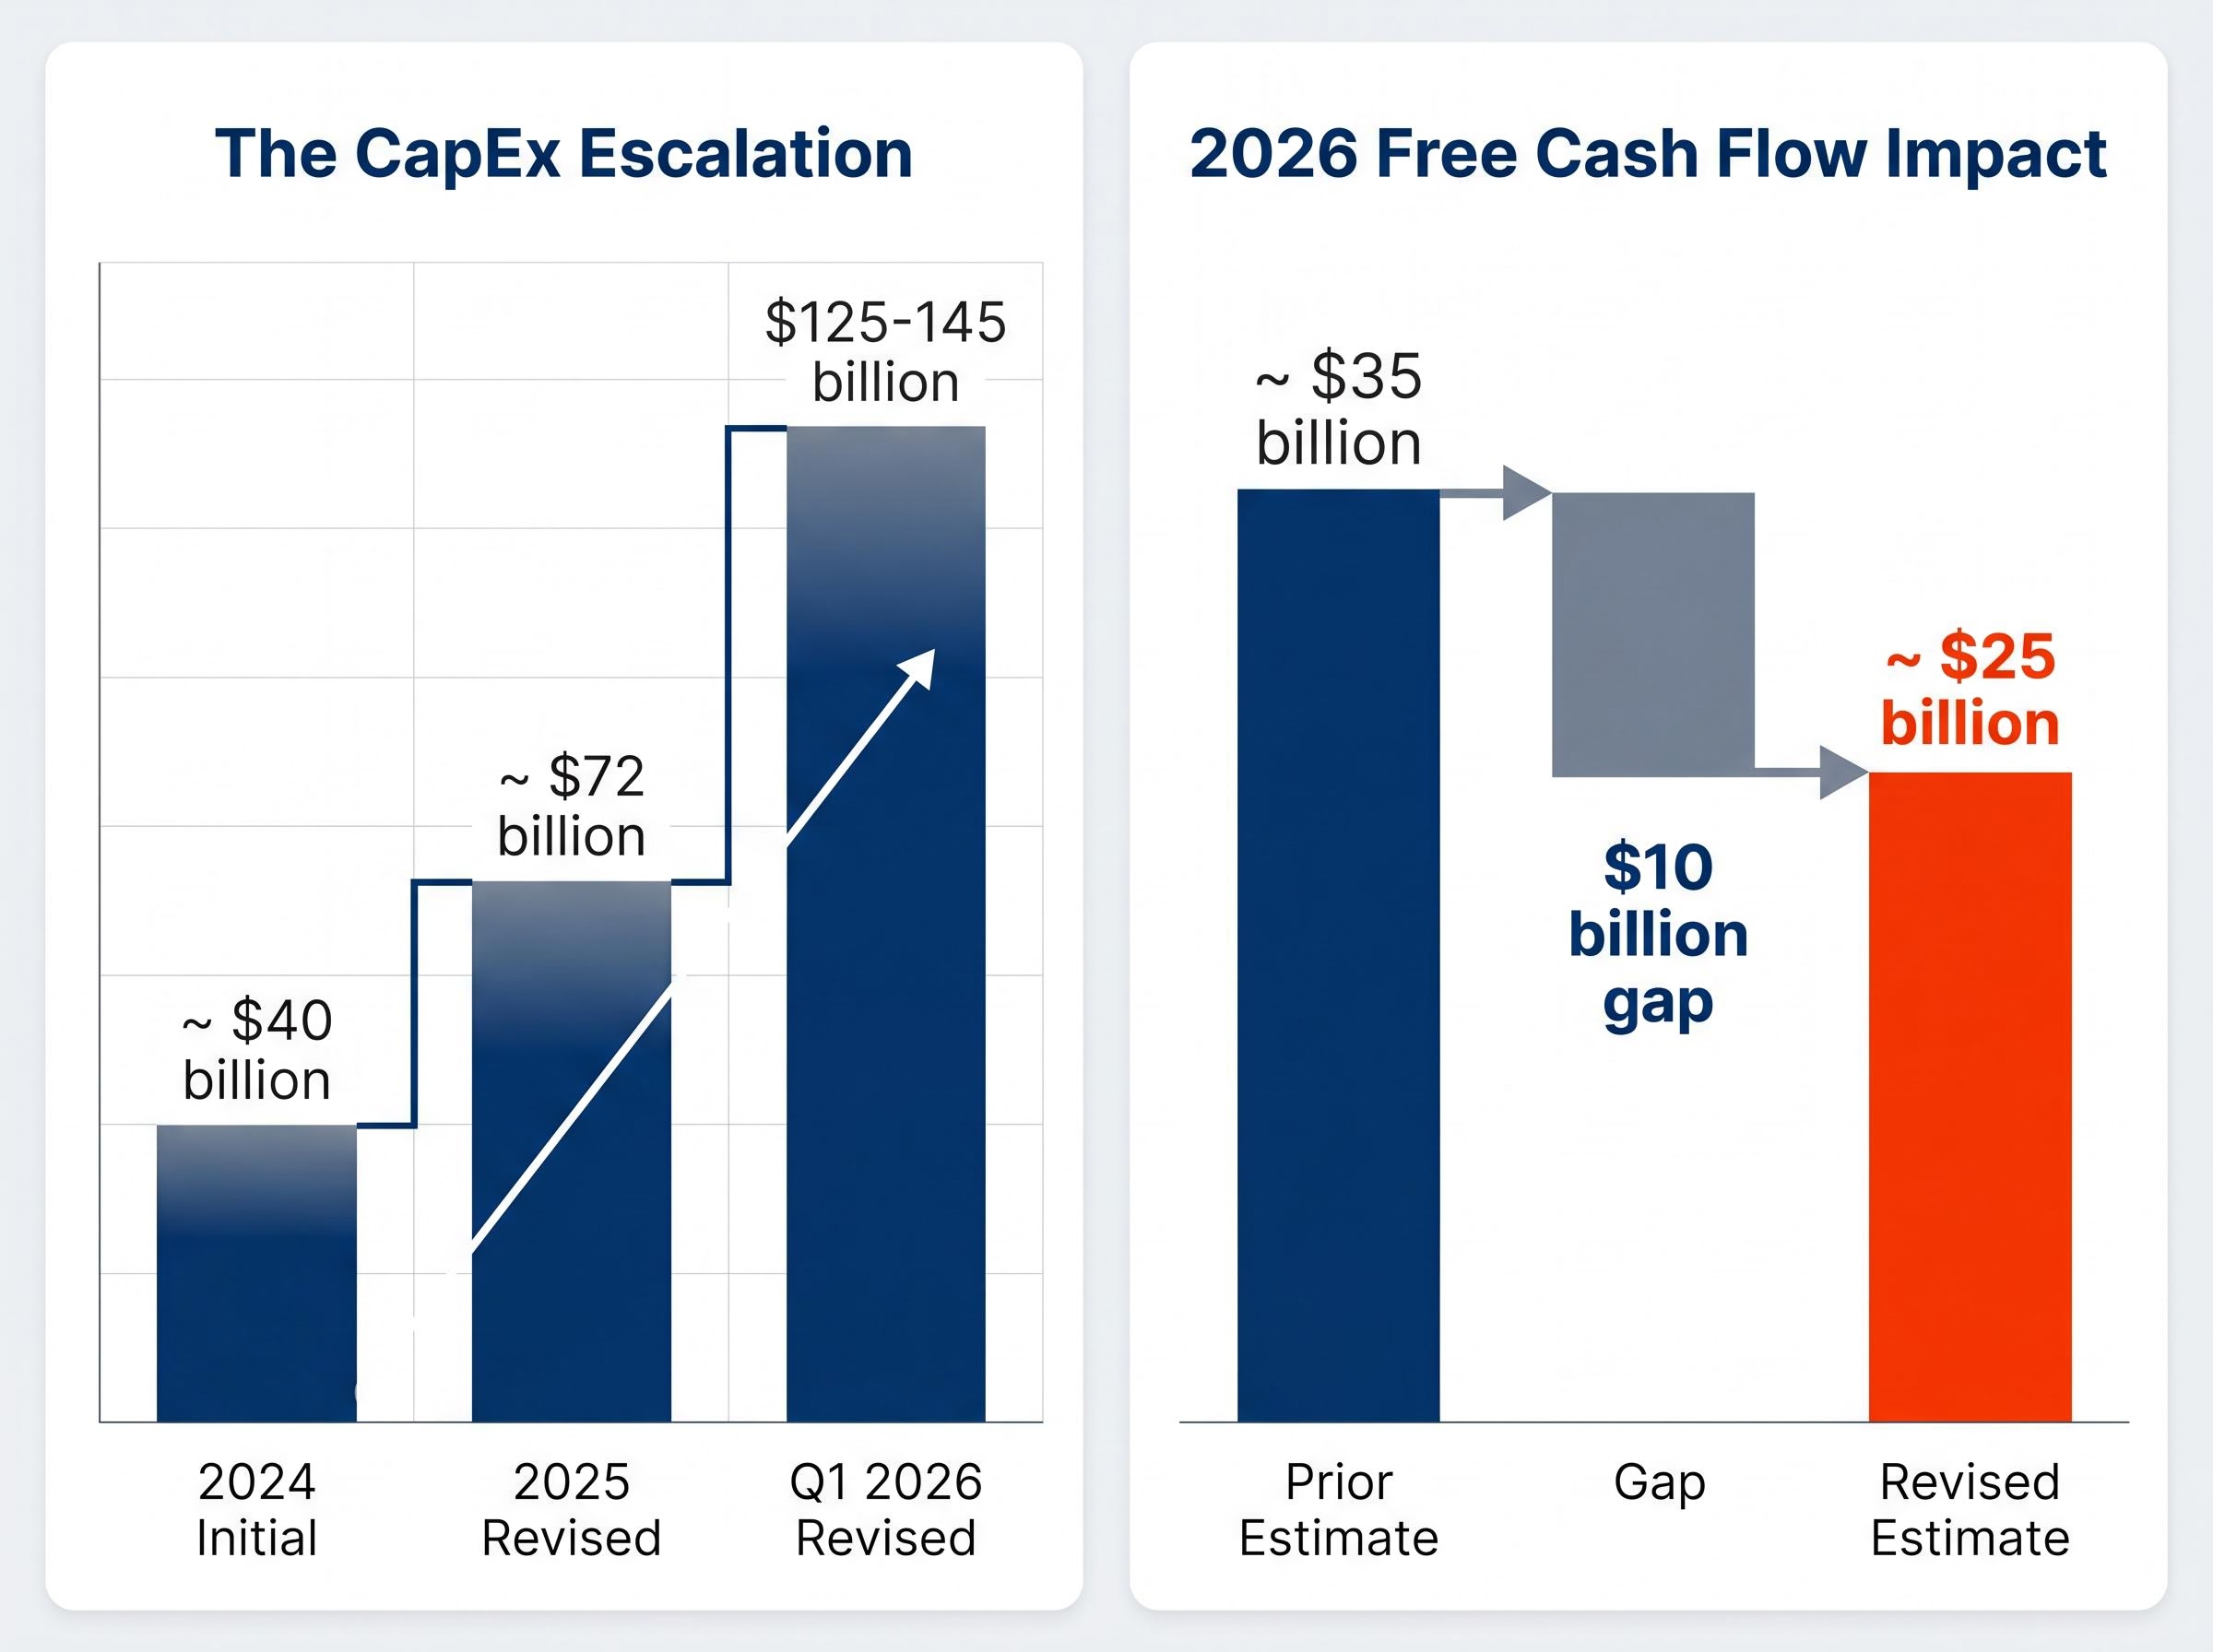
The escalation trajectory sharpens the concern. Within a compressed multi-year window, Meta’s annual CapEx guidance has moved through three distinct tiers:
- Approximately $40 billion (2024 initial programme)
- Approximately $72 billion (2025 revised guidance)
- $125-145 billion midpoint (Q1 2026 revised guidance, up from $115-135 billion set in January 2026)
During Q1 2026 alone, contractual infrastructure commitments increased by $17 billion. The market’s message was clear: strong earnings can coexist with deteriorating capital allocation confidence.
When big ASX news breaks, our subscribers know first
What $107 billion in obligations actually means for cash generation
The headline CapEx guidance of $125-145 billion captures annual spending. The separate $107 billion figure represents cumulative near-term contractual obligations, forward commitments that are locked in regardless of how the next several quarters unfold.
Translating these commitments into cash flow terms makes the compression tangible. Prior consensus estimates had placed Meta’s 2026 free cash flow at approximately $35 billion. Revised projections now sit near $25 billion, a $10 billion gap that directly affects the company’s capacity for share buybacks, debt management, and operational flexibility.
The cash flow repricing that followed Meta’s guidance raise reflects a well-documented pattern in technology investing: markets discount future free cash flow changes faster than they discount reported earnings beats, particularly when the guidance revision implies multi-year spending commitments rather than a single quarter of elevated costs.
| Metric | Prior estimate | Revised estimate |
|---|---|---|
| 2026 free cash flow | ~$35 billion | ~$25 billion |
| Full-year CapEx guidance | $115-135 billion | $125-145 billion |
| Near-term contractual obligations | Not previously disclosed at this scale | ~$107 billion |
Q1 2026 total expenses reached $33.4 billion, up 35% year-over-year, reinforcing that the spending trajectory is accelerating, not stabilising.
Debt load and the buyback pause
Meta now carries approximately $50 billion in debt on its balance sheet. During Q1, buyback activity appears to have paused despite the share price sitting flat to lower year-to-date.
This combination signals a deliberate shift in capital allocation. Management is prioritising infrastructure runway over near-term shareholder returns. That is not inherently negative, but it represents a philosophy change that investors must price into any forward model, particularly those built on assumptions of sustained buyback-driven EPS accretion.
How Meta’s infrastructure model differs from peers that charge for compute
The most immediate comparison for Meta’s CapEx programme is the hyperscaler infrastructure operated by Amazon Web Services and Google Cloud. Both reported Q1 2026 results within days of Meta’s call. The structural difference between their models and Meta’s is the single most important variable for evaluating whether the spending scale is justified.
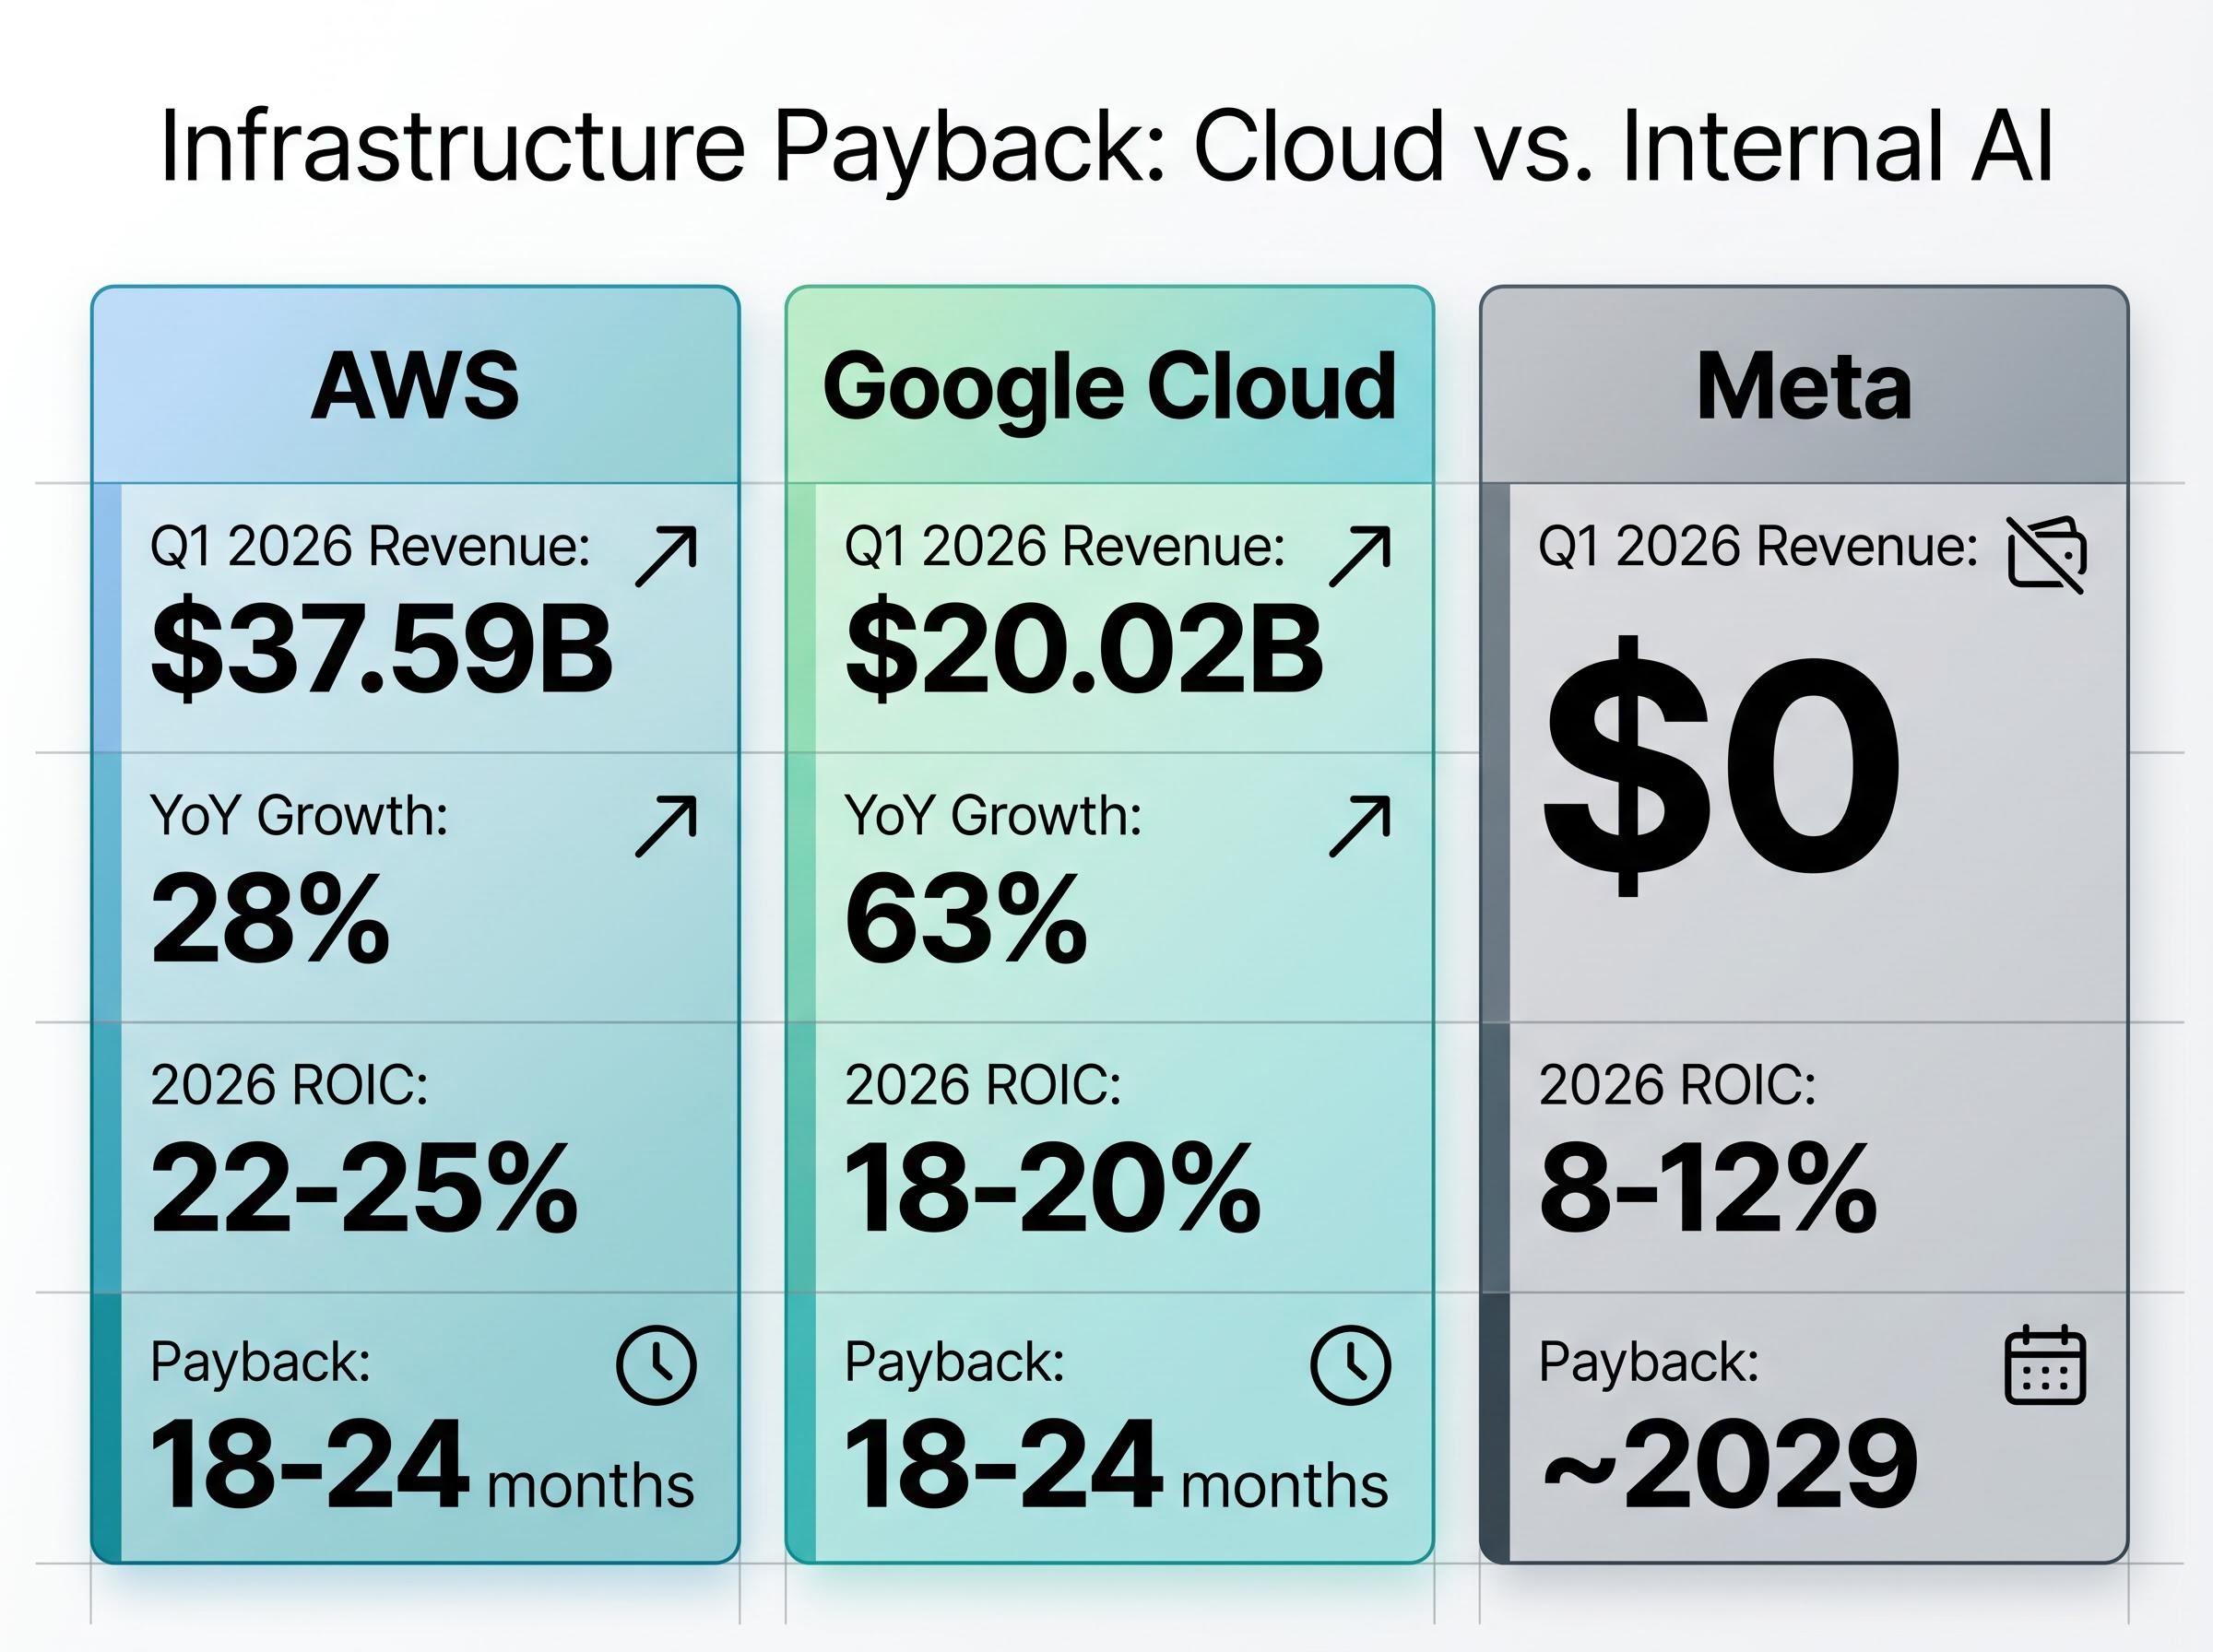
AWS generated $37.59 billion in Q1 2026 revenue, up 28% year-over-year, with operating margins near 35%. Google Cloud posted $20.02 billion, up 63% year-over-year. Both businesses sell compute capacity externally. Every dollar of infrastructure investment generates a direct, measurable revenue return.
Meta’s direct infrastructure revenue is zero. Every GPU, every data centre, every dollar of the $125-145 billion programme is deployed internally to serve Meta’s own AI models. There is no external billing layer.
| Company | Q1 2026 infra revenue | YoY growth | 2026 ROIC estimate | Payback timeline |
|---|---|---|---|---|
| AWS | $37.59B | 28% | 22-25% | 18-24 months |
| Google Cloud | $20.02B | 63% | 18-20% | 18-24 months |
| Meta | $0 | N/A | 8-12% | ~2029 |
ROIC estimates are sourced from Bank of America (4 May 2026) for Meta and JPMorgan (3 May 2026) for AWS; these represent analyst projections subject to modelling assumptions.
According to Morningstar (2 May 2026), external hyperscaler models yield two to three times faster payback compared to Meta’s internal-only path, though Meta’s advertising integration advantage could accelerate returns if its Llama models boost engagement by 10-15% by 2028.
The distinction matters for valuation. Applying a cloud-infrastructure framework to Meta produces misleading conclusions. Meta is not building a cloud business; it is building an AI capability whose returns are measured in advertising yield and platform engagement, not in compute billings.
Morningstar’s AI infrastructure ROIC analysis raises a structurally important question about GPU and server useful life assumptions, noting that planned returns depend heavily on whether hyperscale hardware depreciates on a timeline that matches the pace of AI model iteration, a risk that applies with equal force to Meta’s internal-only deployment model.
What Meta is actually buying with the capital (and whether it is working)
The risk framing of the prior sections captures one side of the ledger. The other side is already producing measurable signals. Q1 2026 data reveals three distinct AI monetisation channels generating returns:
- AI-powered ad creative tools: More than 8 million advertisers used at least one generative AI tool during the quarter. AI-generated video ad campaigns delivered conversion rates approximately 3% higher than non-AI counterparts.
- Merchant optimisation: AI-driven merchant revenue reached an annualised run rate of approximately $20 billion. The e-commerce partnership segment hit approximately $10 billion, more than doubling year-over-year.
- Hardware and platform integration: Meta AI glasses daily active users grew approximately 3x year-over-year. Ad impression volume rose 19% in Q1, while average price per impression increased approximately 12%.
Platform reach as the differentiating variable
Meta’s distribution base of more than three billion users is the structural reason its internal AI deployment can plausibly generate returns without external compute sales. A standalone cloud provider building equivalent infrastructure would need to find external buyers for that capacity. Meta already has the demand layer.
U.S. and Canada Facebook video watch time grew approximately 9% in Q1 2026, suggesting the AI-driven content recommendation engine is producing engagement gains that translate into ad inventory expansion.
Morningstar flags advertising integration as a potential accelerant: if Llama models boost engagement 10-15% by 2028, the payback calculus shifts materially. These are the observable proxies investors should track to assess whether the capital programme is producing commercial outcomes at the scale required.
Framing the return scenarios with the numbers analysts are using
At approximately $610 per share and a market capitalisation near $1.5 trillion, Meta trades at roughly 16 times earnings for its family of apps segment alone, excluding Reality Labs. That multiple provides the starting point for scenario analysis.
Hyperscaler capital commitments across Amazon, Microsoft, Alphabet, and Meta reached $130 billion in Q1 2026 alone, placing Meta’s own programme within a sector-wide build that is tracking toward a $1 trillion annual run rate by 2027 and raising structural questions about debt-funded infrastructure sustainability across the entire group.
| Scenario | Revenue growth assumption | Multiple assumption | Projected 5-year return |
|---|---|---|---|
| Conservative | ~8% annual | 15x forward (margin compression) | ~7% annually |
| Base | Mid-teens | 20x forward | ~100% cumulative |
| Optimistic | High-teens | 25x forward | ~300% cumulative |
JPMorgan’s net present value framework captures the binary nature of the bet most starkly: the $125-145 billion CapEx programme could generate $300 billion in value if a 10% advertising lift materialises, or alternatively destroy approximately $50 billion if AI fails to monetise at scale.
The FactSet consensus price target sits at approximately $855, implying roughly 40% upside. Goldman Sachs lowered its target to $830 from $840 on 30 April 2026, citing free cash flow dilution. Bill Ackman allocated approximately 10% of his fund to Meta shares, publicly characterising the valuation as very inexpensive. ARK Invest increased its position by approximately 3.5%, and T. Rowe Price added Meta as a new top holding in Q1 2026 13F filings.
Approximately 60% of analysts characterise the CapEx escalation as a necessary gamble. The remaining debate centres on whether the risk-adjusted return justifies holding through the investment period.
The litigation overhang that the CapEx conversation is overshadowing
Three active legal proceedings define Meta’s current litigation exposure:
- March 2026 jury verdict: A $375 million award related to child safety claims, reported by Reuters on 24 March 2026
- New Mexico Attorney General suit: A February 2026 ruling denied Meta’s motion to dismiss; trial is set for Q4 2026
- FTC antitrust appeal: Filed 20 January 2026, challenging a prior ruling in Meta’s monopolisation case
Analyst consensus had previously estimated total litigation exposure at $2-5 billion. The jury verdict and ongoing proceedings introduce upward pressure on that range. Some observers have drawn comparisons to tobacco-industry litigation trajectories; while speculative, these comparisons define the tail risk and represent the scenario where exposure could reach $50 billion according to severe-case estimates in analyst frameworks.
Goldman Sachs (30 April 2026) characterised the exposure as manageable relative to the $125-145 billion CapEx programme. The implicit framing: even a significant litigation outcome would be small relative to the infrastructure bet.
Meta management acknowledged during the Q1 2026 earnings call that litigation could have a material impact on the company’s financial statements.
The structural risk extends beyond direct financial costs. Algorithmic changes or onboarding restrictions imposed by court outcomes could affect the engagement metrics that underpin advertising revenue, creating a secondary channel of impact that scenario models rarely capture.
The infrastructure bet resolves in one of two directions, and the current price reflects neither cleanly
Meta’s operating margins exceeded 40% in Q1 2026 despite elevated investment. The revenue base has grown from approximately $85 billion to approximately $200 billion in recent years. These are not the financial characteristics of a company in distress.
The core investor question is whether internal AI infrastructure will generate sufficient return through advertising yield and platform engagement to justify both the capital cost and the opportunity cost of not returning that cash to shareholders. The 2022 family of apps revenue decline of approximately 1% remains a reminder that the advertising business carries its own cyclical risk, independent of the AI thesis.
Three forward-looking metrics will resolve the thesis over the next 12-24 months:
- AI-driven ad revenue acceleration: Whether the conversion rate improvements and merchant revenue gains scale beyond their current trajectory
- Free cash flow recovery: Whether 2027 FCF begins recovering toward pre-escalation estimates as infrastructure spending plateaus
- Litigation exposure evolution: Whether the Q4 2026 New Mexico trial and FTC appeal widen or contain the financial and structural risk
Short interest has risen to approximately 1.8% of float (from 1.2%), with roughly $12 billion now shorted. The FactSet consensus target of approximately $855 implies roughly 40% upside. At $610, the stock is priced for meaningful AI upside being realised, but not for the full optimistic scenario. The margin of safety exists primarily in the 16x family of apps multiple, not in the CapEx assumption.
Investors exploring which parts of the supply chain benefit from the infrastructure buildout regardless of which hyperscaler wins the AI monetisation race will find our deep-dive into AI capex and semiconductor valuations, which maps how $650 billion in annual hardware spend flows across GPU manufacturers, memory suppliers, and power semiconductors with historical data on valuation re-ratings during prior capex cycles.
This article is for informational purposes only and should not be considered financial advice. Investors should conduct their own research and consult with financial professionals before making investment decisions. Financial projections referenced are subject to market conditions and various risk factors. Forward-looking analyst estimates and scenario models are speculative and subject to change based on market developments and company performance.