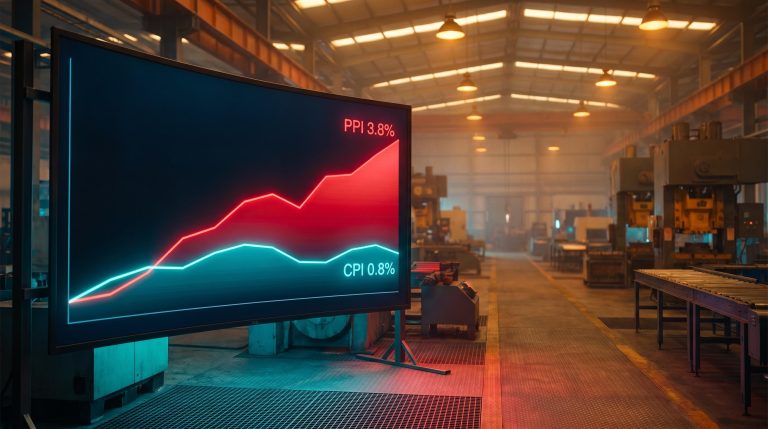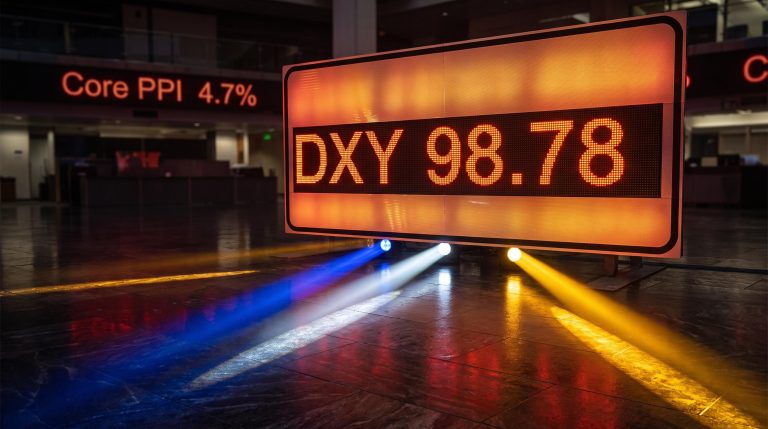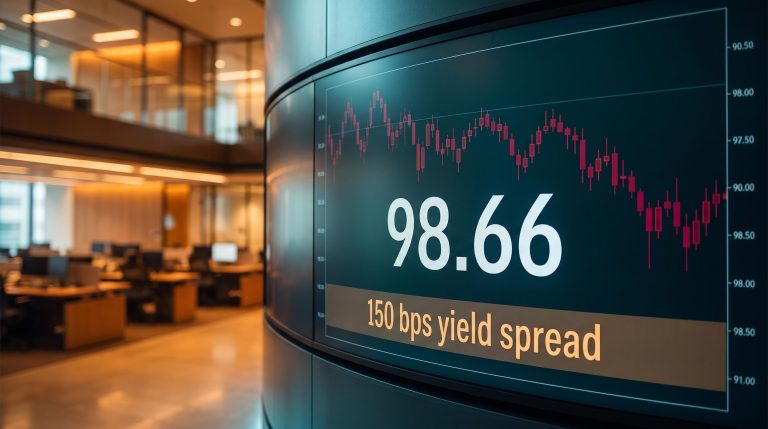
Something rare happened this year. In the space of a few months, long-term government bond yields in the United States, the United Kingdom, Germany, and Japan all climbed to levels not seen in multiple decades, and they did it at the same time.
This is not four separate national stories that happened to coincide. It is one repricing, and it is landing while governments still carry the debt they piled on after the pandemic, while central banks have stepped back from their old role as reliable bond buyers, and while inflation has refused to settle cleanly back to target.
The result is that borrowing over the long horizon has become materially more expensive, and that cost is now showing up in mortgage payments, corporate investment plans, and the arithmetic of national budgets. Understanding long-term interest rates in 2026 means understanding all three at once.
This piece maps the forces behind the surge, the real-world costs already landing on borrowers, and the four scenarios that will determine where rates go from here.
A once-in-a-generation moment: long-term yields hit multi-decade highs worldwide
Start with the numbers, because the numbers are the story.
The US 30-year Treasury yield peaked at 5.311% on 17 August 2026, its highest reading since June 2007. By 7 September 2026, it sat at 5.249%, still parked at a level that predates the financial crisis.
Across the Atlantic, the UK 30-year Gilt reached 5.822% on 15 May 2026 during a sell-off driven by domestic political worries and global inflation fears. That was its highest point since 1998.
Germany, long the anchor of European fixed income, saw its 10-year Bund yield hit 3.378% on 2 September 2026, a level last seen around April 2011. And Japan, the market that spent three decades near zero, watched its 10-year government bond yield push past 3% for the first time since 1996, reaching 3.016% on the same day.
| Country | Instrument | Yield level | Date of peak | Last seen at this level |
|---|---|---|---|---|
| United States | 30-year Treasury | 5.311% | 17 August 2026 | June 2007 |
| United Kingdom | 30-year Gilt | 5.822% | 15 May 2026 | 1998 |
| Germany | 10-year Bund | 3.378% | 2 September 2026 | April 2011 |
| Japan | 10-year JGB | 3.016% | 2 September 2026 | 1996 |
The Japanese move deserves particular attention. A 10-year yield above 3% is unremarkable in most countries; in Japan, it marks the end of an era that shaped global capital flows for a generation.
The context for all of this came from the Federal Reserve itself.
Speaking at the Jackson Hole Economic Policy Symposium on 28 August 2026, Fed Chair Kevin Warsh said the 12-month change in the PCE price index stood at 3.7%, with the six-month change running at 4.1%. Both sit well above the Fed’s 2% target, and Warsh warned that policymakers “have work to do.”
Warsh’s Jackson Hole remarks place the Fed’s position in direct conflict with any near-term pivot narrative: with six-month PCE running at 4.1%, the speech signals that restrictive policy remains the baseline, not a transitional stance awaiting one favourable data release.
These are not abstract data points. The last time borrowing costs sat at these levels, the financial architecture of the world economy looked fundamentally different. What the numbers are telling you is that this repricing has structural roots, not merely cyclical ones.
When big ASX news breaks, our subscribers know first
What is actually driving this: structural forces, not just a bad inflation print
The obvious explanation is inflation. It is also incomplete.
Analysts broadly split the drivers into two camps, and the honest reading is that both are operating at once:
- Cyclical drivers: persistent inflation, fiscal stimulus in an economy that arguably did not need it, energy price shocks from conflict, and heavy corporate bond issuance to fund artificial intelligence capital programmes that is competing with government debt for investor cash.
- Structural drivers: shrinking central bank balance sheets through quantitative tightening, a repricing of term premia, and a genuine weakening in foreign demand for government paper.
Term premium is worth defining here. It is the extra yield investors demand to hold a long-dated bond rather than rolling over short-term ones, compensation for the risk of locking money away for years. When that premium rises, long yields climb even if expectations for short rates stay flat.
The inverse relationship at the centre of bond yield mechanics, where a lower purchase price automatically produces a higher yield because the coupon is fixed, is what makes a simultaneous global repricing so self-reinforcing: as prices fall across markets, every seller who exits at a loss creates a higher required return for the next buyer.
The camp that explains what makes 2026 different is the structural one. Bruegel argues the main force is precisely this repricing of term premia as price-insensitive buyers step back. Bancara describes global sovereign markets entering a “new regime” driven by fiscal supply.
The key idea underneath both is the disappearance of the guaranteed buyer. For years, central banks absorbed government debt regardless of price, holding it to manage policy rather than to earn a return. That role has now been handed to private investors, who are price-sensitive by definition and demand real compensation for taking on the risk.
That is the shift that does not reverse on one soft inflation print. When the marginal buyer of government debt requires genuine economic return, a single good CPI reading does not restore the old dynamic. If you use only the inflation lens, you will keep expecting a reversal that the structure of demand no longer supports.
The foreign demand question: what Japan’s domestic yield shift means for the rest of the world
Japan sits at the centre of this shift. As domestic Japanese yields climbed toward 3%, the relative appeal of US Treasuries narrowed for Japanese investors, especially once the cost of hedging currency exposure is included.
The flow data shows the effect. Japanese holdings of US Treasuries fell from $1.239 trillion in February 2026 to $1.116 trillion by June 2026, a reduction of roughly $120 billion. Overall foreign private-sector net purchases of US Treasuries dropped to just $16.6 billion in June 2026, the weakest monthly figure since January.
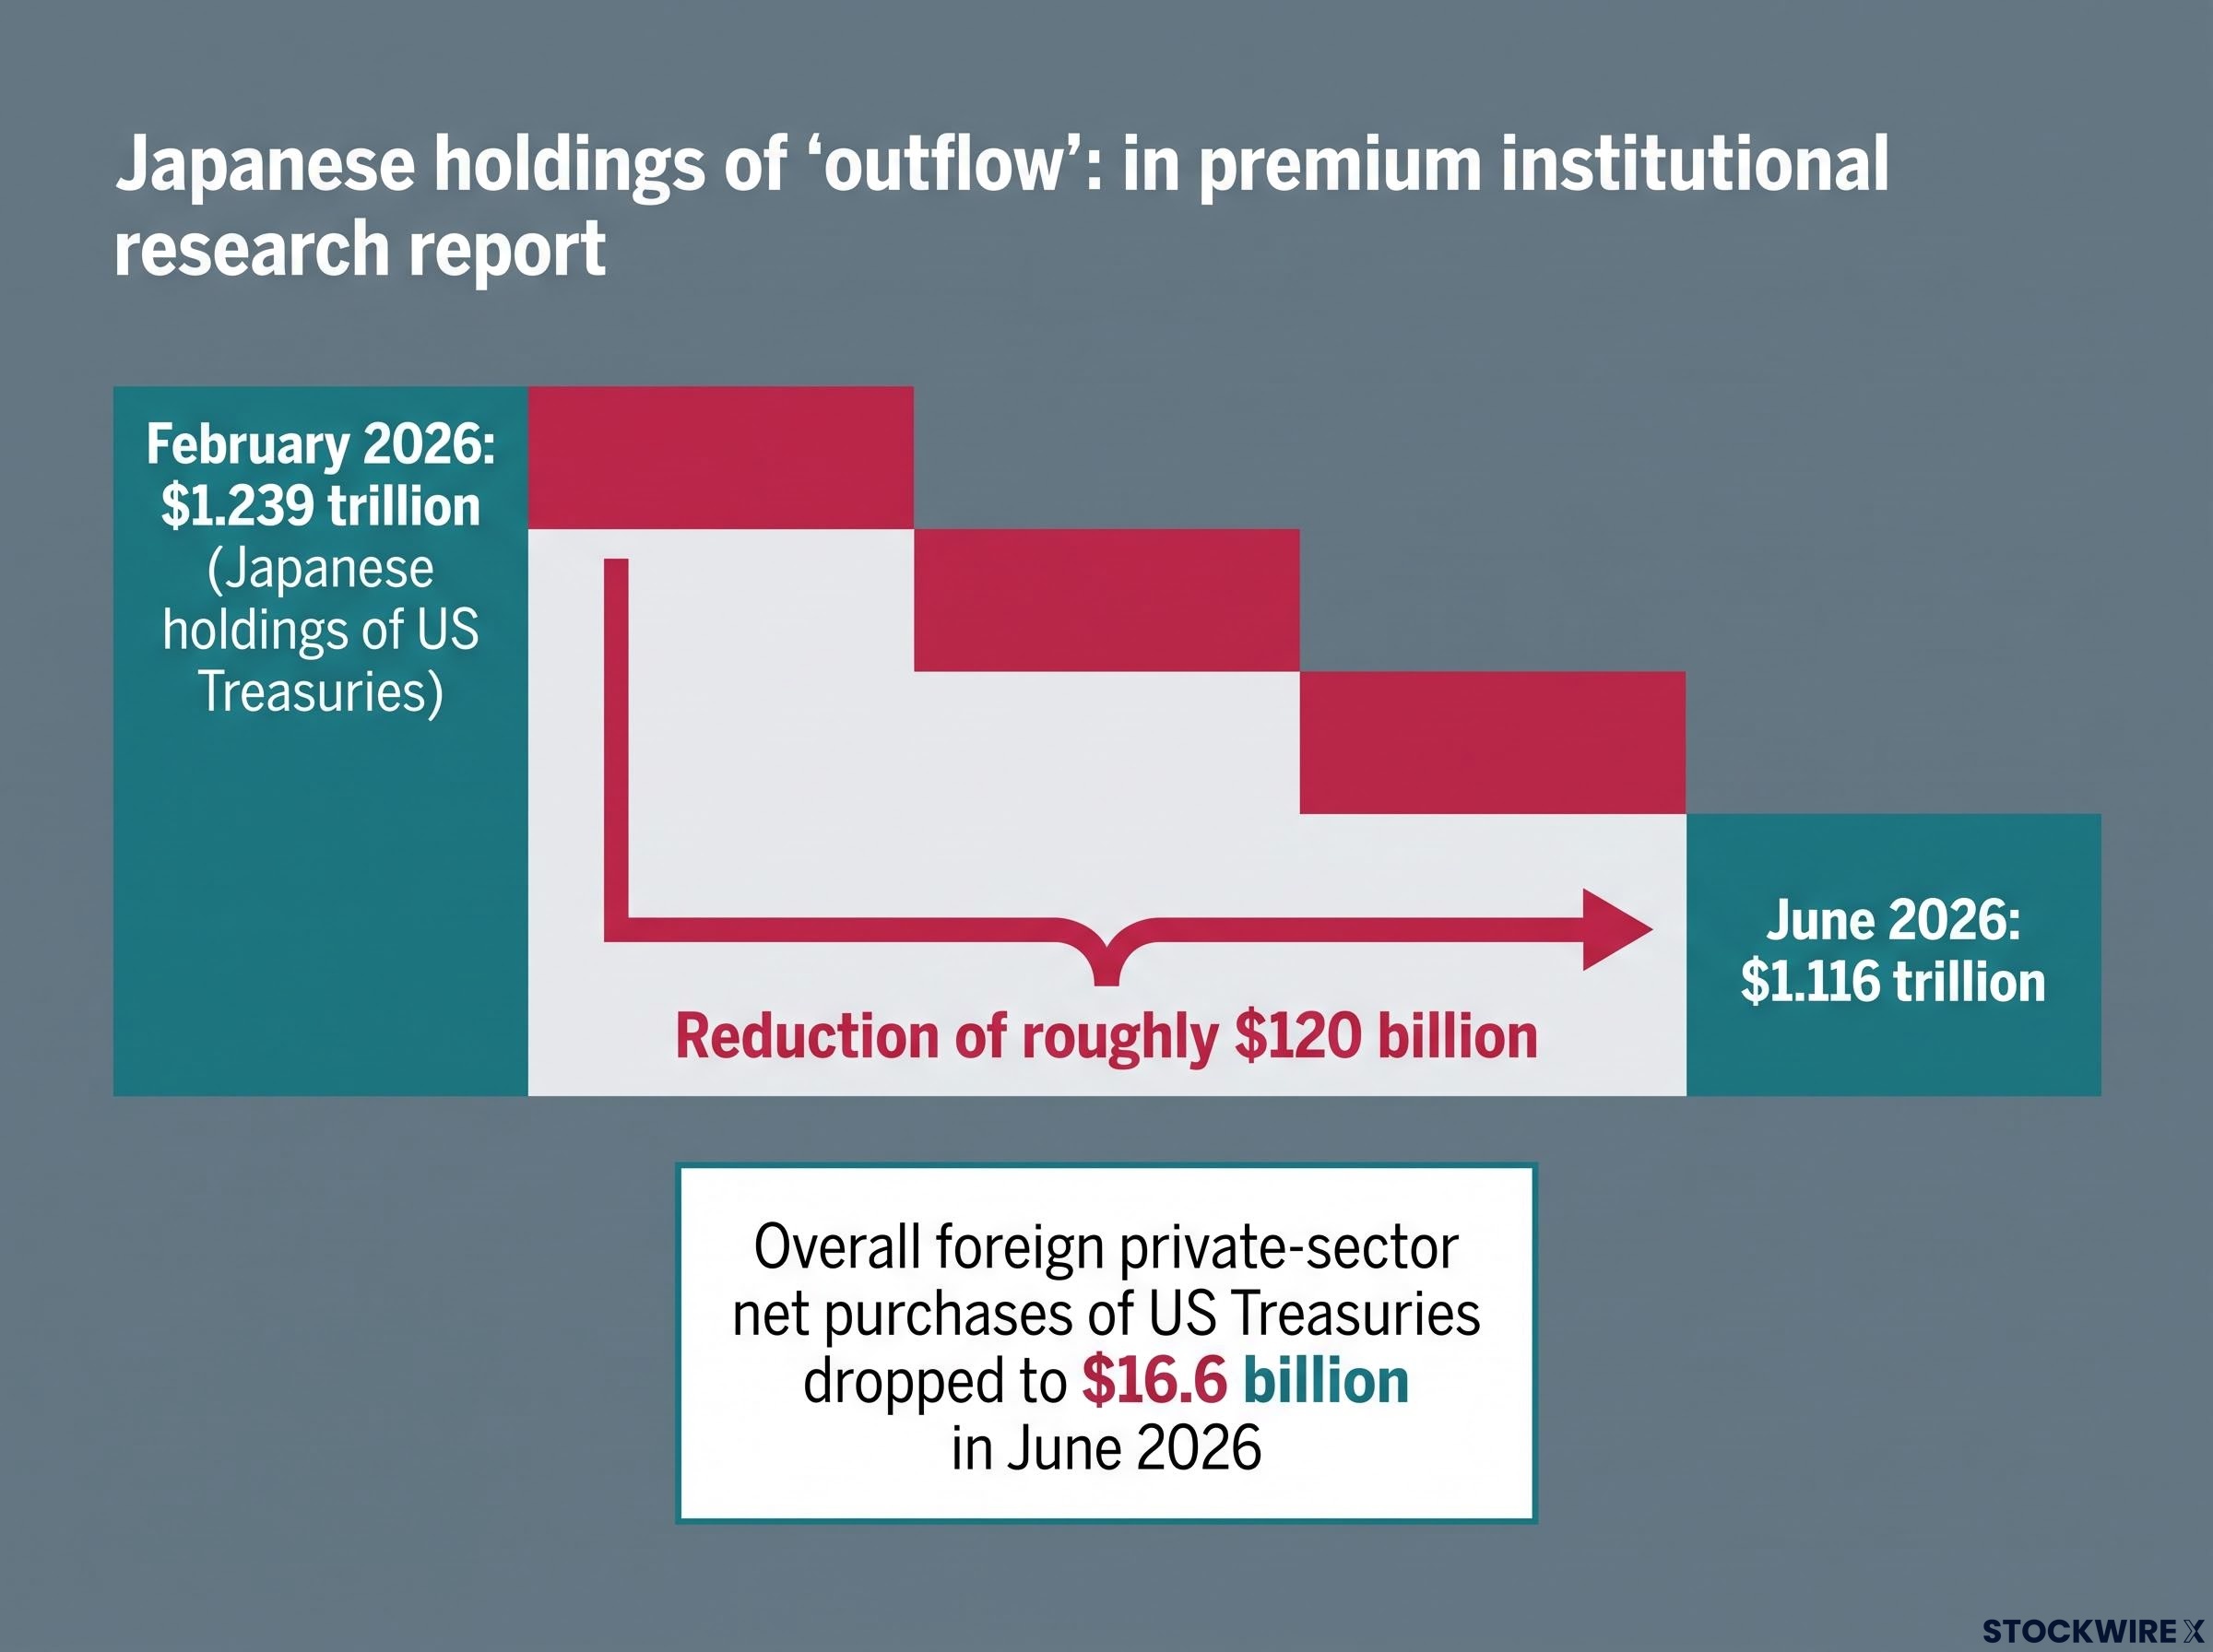
The point is not that Japan is about to abandon Treasuries; it remains one of the largest foreign holders. The question that matters for global yields is whether its marginal demand has structurally declined. If it has, one of the steadiest sources of buying power for US debt is quietly weakening, and that leaves higher yields to attract whoever fills the gap.
Treasury buyer composition has shifted materially: foreign reserve managers have plateaued at roughly 33% of outstanding US debt while domestic commercial banks have stepped in as the primary marginal buyer, reaching a record $4.8 trillion in holdings, a rotation that makes the term premium story structural rather than cyclical.
The real-world cost: who is already paying more, and by how much
Yields are abstract until they arrive in a payment. Then they are very concrete.
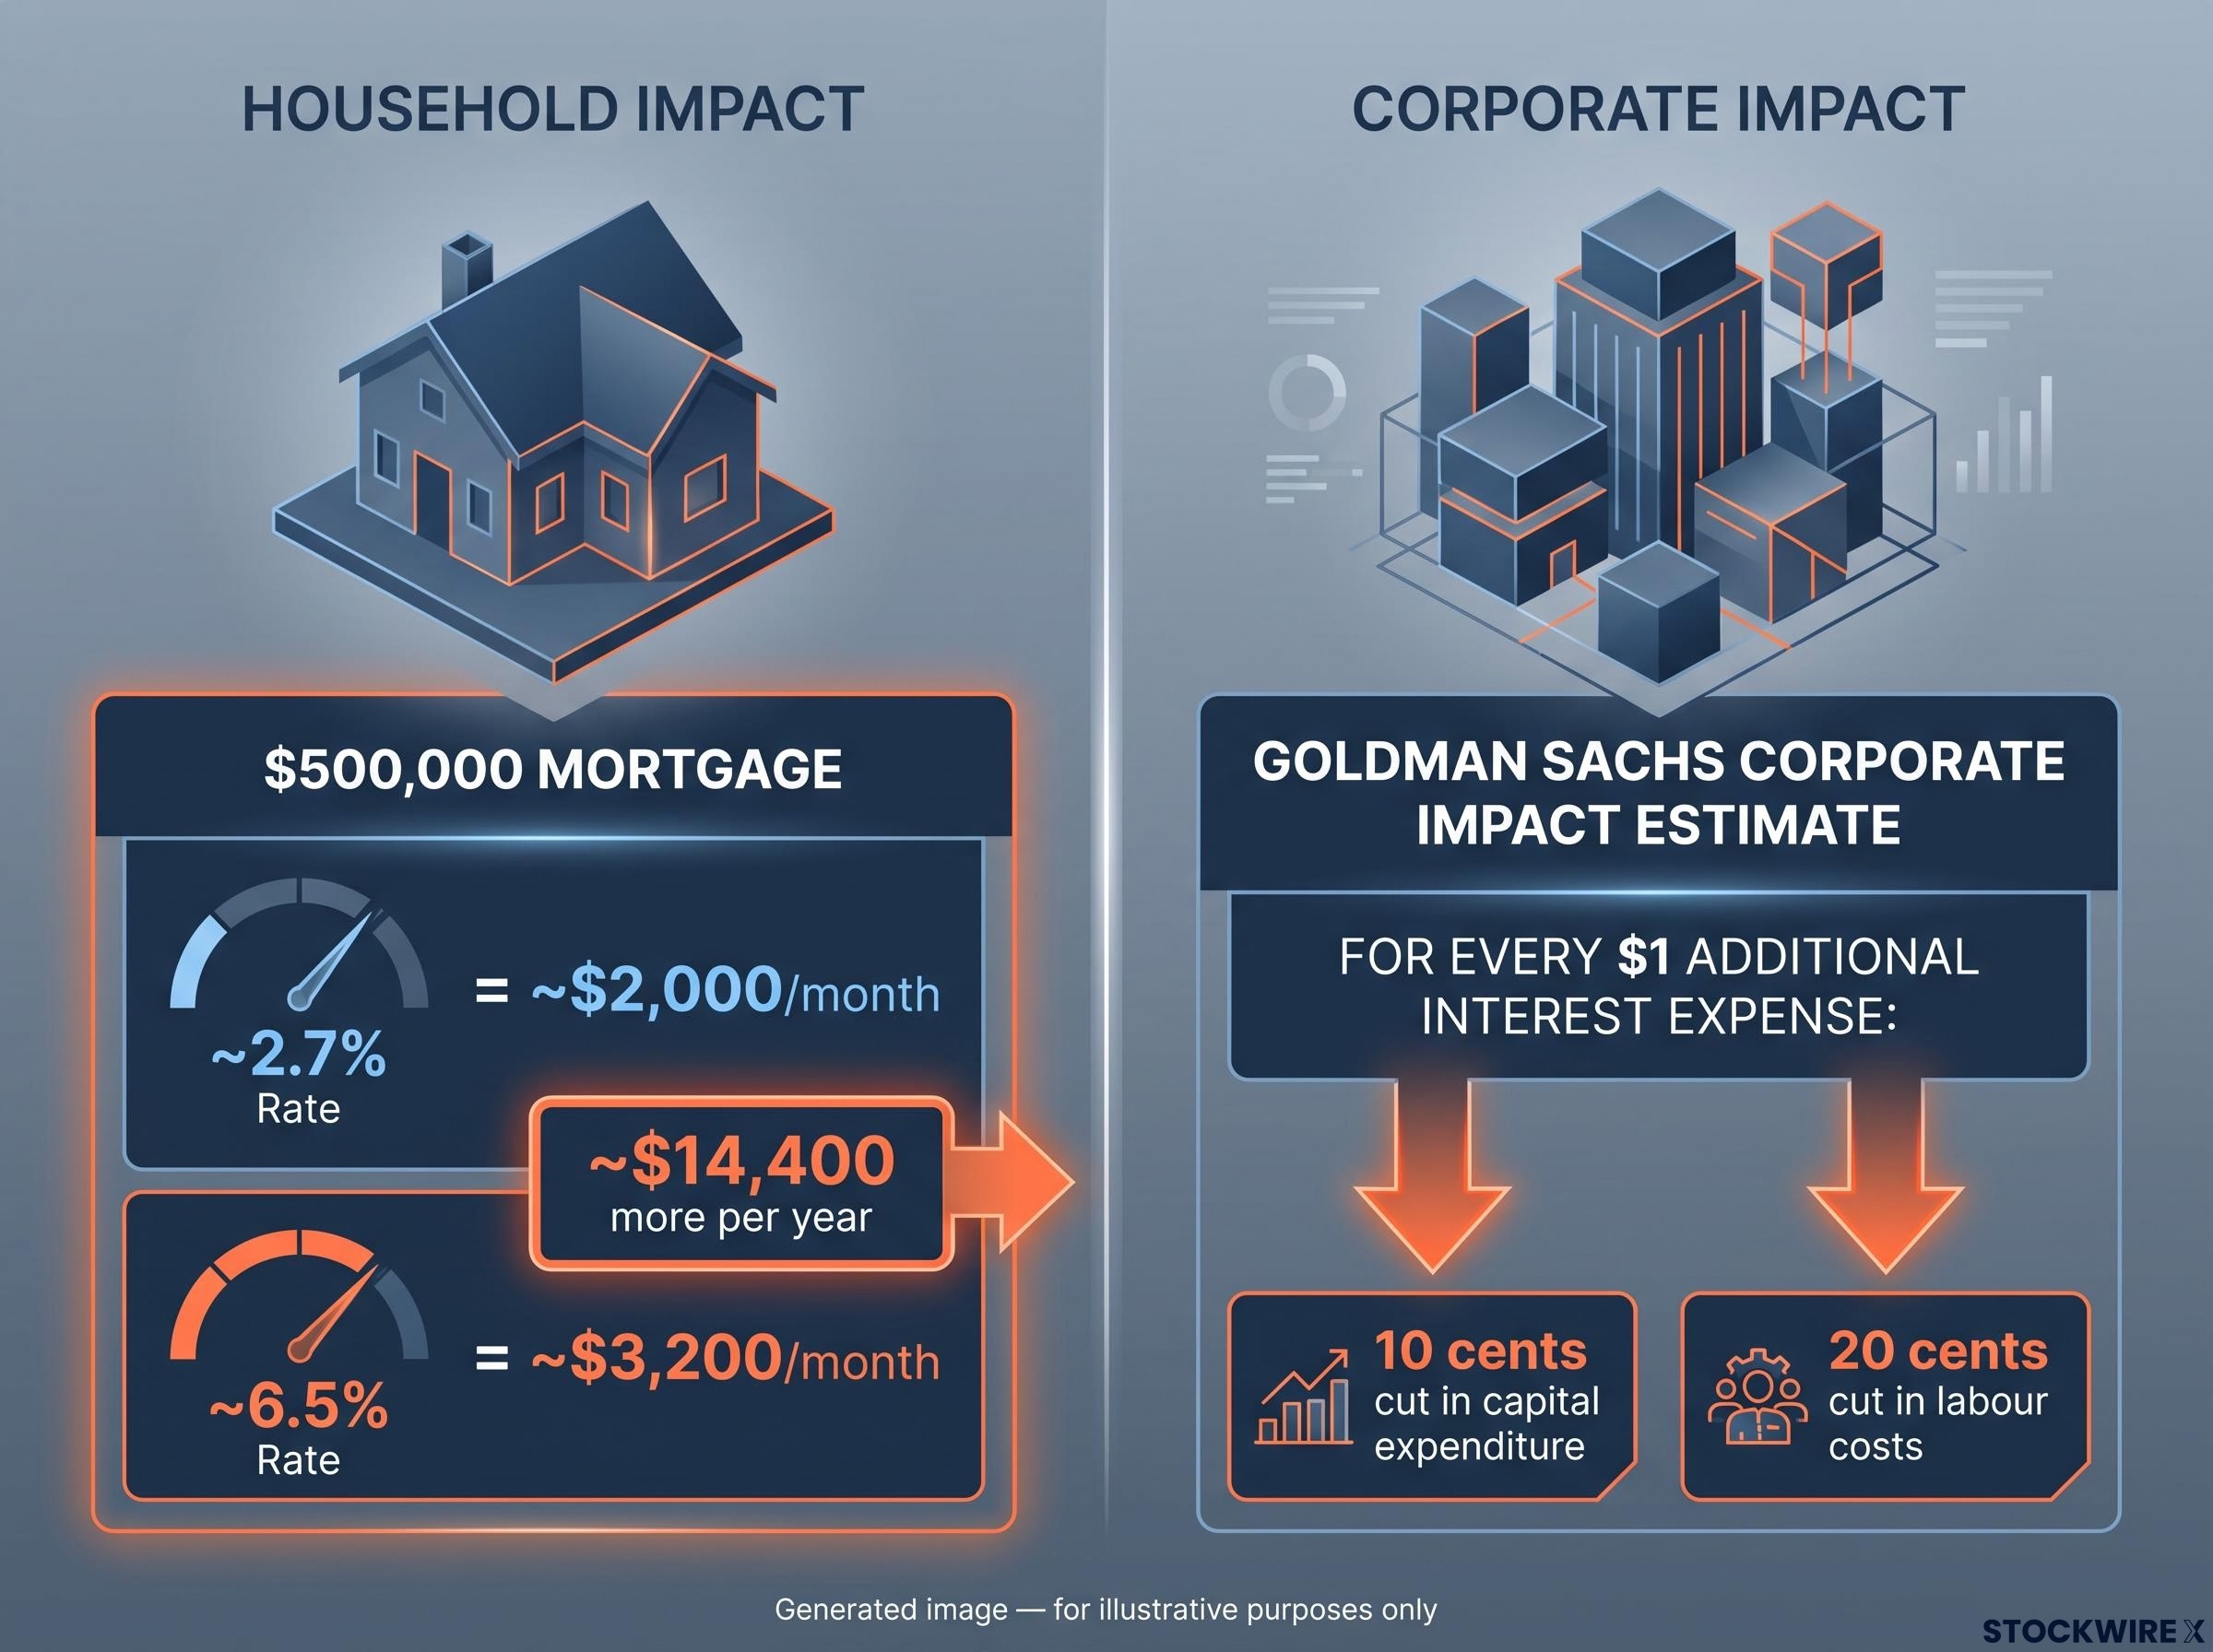
Consider a $500,000 mortgage. At the roughly 2.7% rates available a few years ago, the monthly payment sat near $2,000. At rates closer to 6.5%, that same loan costs about $3,200 a month.
| Loan amount | Rate scenario | Monthly payment | Annual cost difference |
|---|---|---|---|
| $500,000 | Approx. 2.7% | ~$2,000 | Baseline |
| $500,000 | Approx. 6.5% | ~$3,200 | ~$14,400 more per year |
That is roughly $14,400 extra a year on a single household loan, and it explains why the Bank for International Settlements reported real residential property prices in emerging-market economies declining through 2025 as borrowing costs tightened financial conditions worldwide.
The same arithmetic applies to governments, only with more zeros.
The Committee for a Responsible Federal Budget estimates that if the 10-year US Treasury yield permanently hovers around 4.4%, interest costs will add roughly $1.8 trillion to US federal debt over the next decade. By 2035, federal interest costs would exceed $2.1 trillion, approaching 5% of GDP.
For a government already carrying a heavy debt load, that dynamic makes stabilising the debt ratio harder, because more of every dollar raised goes to servicing what is already owed.
The corporate channel is where the effect turns underappreciated. Even a borrower as creditworthy as Google saw its borrowing costs rise in 2026, with spreads and Treasury components each adding 0.5 to 0.75 percentage points over short periods.
Goldman Sachs estimates the average interest rate on corporate debt rising from 4.20% in 2023 to 4.50% in 2025. Crucially, the bank calculates that for each additional $1 of interest expense, firms cut capital expenditure by roughly 10 cents and labour costs by around 20 cents.
The real yield hurdle rate has risen alongside nominal yields, with the 10-year TIPS benchmark reaching 2.22%, meaning that equity and credit positions must now clear a materially higher compensation threshold before delivering positive real returns, a constraint that does not disappear even if nominal yields stabilise.
Read that last figure carefully, because it is the transmission mechanism. Higher rates are not just a cost that borrowers absorb quietly; they are the channel through which rate pressure converts into slower hiring and thinner investment across the corporate economy. That is how a bond yield becomes a job that does not get created.
Four scenarios that will determine where rates go from here
Rather than a forecast, treat what follows as a decision tree. Each scenario carries a specific signal you can watch, so you can update your own view as the data lands instead of waiting for consensus to catch up.
- Labour market weakening. The triggering condition is a cooling jobs market and rising unemployment, which would soften demand and expectations for further hikes, pulling yields lower. The IMF’s outlook ties policy rate cuts to exactly this kind of disinflation and demand softening. A dip in the 10-year Treasury yield to around 4.36% in June 2025 was linked directly to disappointing jobs data. The signal to watch: monthly payrolls and unemployment prints.
- Weak Treasury auctions. The triggering condition is insufficient end-user demand at debt sales, pushing yields higher as investors demand more compensation for absorbing fiscal risk. Analysts read low bid-to-cover ratios and “tailing,” where the auction clears above the pre-auction yield, as demand shortfalls; a 30-year bond auction bid-to-cover ratio of 2.27 has been cited by analysts as a reference point, though this figure is unconfirmed. The signal to watch: auction results, particularly at the long end.
- Additional Fed tightening. The triggering condition is persistent inflation forcing the Fed to stay restrictive. Warsh’s PCE readings of 3.7% and 4.1% reinforce that expectation. The resolution is genuinely two-sided: past cycles show short-rate hikes sometimes flattening the long end when markets read them as a growth concern, but the current inflation backdrop argues instead for the long end staying elevated. The signal to watch: Fed statements and the shape of the yield curve after each meeting.
- Sustained foreign demand retreat. The triggering condition is continued weakening in overseas buying while US issuance stays high. With Japanese domestic yields now competitive near 3%, marginal foreign buyers require higher US yields to be tempted. The signal to watch: Japanese and broader foreign net Treasury purchase data.
Not all four are equally likely. Current conditions, sticky inflation, a hawkish Fed, and softening foreign demand, tilt the near-term balance toward higher-for-longer rather than a rapid reversal.
When scenarios overlap: why the current environment is harder to read than a single-factor story
The awkward part is that these scenarios are not mutually exclusive. Right now, elements of Scenario 2 and Scenario 4 appear to be operating together: weak auction demand and retreating foreign buyers reinforce each other rather than one offsetting the other, which compounds the upward pressure.
That is why the current picture resists a clean call. The 2023 precedent for a sharp reversal, which the next section examines, required three conditions in combination: decisively improved inflation data, clearer central bank guidance, and credible fiscal consolidation. None of the three is currently in place.
What history says about episodes like this, and why this one is different
Past tightening cycles offer real reference points, provided they are treated as reference points and not templates.
- 1994-1995: the Fed raised the funds target from 3% to 6% in roughly a year. Bond investors did not panic and redeem en masse, and the episode ended without an immediate recession. The lesson: a sharp yield spike can be absorbed organically.
- 2004-2006: the Fed lifted the funds rate from 1% to 5.25%, and global 10-year sovereign yields rose 45 to 75 basis points. The curve eventually inverted, preceding the December 2007 business cycle peak. The lesson: elevated long yields can persist as a multi-year adjustment, not a brief crisis.
- Late 2023: after a term-premium-driven spike, the US 10-year yield fell more than 100 basis points by year-end. Lower-than-expected CPI and PCE data and a dovish Fed pivot did the work. The lesson: reversals happen, but only when several forces align at once.
The distinction that matters is the backdrop. Every one of those earlier episodes played out with central banks still willing and able to step in as buyers if conditions demanded it.
The 2026 episode is unfolding in the opposite direction. Quantitative tightening is in progress, central bank balance sheets are contracting, and fiscal positions have not been consolidated since the pandemic.
The bond market’s reaction, as Stanley Druckenmiller has framed it, is effectively imposing fiscal discipline on governments through yield signals. When the guaranteed buyer steps away, the market itself becomes the constraint.
The late-2023 reversal is the case worth interrogating honestly. It required improved inflation data, clearer Fed guidance, and fiscal credibility, all at once. Measured against today, the count of those three conditions currently in place is close to zero.
For readers wanting to stress-test the higher-for-longer thesis against the counterargument, our full explainer on bond yield normalisation examines whether current 5% yields represent a crisis or a return to pre-QE norms, including bid-to-cover data across four sovereign markets.
Where the weight of evidence points, and what to watch next
Pull the threads together and the picture is consistent. The structural drivers point to a market that now demands real compensation for holding government debt, the borrower data shows the cost is already landing, and the scenario framework skews toward higher-for-longer. On the current evidence, the conditions for a sustained yield reversal are not in place.
The clearest way to test that view is to watch a short list of signals:
- Inflation prints. Warsh’s PCE readings of 3.7% and 4.1% show the Fed still has work to do. A decisive, sustained move toward 2% would be the first condition of a reversal.
- Fed guidance. Watch for a genuine shift in tone from restrictive to accommodative, not a single dovish sentence.
- Fiscal trajectory. With the CRFB projecting interest costs above $2.1 trillion by 2035, any credible move toward consolidation would materially change the structural story.
- Japanese capital flows. The most underappreciated forward signal. Watch whether Japanese net Treasury purchases stabilise or keep declining from the $1.116 trillion June 2026 level.
The honest call is that the balance of risk sits with elevated rates persisting, and this view would be wrong if those four conditions began aligning together, exactly as they did in late 2023. Track the signals directly, and you will read the turn before consensus does.
This article is for informational purposes only and should not be considered financial advice. Investors should conduct their own research and consult with financial professionals before making investment decisions. Past performance does not guarantee future results, and the scenarios described are speculative and subject to change based on market developments.