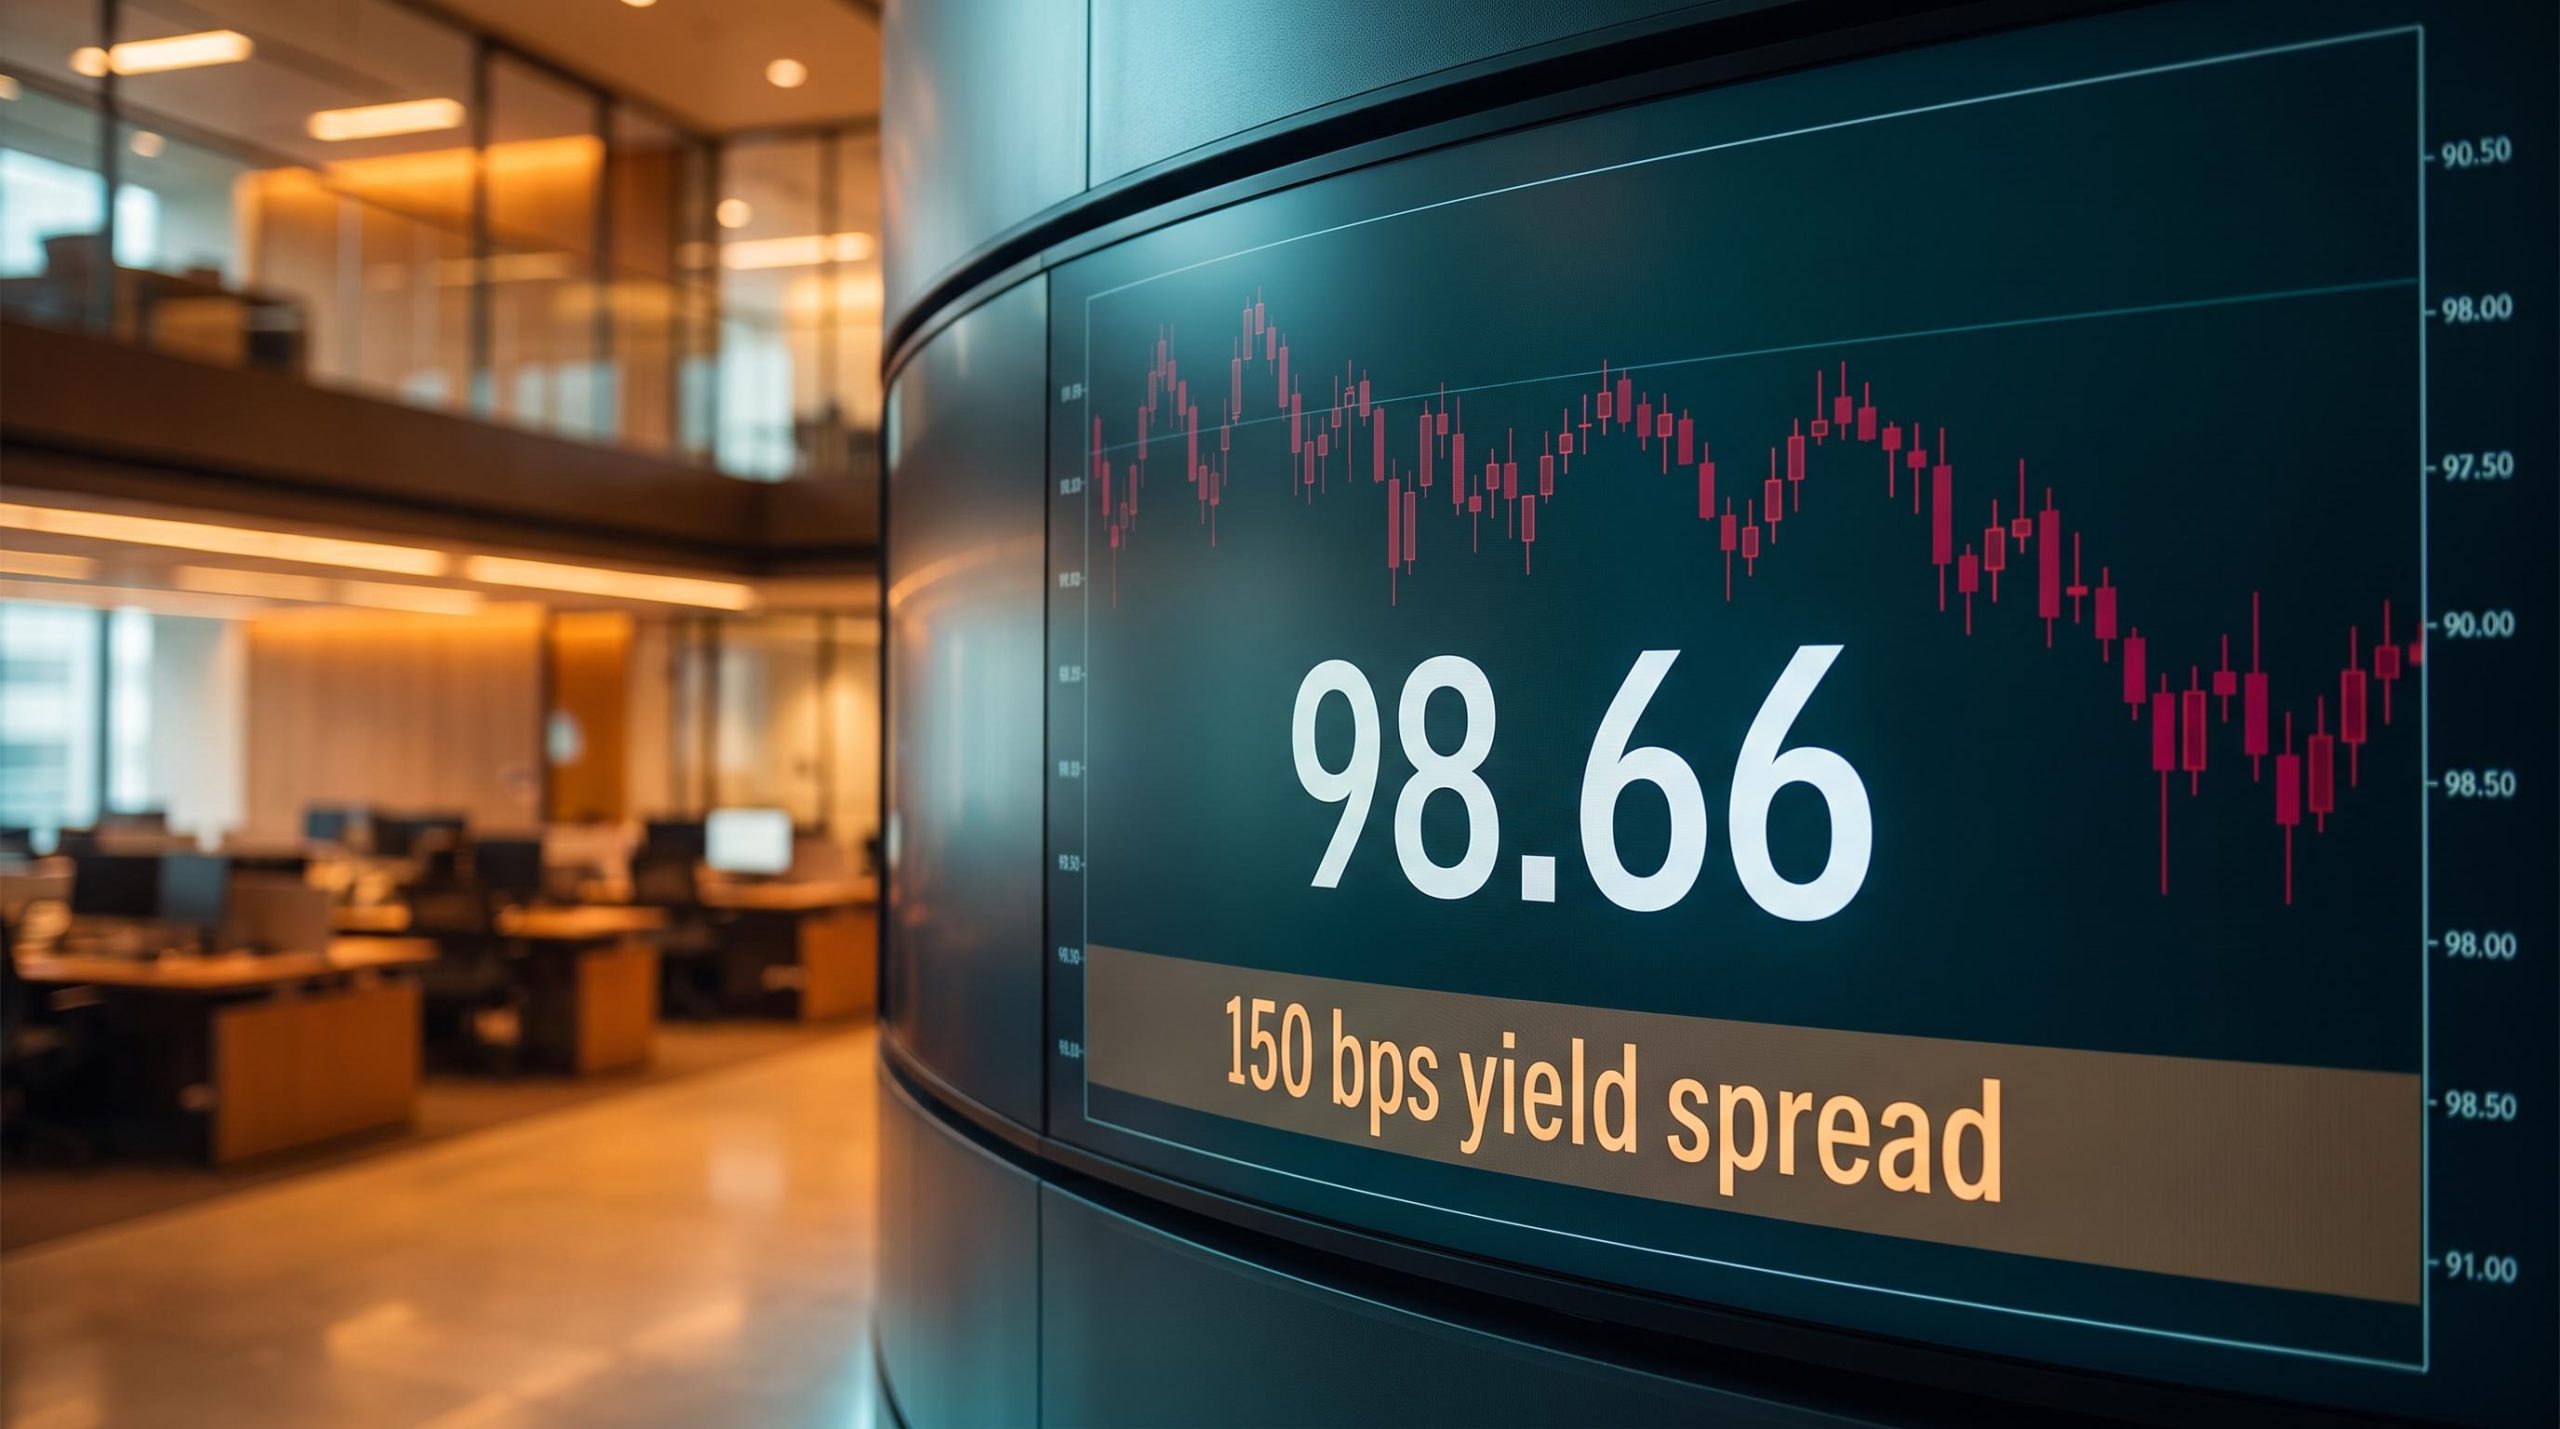
The US Dollar should be climbing. It is not. As of 9 September 2026, the US dollar index (DXY) is trading below the 99 handle, in the low-to-mid 98s, despite a market that prices a roughly 66% chance the Federal Reserve hikes rates in September, energy costs that remain elevated, and a yield advantage of around 150 basis points over the euro area.
That combination should, on any conventional reading, pull capital toward the dollar and lift it. It is not happening.
A rate hike is precisely the kind of event that is supposed to reward a currency. When the reward fails to arrive, and fails while three separate tailwinds are blowing at once, the explanation is rarely a one-off. Something more durable is overriding the usual mechanics, and that force is worth understanding if you hold dollar-denominated assets or track Fed policy at all.
This is a framework for reading the current dollar outlook: whether the weakness is a passing dislocation or the early signal of a longer shift, and which specific events in the coming weeks are most likely to settle the question either way. The next six weeks contain the catalysts that will tell you which story is true.
The dollar’s contradiction: strong fundamentals, weak price action
Start with what the textbook predicts. Three conditions are currently in place that should, in isolation or together, support a stronger dollar:
- Elevated energy costs, which historically redirect trade flows toward the US and away from Europe and Asia, typically lifting the dollar
- High short-term US interest rates, with the 2-year Treasury yield sitting around 4.36-4.37% against roughly 2.84% in the euro area, a spread of about 150 basis points in the dollar’s favour
- An anticipated Fed hike, with markets pricing close to a 66% probability of a 25 basis point move at the September FOMC meeting
Each of these is a recognised driver of currency strength. All three are present at once. And yet the DXY is sitting near 98.66-98.71, refusing to rally.
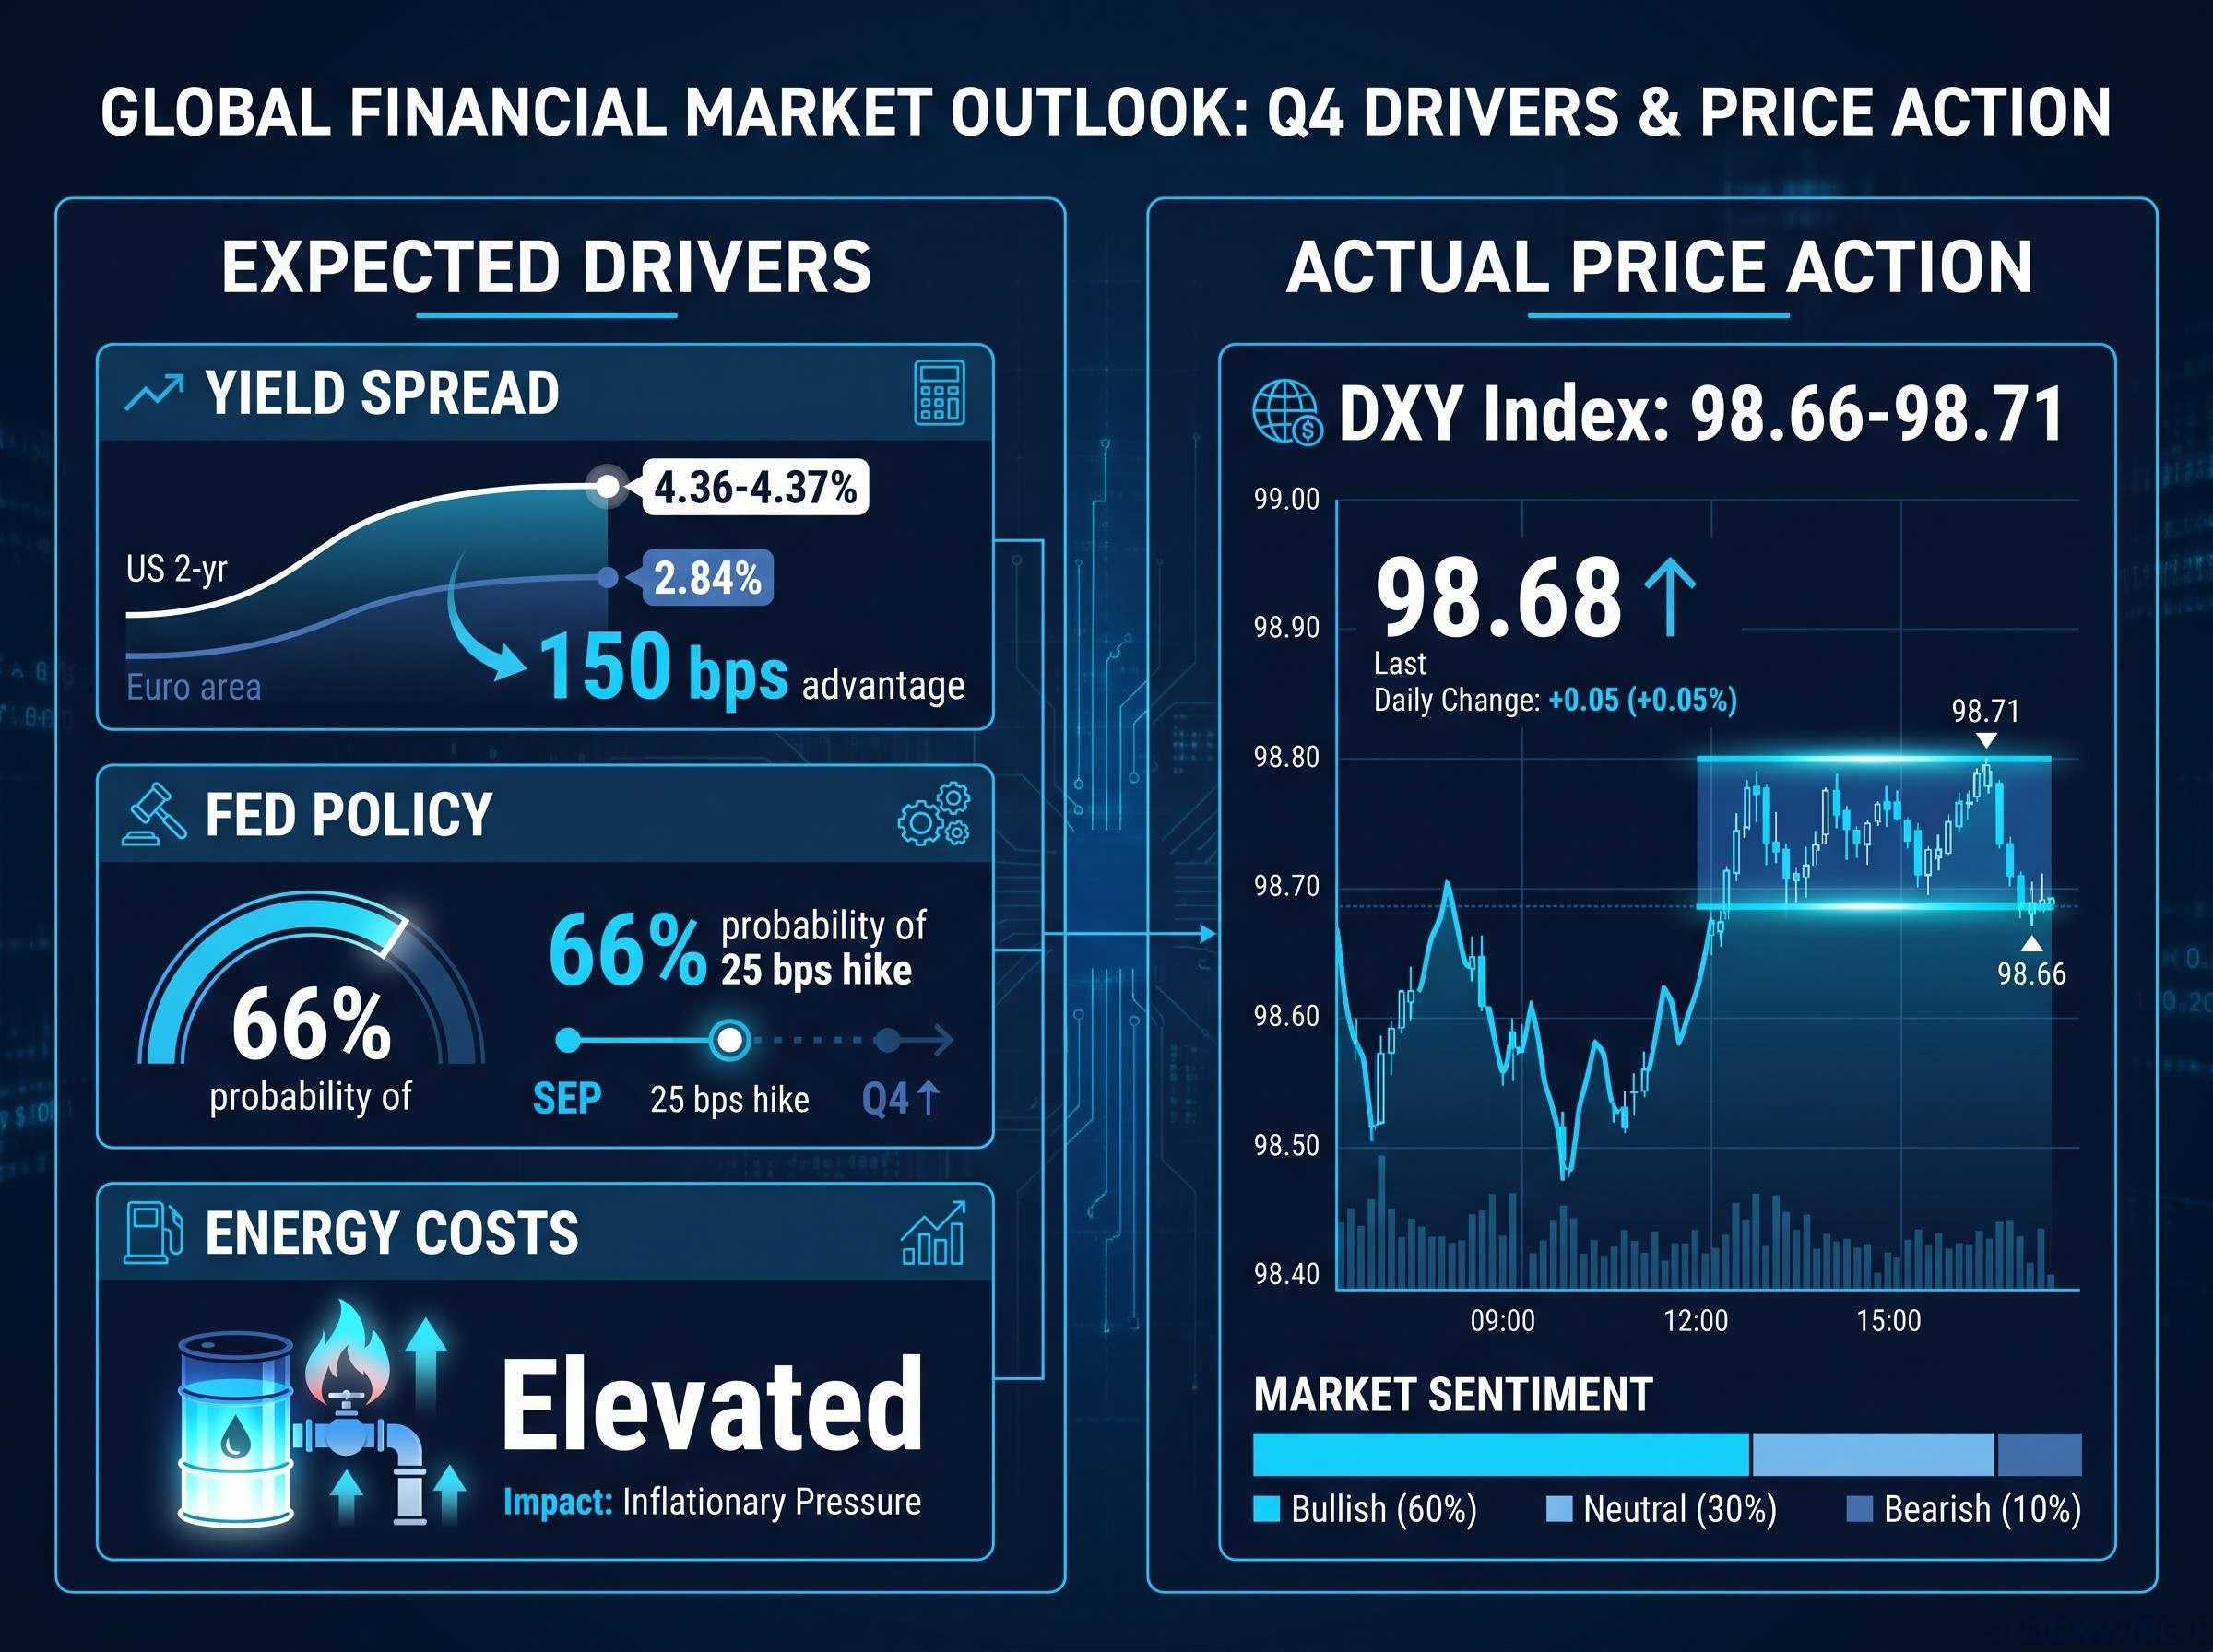
Analysts at ING note that the dollar is simply not responding to an environment that should, in theory, be working in its favour. Support in the 98.55-98.65 range is holding, but the currency is not using that floor as a launchpad. It is loitering there.
That distinction matters. A currency that holds support but declines to advance is telling a different story from one that is being actively sold off.
Here is the interpretive point for anyone tracking dollar exposure. A 150 basis point yield advantage is, in most rate-differential frameworks, more than enough to attract capital and push a currency higher. When that spread exists and the currency still will not move, the conventional mechanism is being overridden by something else.
The Federal Reserve H.15 selected interest rates release, updated daily, is the primary source for the 2-year Treasury yield readings underpinning the roughly 150 basis point spread over the euro area that forms the centrepiece of the dollar’s yield advantage.
That override is the actual subject worth investigating. The gap between what the fundamentals promise and what the price delivers is not noise to be smoothed over. Right now, it is the single most informative signal in the dollar picture, and reading it correctly is the prerequisite for interpreting everything that follows.
When big ASX news breaks, our subscribers know first
What is actually driving the dollar lower
If the yield advantage is not working, the question becomes what is working against it. Three forces are pressing down on the dollar, and they run from the highly visible to the genuinely unsettling:
- Equity and AI-driven capital flows. Global stock markets, propelled by artificial intelligence (AI) investment activity, are keeping global growth robust. There is a well-established negative correlation between buoyant global equities and dollar strength, because a confident world has less need for a safe haven.
- Term-premium and fiscal risk. Rising long-dated US yields are increasingly being read as compensation for fiscal strain rather than as attractive return.
- A conditional safe haven. The dollar’s defensive appeal now holds mainly when shocks originate outside the US, and can weaken when the shock is domestic.
Take the first force. Strategists point to heavy investment-grade bond issuance from US mega-cap tech firms, and to the behaviour of the foreign investors funding that activity. Those investors may buy US tech and US bonds, but they frequently hedge or diversify their currency exposure, which dilutes the direct support that inflow would otherwise give the dollar. The money comes in; the dollar demand does not follow it cleanly.
When fiscal risk inverts the yield-strength relationship
The second force is where the analysis gets less intuitive, and it hinges on why the yield curve is steepening.
A steepening curve driven by growth optimism is a healthy signal: investors demand more to lock up money long-term because they expect the economy to run hot. A steepening curve driven by supply and fiscal concern is the opposite. It means investors are demanding more to hold long-dated US debt because they are worried about how much of it is coming and what it says about government finances.
The US 10-year Treasury yield sits near 4.77%. Analysts at Convera, Nomura, Lloyds Bank, and Bank of America argue that yields at these levels increasingly reflect fiscal strain rather than quality return. On the supply side, the Treasury is conducting buybacks of longer-dated bonds alongside scheduled auctions of $39 billion in 10-year and $22 billion in 30-year securities. The buyback activity itself can read to currency markets as active management of a strained long end, which reinforces rather than calms the concern.
This is the read you should take from watching the 10-year and the dollar together. When long-end yields rise and the dollar still falls, the market is communicating that it views those yields as a risk premium, not an opportunity. For anyone holding dollar assets or tracking Fed policy, that distinction matters more than the yield number itself, because it changes what a rising yield actually signals.
The third force ties the first two together. The dollar’s safe-haven status is no longer automatic. It performs when the shock comes from elsewhere, but a domestic shock tied to fiscal governance or political uncertainty can weaken the dollar and US bonds at the same time. That is a very different profile from an unconditional refuge, and it is why these headwinds compound rather than cancel out.
The conditional safe-haven status of the dollar became most visible during the Strait of Hormuz escalation in August 2026, when safe-haven flows routed into gold and European currencies rather than the dollar, with EUR/USD hitting a two-month high at precisely the moment risk aversion should have rewarded the greenback.
Is this a cycle or a structural shift? What the data actually shows
Everything so far describes forces at work now. The harder question is whether those forces are cyclical, and therefore reversible, or structural, and therefore not.
The cyclical camp has the weight of consensus. ING, HSBC, J.P. Morgan, and KfW view the current weakness as driven by rate differentials, growth dynamics, and risk sentiment. Across the core metrics that would show genuine erosion, global assets, liabilities, and foreign exchange (FX) turnover, they see no broad structural deterioration in the dollar’s role since 2024. On this reading, the dollar is drifting back toward fair value, well within historical ranges, and the tailwind will reassert when the cycle turns.
The structural camp points somewhere less comfortable.
IMF COFER data shows the dollar’s share of global FX reserves falling from approximately 72% in 2001 to 57.13% in Q1 2026. Central banks have been buying gold as a diversification signal alongside that decline.
Reserve diversification trends have added an institutional dimension to the structural case: the OMFIF Global Public Investor 2026 survey recorded the first time more central banks planned to reduce rather than increase dollar allocations, a qualitative threshold the cyclical interpretation alone cannot account for.
The current episode also has precedent. High US rates have failed to deliver a strong dollar before: in 1985-87 after the Plaza Accord, in 2002-04, and in 2006-07, all periods following or during aggressive Fed tightening. More recently, the first half of 2025 ranked as the fourth-worst opening half for the dollar since 1973. History says a yield advantage does not guarantee currency strength.
| Dimension | Cyclical interpretation | Structural interpretation |
|---|---|---|
| Key evidence | Rate differentials, growth, risk sentiment; no deterioration in reserve, asset or FX-turnover metrics since 2024 | Reserve share down from 72% to 57.13%; central bank gold buying; fiscal credibility concerns |
| Institutional proponents | ING, HSBC, J.P. Morgan, KfW | Convera, Nomura, Lloyds Bank, Bank of America (fiscal-strain view) |
| Historical precedent | Return to fair value within historical ranges | 1985-87, 2002-04, 2006-07 weakness despite high rates |
| Implied resolution timeline | Reverses when rate differential reasserts | Multi-year; does not reverse on a Fed decision |
Here is the way to hold this. The reserve-share decline from 72% to 57% over 25 years is not a crisis, and the structural camp does not claim the dollar is being replaced. But the trend is directional, and if you are judging whether today’s weakness is noise or signal, that trend belongs alongside the cyclical framing, not opposed to it.
The most durable value in this whole picture sits here, for anyone thinking beyond the next quarter. Cyclical and structural forces can compound. That means the current dislocation may not fully reverse even when the rate-differential tailwind reasserts itself, because part of the weakness was never cyclical to begin with.
What could move the dollar from here: the August CPI and beyond
So what actually resolves the question in the coming weeks? The sequence starts with one release.
The August US Consumer Price Index (CPI) is the critical near-term input before the September FOMC decision. July’s reading offered a preview of how sensitive the market is: CPI rose just 0.1% month-over-month with the 12-month rate at 3.4%, tame enough to temporarily trim rate-hike odds before they repriced higher again. August will do the same work, only with the Fed meeting immediately behind it.
From there, three forward scenarios open up:
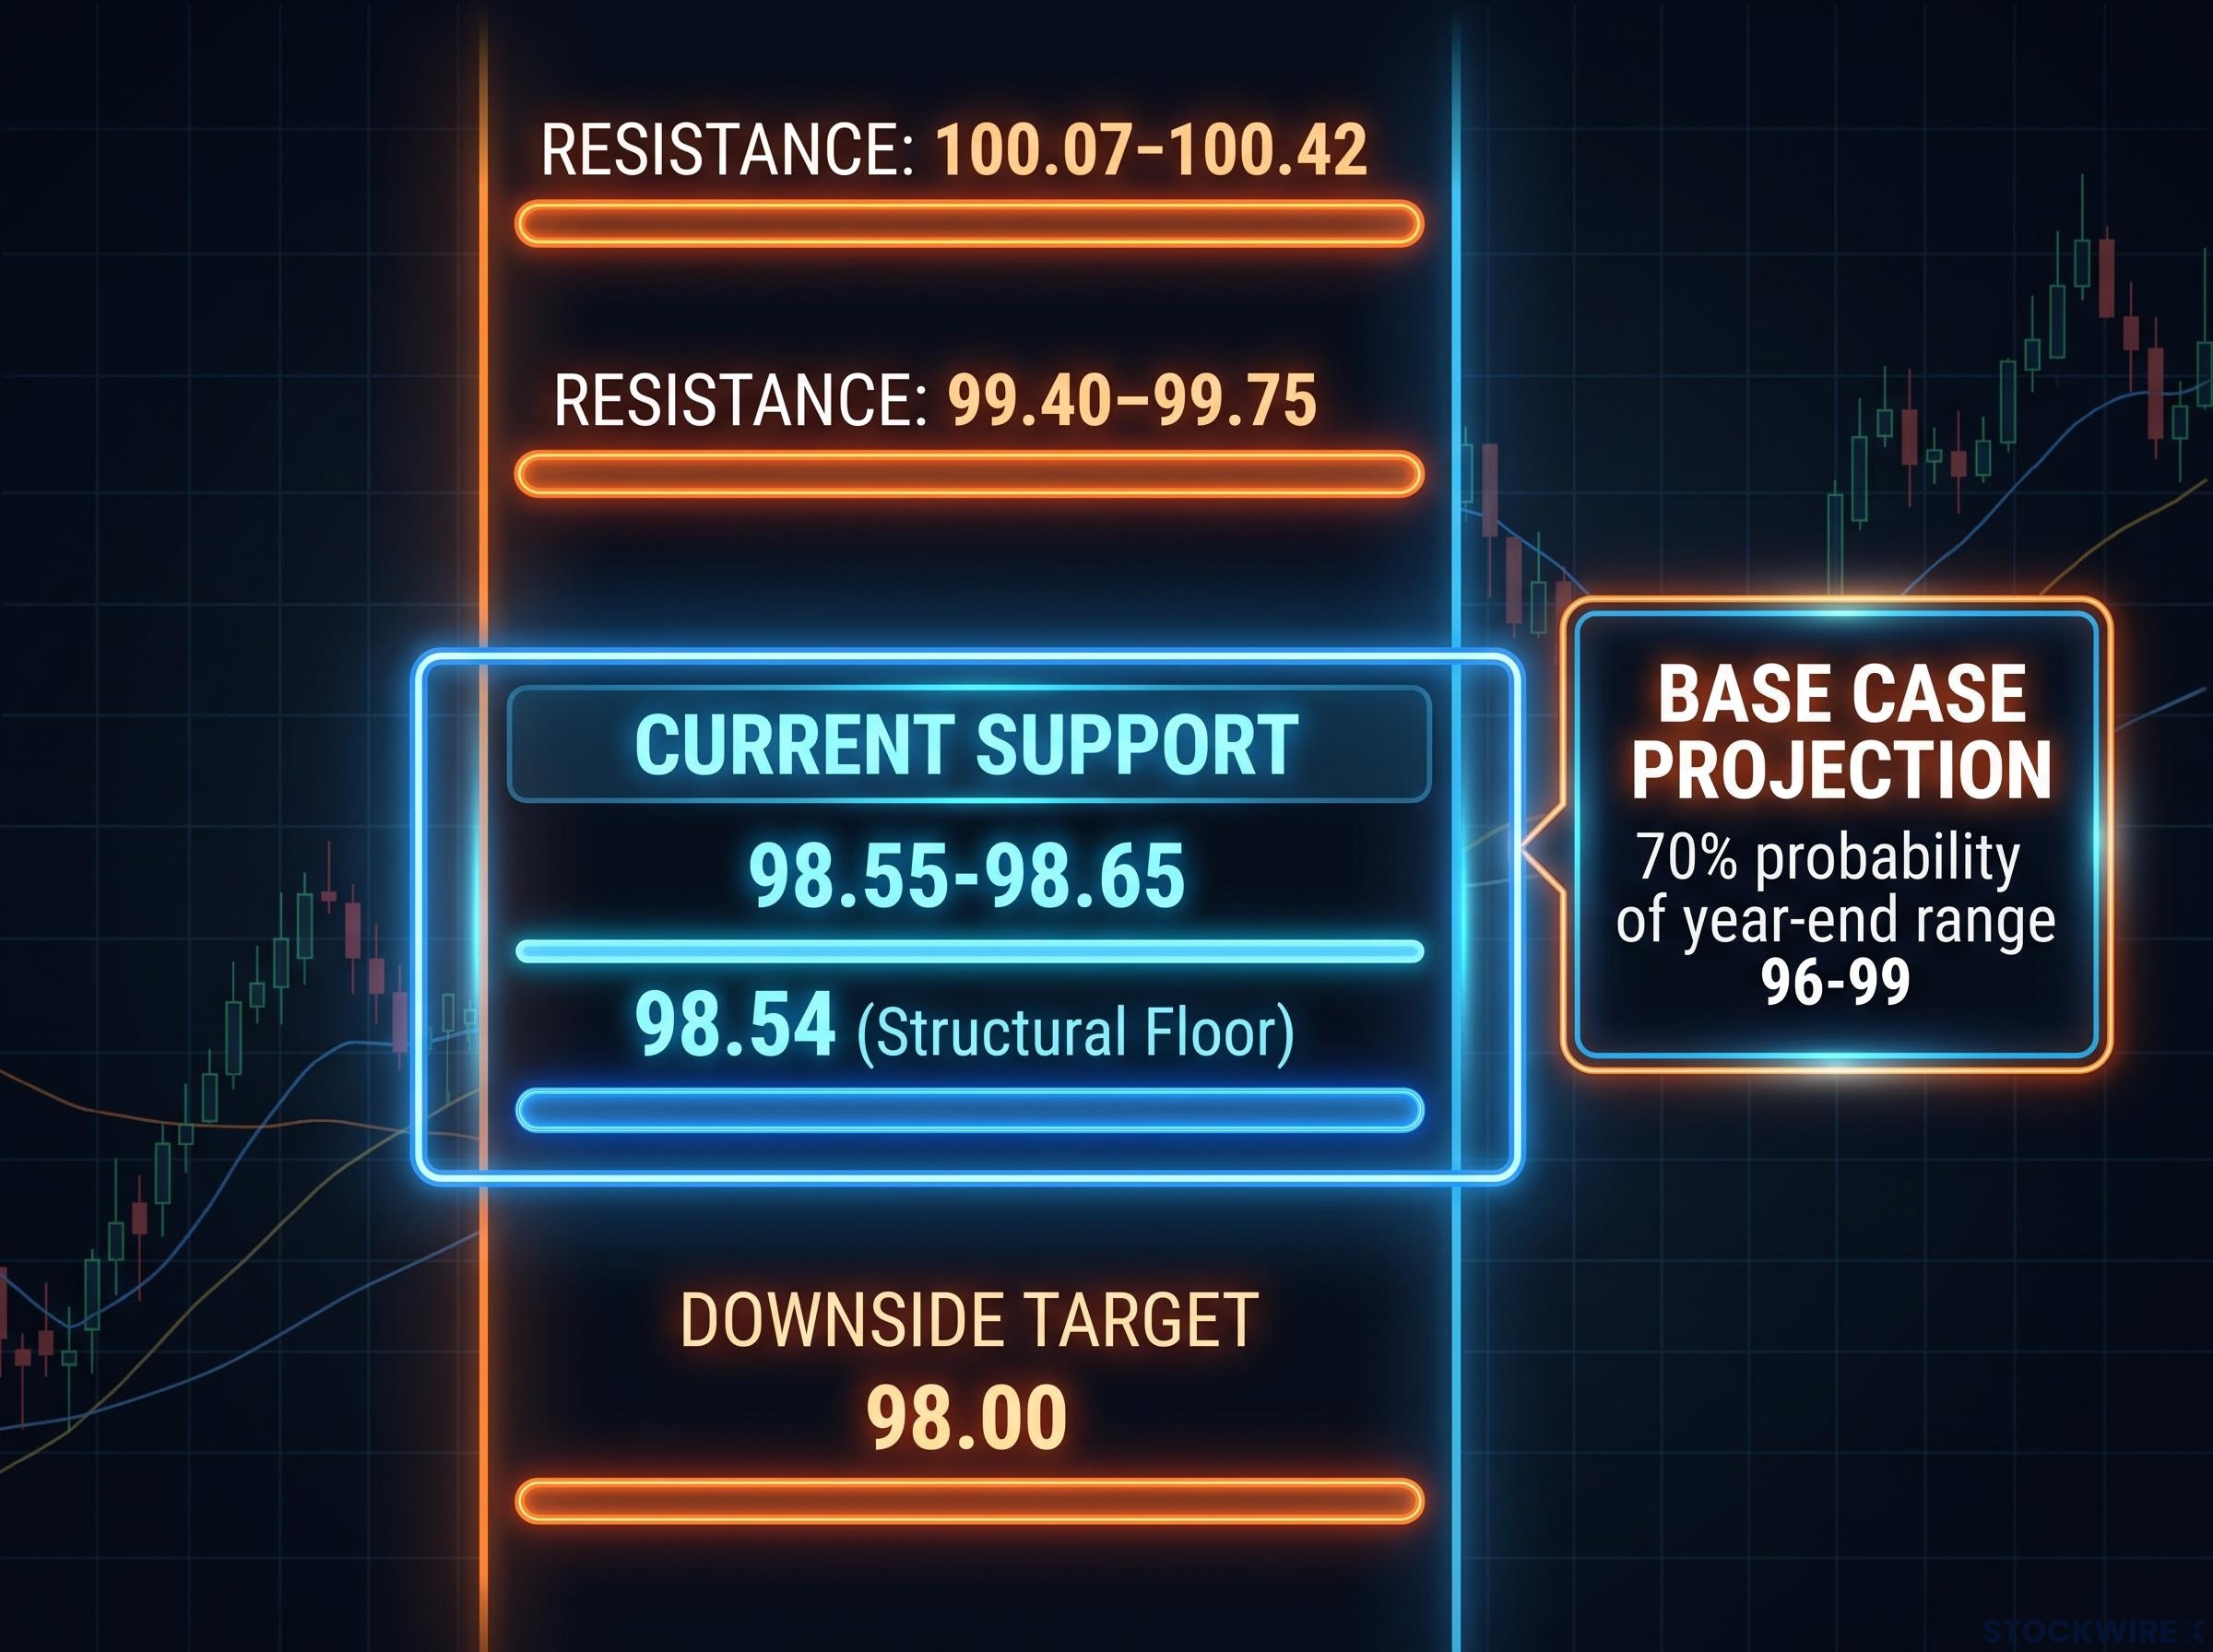
- Base case (range-bound). Uneven trade and moderate weakening as inflation declines and policy normalises. One projection places a 70% probability on a year-end DXY range of 96-99 amid geopolitical cooling.
- Bullish reversal. Resilient US growth combines with renewed energy inflation to delay Fed easing and reinforce safe-haven demand, pulling the dollar back up.
- Accelerated weakness. A sharply slowing labour market lets the Fed ease while fiscal concerns intensify, lowering the perceived quality of US assets and exposing a lingering political-risk premium.
The technical picture gives those scenarios concrete reference points to watch, in sequence:
The DXY technical structure entering the September window carries the residue of a bearish setup that formed in early August: RSI in the high-30s to low-40s, MACD below zero on the daily chart, and every prior support level rotating into resistance, a configuration that explains why the 98.55-98.65 floor is holding but not acting as a launchpad.
- Immediate support at 98.55-98.65
- Structural floor near 98.54
- A move toward 98.00, possible if a breakdown in USD/JPY acts as the catalyst
- Resistance band at 99.40-99.75
- Beyond that, longer-term resistance at 100.07-100.42
Here is the interpretive point for anyone positioning around the September FOMC. The August CPI is not merely an inflation print. It is a gating event that decides whether the 66% hike probability holds, climbs, or collapses. That probability shift will most likely matter more for the dollar than the hike itself, because the market has already priced much of the move and will trade the surprise.
Naming these catalysts and levels gives you a concrete checklist for the next six weeks rather than a vague directional lean. That is the practical difference between commentary and usable context.
Reading the dollar’s direction before the Fed makes its call
The core tension is now clear, and it is not a sign of an irrational market. The dollar’s refusal to respond to bullish fundamentals reflects a more discerning judgment about the quality of those fundamentals against the fiscal and capital-flow backdrop surrounding them.
Higher long-end yields are being read as a fiscal risk premium rather than an opportunity. That single reframing is the insight that explains most of the puzzle.
Two variables will signal which scenario is unfolding faster than anything else: the August CPI print, and USD/JPY price action around the September FOMC window. Watch the 98.55-98.65 support range and the 98.00 level as your immediate downside markers.
Hold the structural question as a separate layer. The cyclical forces are recoverable if rate differentials reassert. The structural headwinds, reserve diversification running toward that 57.13% share and fiscal credibility concerns, do not reverse on a Fed decision timeline. The common error is treating one set of forces as the whole story when the dollar can be supported in the short run and pressured over the long one at the same time.
For investors wanting to track how the PCE print and Fed communication interact with Treasury buyback operations in real time, our dedicated guide to dollar fiscal credibility signals covers the three observable markers — DXY behaviour around 100, long-end yield drivers, and oil price direction — that distinguish a fiscal-worry selloff from a growth-driven one.
This article is for informational purposes only and should not be considered financial advice. Investors should conduct their own research and consult with financial professionals before making investment decisions. Past performance does not guarantee future results, and these forward-looking scenarios are speculative and subject to change based on market developments.