Here is a bit of arithmetic that has convinced a lot of intelligent people to lose money. A stock pays a $1 dividend. You buy it the day before it goes ex-dividend, collect your dollar, sell it the next morning, and pocket the difference. Free money, repeatable across hundreds of stocks, every single day of the year.
The problem is the next morning. On the ex-dividend date, exchanges and market makers mechanically mark the opening price down by roughly the dividend amount, so the dollar you just “earned” was already sitting in your position as capital. You did not gain income. You converted stock into cash and paid to do it. This is why dividend capture fails, and the reason is baked into market plumbing rather than bad luck.
The strategy has genuine surface logic, which is exactly why it keeps attracting serious retail investors around the world. Its failure is not obvious until you understand the price adjustment, and then watch four separate cost layers attack whatever thin edge remains.
By the time you finish reading, you will understand not just that the strategy tends to fail, but precisely where it breaks at each stage. That is the knowledge you need to evaluate any dividend-based claim you come across in future.
How the ex-dividend mechanism works against you from the opening bell
The price drop is not a coincidence or a market mood. It is a designed adjustment.
When a company pays a dividend, it hands out cash it previously held, so the business is worth exactly that much less the moment the payment is committed. On the ex-dividend date, exchanges and market makers open the stock at a price reduced by approximately the dividend amount. Your total position value, shares plus the cash dividend, is broadly unchanged before you pay a single cost. The dividend is a reclassification of your own capital, not a bonus layered on top of it.
The catch for capture traders is that the drop is usually slightly less than the full dividend. That small shortfall is the entire theoretical edge. Recent empirical work confirms it exists, but also shows how thin and how variable it is across markets.
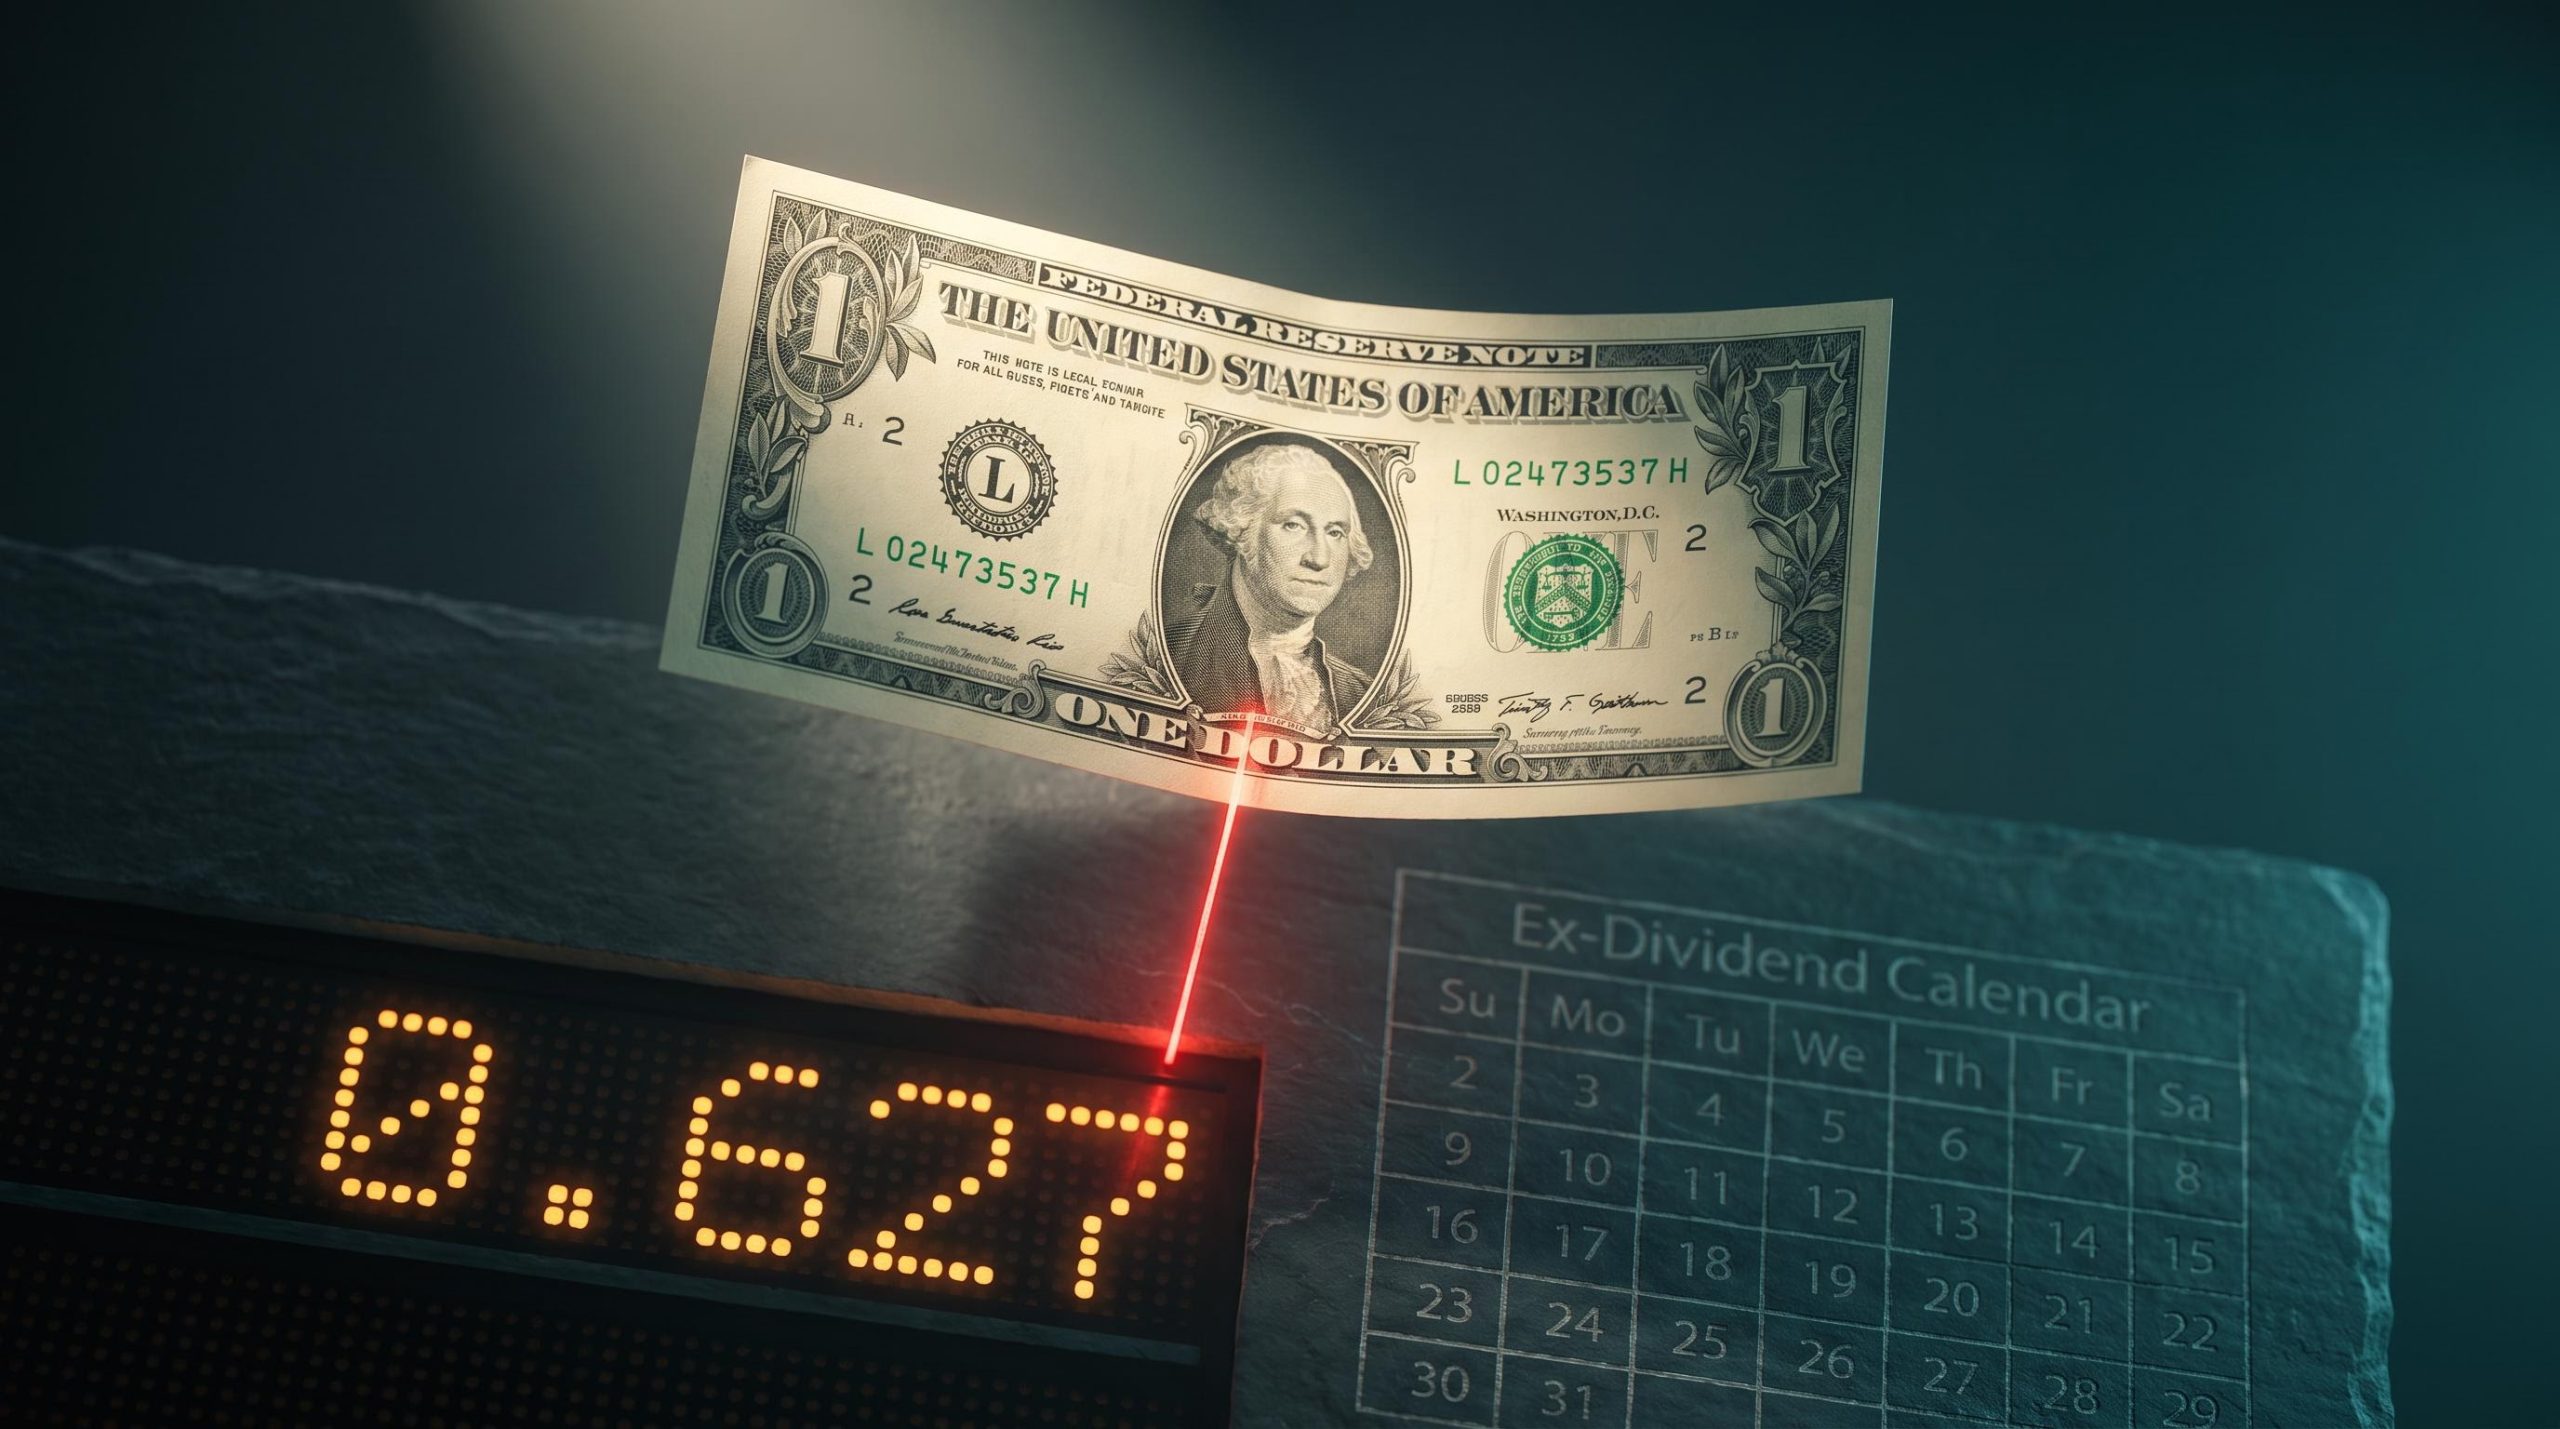
A study of 5,106 ex-dividend events across 80 S&P 500 stocks found a mean close-to-open drop ratio of 0.812, meaning prices fell by about 81% of the dividend in raw terms. After adjusting for broader market movement using beta, that fell to 0.627, so only about 63% of the dividend showed up as a “pure” dividend-driven price change. Broad U.S. equity event studies found raw drop ratios climbing from 0.879 in 2021 to 0.922 in 2025.
The picture shifts by country. Swedish research found the market-adjusted drop ratio close to 1.0 and not statistically distinguishable from full adjustment, with a 0.937 mean for the 2020-2024 sub-period. Across Australian markets, prices drop by roughly 90-95% of the dividend on average. And in less liquid markets the pattern can vanish entirely: studies of Indonesian indices over 2018-2023 found no statistically significant difference between prices before and after the ex-date.
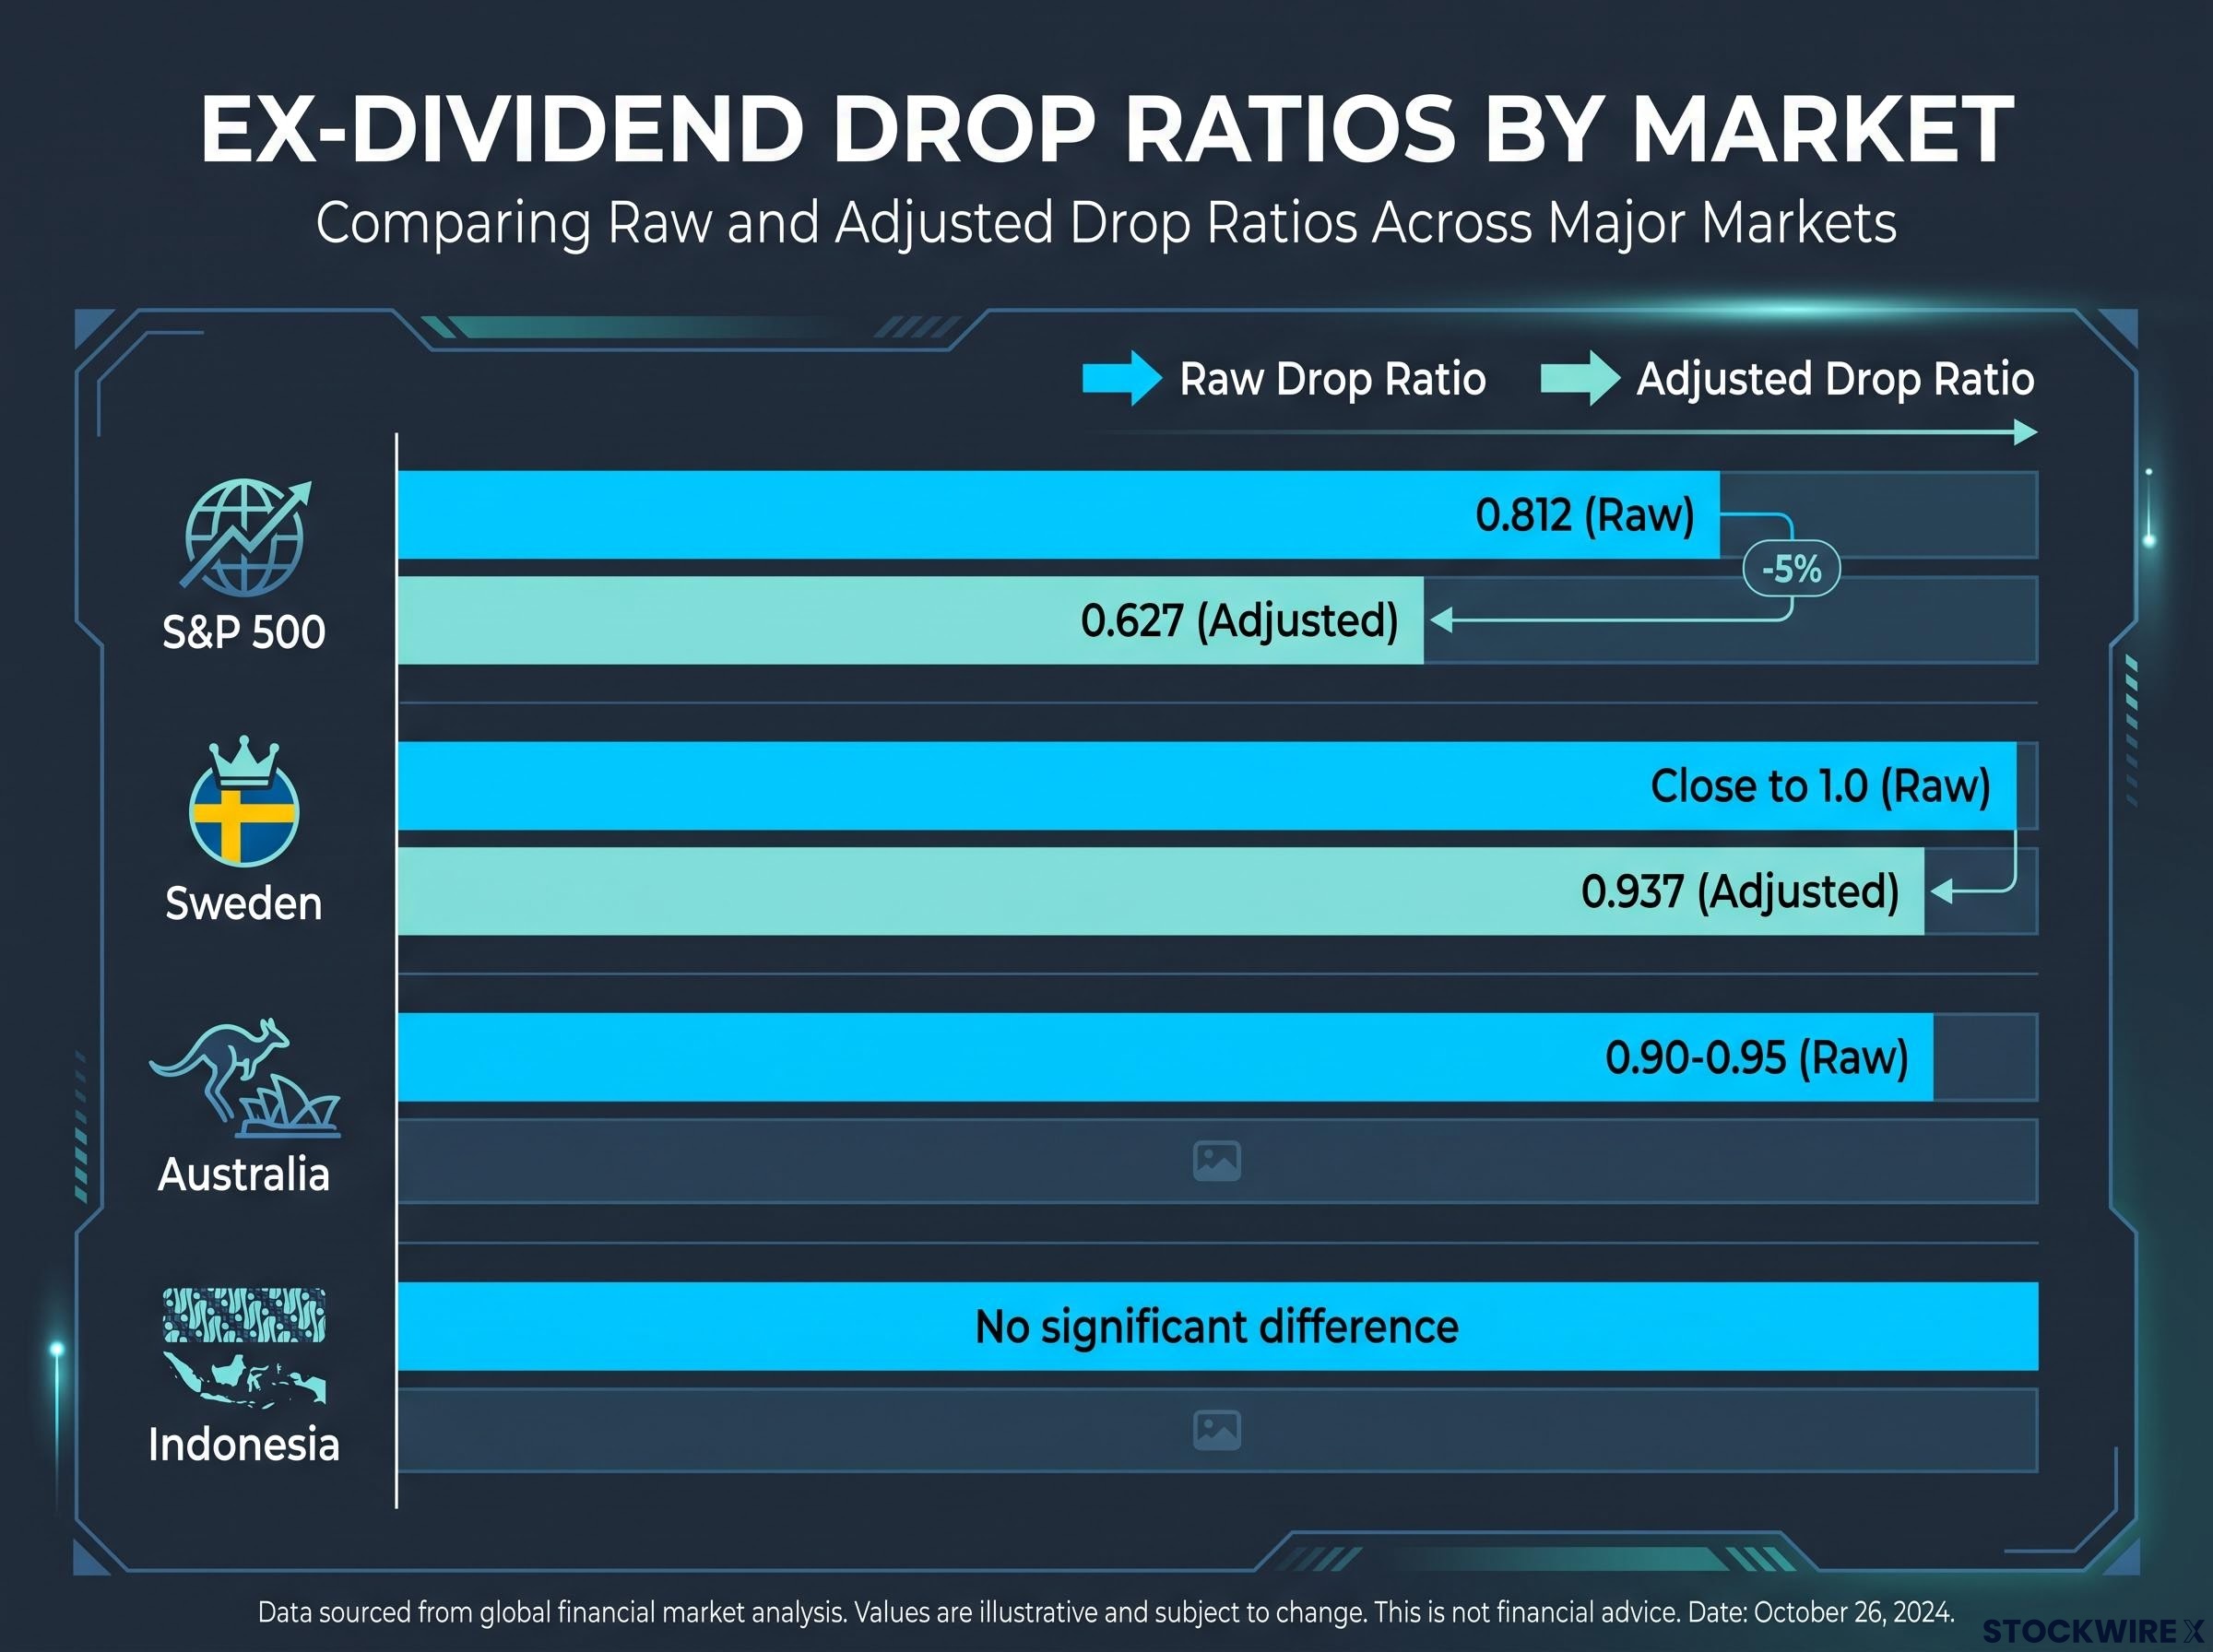
| Market | Study period | Raw drop ratio | Adjusted drop ratio |
|---|---|---|---|
| U.S. large caps (S&P 500) | 2010-2025 | 0.812 | 0.627 (beta-adjusted) |
| U.S. broad equities | 2021-2025 | 0.879 rising to 0.922 | Not reported |
| Sweden | 2020-2024 | Close to 1.0 | 0.937 (market-adjusted) |
| Australia | Long-run average | 0.90-0.95 | Not reported |
What this tells you is blunt. The “free money” gap is real but tiny, it varies by market, and you are chasing it in an environment where the smallest movers have already claimed it.
Why institutional players have already priced out your edge
You are not the only one who has noticed the gap. Arbitrageurs and high-frequency trading firms track it constantly, and they trade it with execution costs close to zero.
By the time your retail order reaches the market, the residual edge has already been compressed by participants who move faster and pay less. Market efficiency here is not an abstract theory. It is a named competitive dynamic with real firms sitting on the other side of every capture trade you place, and they are structurally ahead of you before you begin.
When big ASX news breaks, our subscribers know first
The four cost layers that consume whatever the price drop left behind
Even if a sliver of edge survives the price adjustment, four costs arrive to finish it off. They do not attack one at a time. They apply simultaneously to the same small dividend.
- Tax drag, the largest and most damaging layer. Short holding periods disqualify the payout from favourable treatment. In the U.S., qualified-dividend rates require a 61-day holding period around the ex-date, which capture structurally violates, so gains are taxed as ordinary income at 10-37% federal rates plus state tax.
- Margin borrowing costs. If you use leverage, you pay for it. Charles Schwab charges roughly 11.5-13.3% on margin balances, Interactive Brokers around 4-6%, and Robinhood’s 2026 tiers 3.95-5%, against target ETF yields well below those levels.
- Transaction friction. Even with zero commissions, you cross the bid-ask spread twice per round trip. In less-liquid names that cost can match or exceed the dividend you are trying to collect.
- Operational burden. Daily monitoring of ex-dates, execution windows, and position management is a real ongoing time cost with implicit financial value, especially set against the near-zero effort of passive investing.
The tax layer bites everywhere, not just in the U.S. For the 2026-2027 UK tax year, dividend rates above the £500 allowance run at 10.75%, 35.75%, and 39.35%, and HMRC guidance under SAIM5060 can reclassify high-frequency dividend activity as trade profits. Canada’s gross-up and credit system can push frequent traders into higher combined marginal brackets. In Australia, non-residents face 30% withholding on unfranked dividends, while residents apply their marginal rates.
The margin arithmetic is where the strategy often dies on the spreadsheet. Popular high-yield targets such as SPYD yield roughly 4.4-4.6% and SPHD around 4.1%. Even the SPDR Portfolio High Yield Bond ETF, at about 7.29%, barely clears retail margin rates.
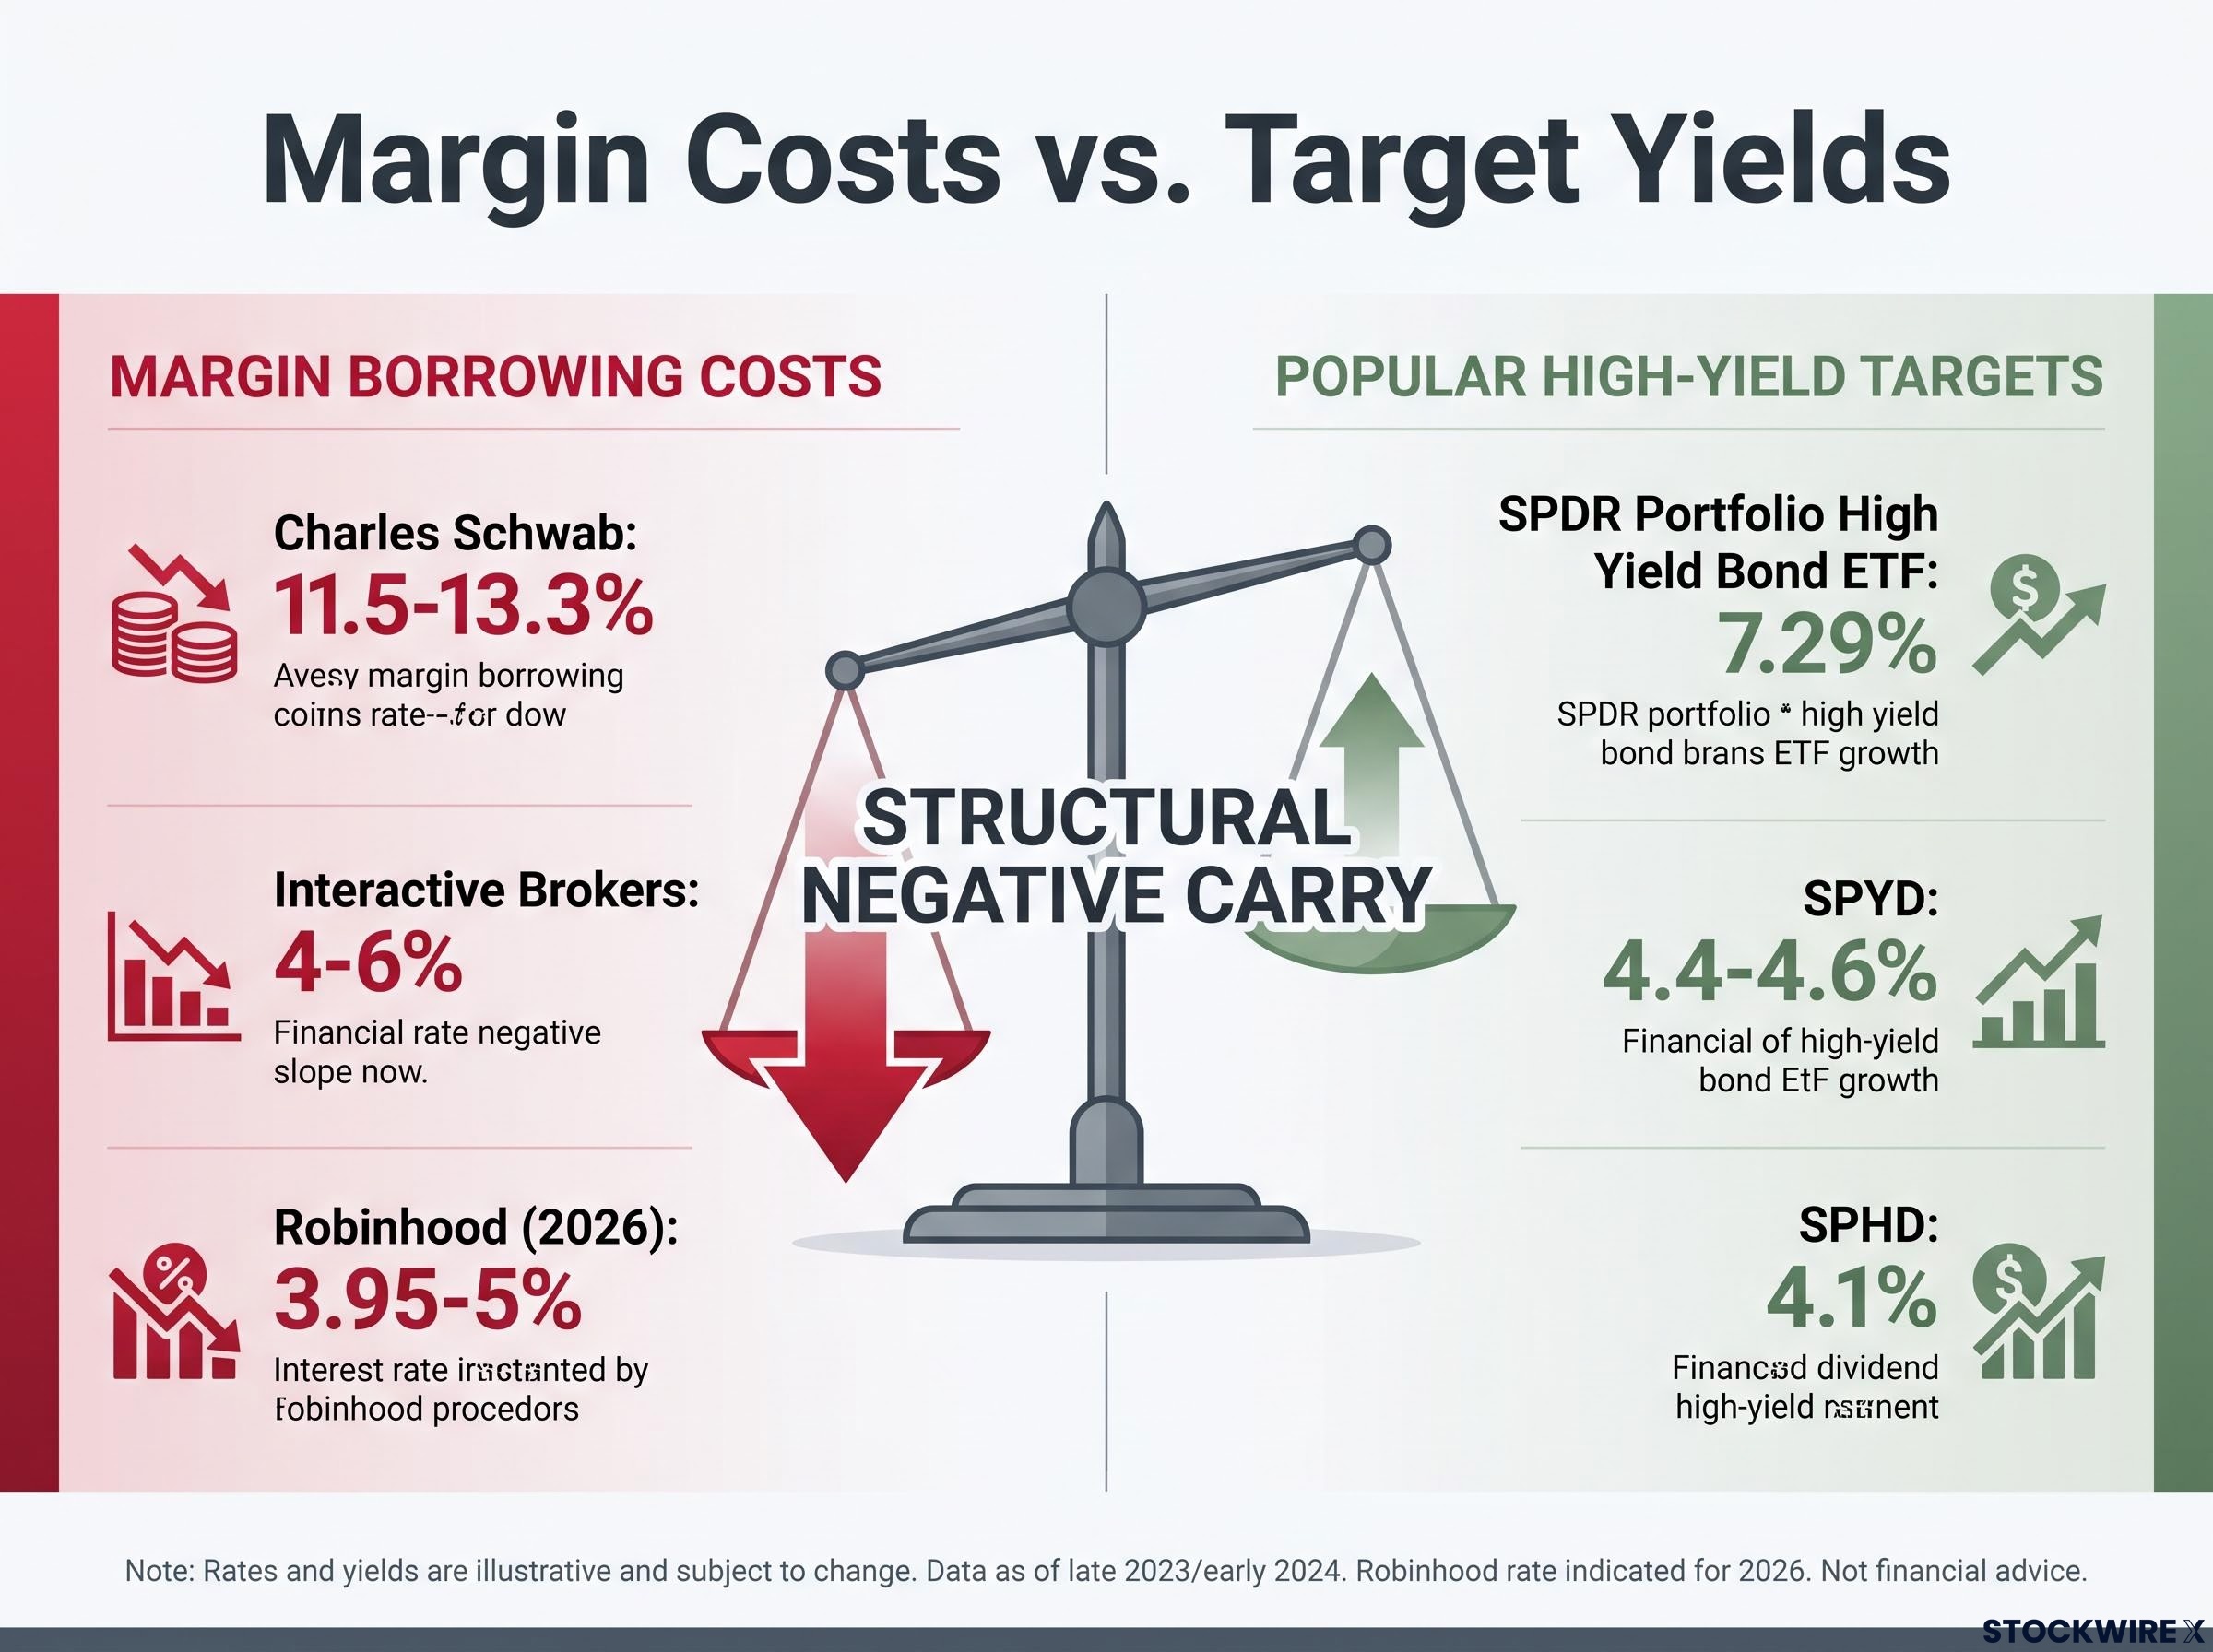
Retail margin rates of 9-12% versus target dividend yields of 4.1-4.6% make leveraged capture a structurally negative-carry trade before a single trade is placed.
Any one of these costs is manageable on its own. The reason capture that looks viable in a model rarely survives reality is that you are not fighting a thin margin, you are fighting four erosion mechanisms at once, all draining the same small payout.
What real-world experiments actually show when the strategy is tested
The honest version of this story is not that capture never produces a profit. It sometimes does. The damning part is what happens when you look at the effort and scale required to earn it.
Consider a documented personal experiment by Phantom Finance, run with CAD $100 inside a Canadian tax-free savings account (TFSA). It returned roughly 2.2% per month, which projects to around 26% annualised. Impressive on paper. In some cases market momentum carried the position enough to close within a single day, and “profitable” often meant the distribution nudged the net position positive rather than the price fully recovering. The tiny capital kept the activity below the regulatory radar that would apply at meaningful size, and the investor still concluded it was not worth pursuing because the daily workload could not justify the money involved.
Scale it up and the appeal drains away. One investor documented 247 real capture attempts with a 63% win rate, yet netted only about 2.3% annualised on deployed capital, nowhere near enough to pay for the time spent. A public “25 Days of Dividend Capture” run reported roughly $950 pre-tax on a $30,000 portfolio across 47 buys, about a 3% return, with researchers cautioning heavily against reading a short anecdote as a durable strategy.
The institutional edge is fading too. A 2026 Bayesian analysis by IdeaFarm of large-cap stocks found average profit per dividend event fell from 0.230% across 1990-2025 to roughly 0.114% in the 2020-2025 period, mildly positive before costs and negative after them.
| Experiment | Scale | Gross return | Net / annualised outcome | Conclusion |
|---|---|---|---|---|
| Phantom Finance (TFSA) | CAD $100 | ~2.2% monthly | ~26% annualised | Abandoned; not worth the daily work |
| 247-trade retail diary | Meaningful capital | 63% win rate | ~2.3% annualised | Failed to pay for time invested |
| 25 Days of Dividend Capture | $30,000, 47 buys | ~$950 pre-tax (~3%) | Not extrapolable | Too short to prove durability |
| IdeaFarm decay analysis | Large-cap universe | 0.114% per event (2020-2025) | Negative after costs | Edge roughly halved in five years |
Algorithmic backtests can show theoretical gross returns as high as 220% annually, but those are simulations that do not survive real execution costs, spreads, and tax. A 2025 paper in the International Journal of Finance and Management Research analysing Indian REITs concluded the approach “lacks reliability” because short-term price adjustments are unpredictable.
The IdeaFarm data shows strategy profit per event has roughly halved over the past five years, and that is before any retail-level cost is applied.
Here is the read for you. The 2.2% monthly figure sounds compelling until you see it required daily management of a $100 position, operated too small to attract scrutiny, and was still judged not worth repeating by the person who ran it. That is the clearest verdict the real world offers.
What the mechanics of buy-and-hold reveal about dividend capture’s real cost
The right comparison is not passive versus active. It is a structural question: where does your return actually come from, and how much of it survives the way you access it?
Long-term holding of dividend-paying equities or index funds taps the same underlying income stream, but at qualified tax rates, with near-zero transaction costs, and with the compounding of reinvested payouts. It is simply the efficient version of the same income source. Every friction that capture introduces, buy-and-hold removes.
That efficiency shows up as four structural advantages:
- Qualified tax rates. Holding long enough (61 days in the U.S.) unlocks rates well below the ordinary income rates that short-term capture triggers.
- Near-zero transaction costs. You cross the spread once to buy and rarely to sell, rather than round-tripping constantly.
- DRIP compounding. Reinvested dividends compound inside the position without triggering tax events or trading costs each cycle.
- Near-zero operational burden. A passive holder does almost nothing, while a capture trader manages positions daily.
The point is not that dividends are bad. It is that the capture mechanism piles on costs a patient investor never pays. The failure is about execution frequency, not the asset class.
The 30-year compounding gap that makes the case definitively
A 30-year market simulation compared a dividend-rotation strategy against a broad index fund. The index fund won by approximately $275,000, building roughly 20-30% more wealth over three decades. The single methodological note worth making is that this is a modelled comparison, not a live account, but the mechanism behind the gap is straightforward.
That $275,000 is not a rounding error. It is the accumulated cost of trading friction, tax drag, and missed compounding. The price of chasing capture is paid not in one failed trade but in decades of compounding you never see, and the gap widens with every round trip that adds a fresh friction layer.
Where this leaves the investor who wants income without the friction
The failure mechanism reduces to three moves. The price drop neutralises the dividend, the four cost layers consume whatever residual is left, and real-world experiments confirm the approach does not scale to meaningful capital.
There is a narrow legitimate use case. Very small, tax-sheltered, short-duration experiments can produce positive gross returns, as Phantom Finance showed. That is a curiosity, not a repeatable income strategy at any capital you would care about.
The structural alternative is the same income accessed without the friction: patient holding of diversified, dividend-paying equities or broad index funds inside tax-advantaged accounts.
Dividend capture fails not because dividends are worthless, but because the act of capturing them costs more than the dividend is worth.
This article is for informational purposes only and should not be considered financial advice. Investors should conduct their own research and consult with financial professionals before making investment decisions. Past performance does not guarantee future results. Financial projections are subject to market conditions and various risk factors.