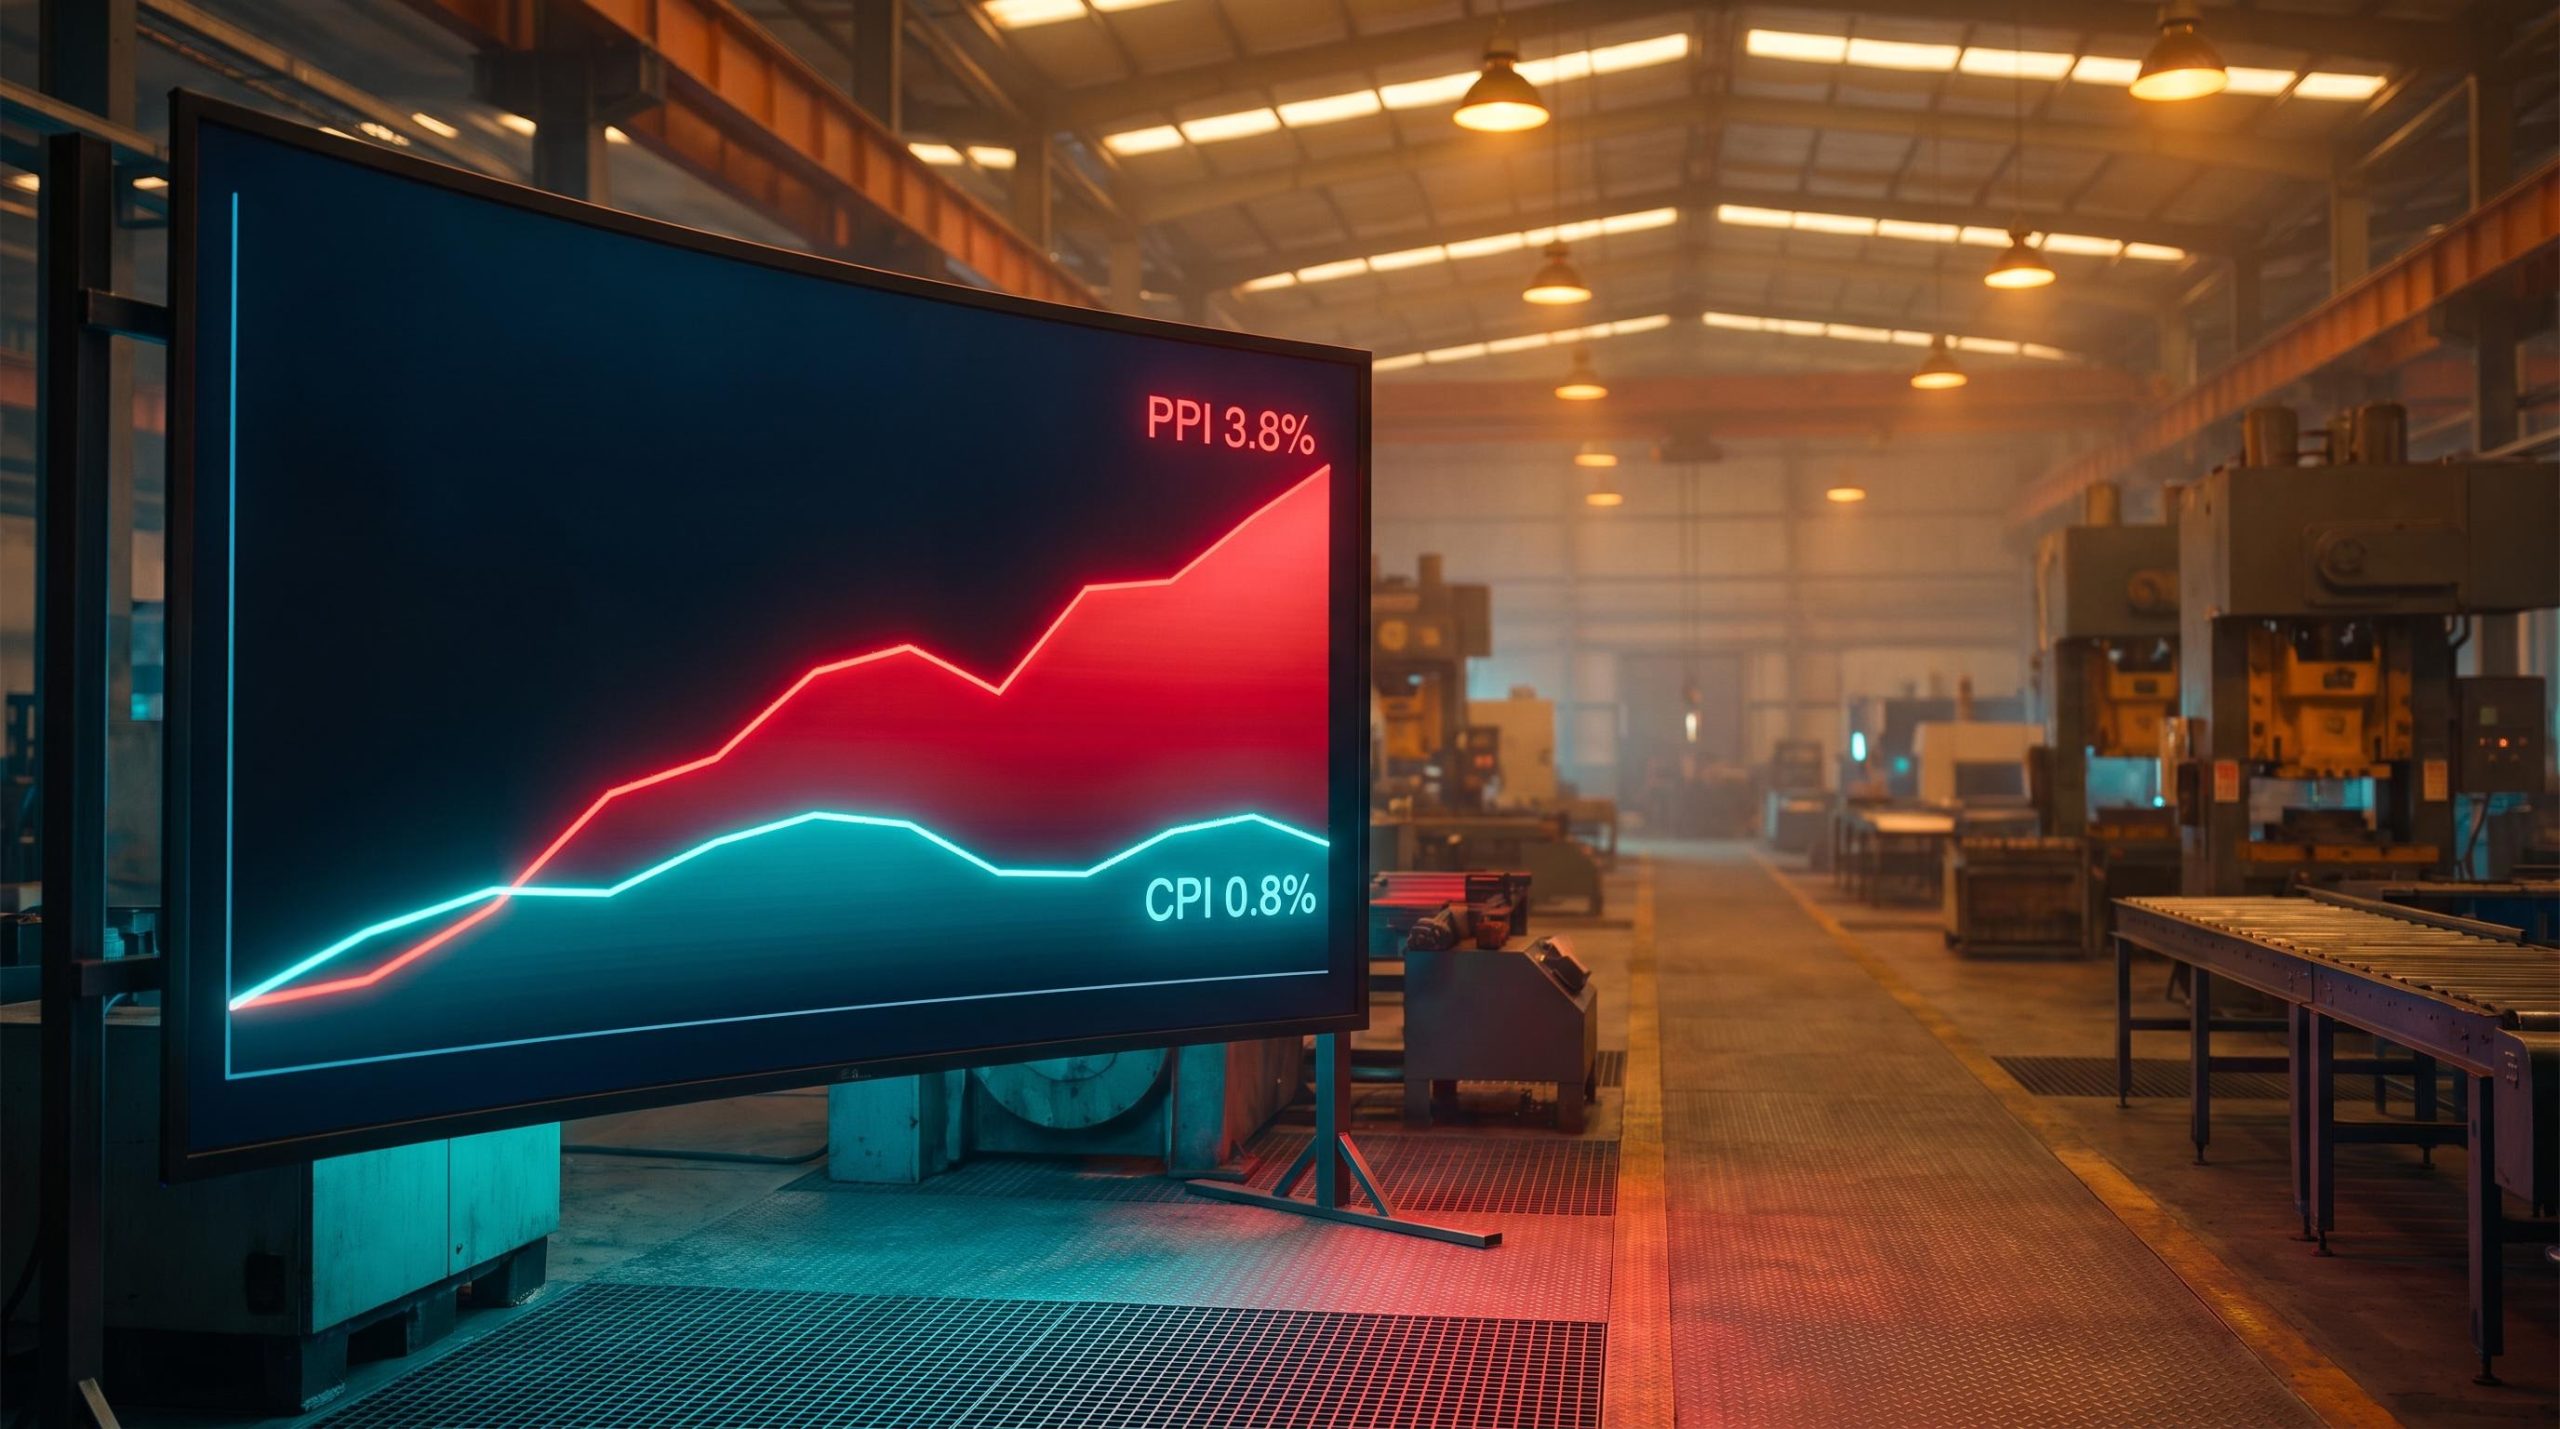
China’s producer prices are rising nearly five times faster than its consumer prices, and the companies caught in the middle are absorbing the difference.
The August 2026 data from the National Bureau of Statistics (NBS) put the Consumer Price Index (CPI) at 0.8% year-over-year and the Producer Price Index (PPI) at 3.8%. That gap is not a statistical curiosity. It is a structural signal about the state of Chinese domestic demand, and about how much room the economy actually has to grow the way policymakers say they want it to.
At the same time, the USD/CNH pair has slid to around 6.71, its weakest level for the US dollar against the yuan since early 2023. That raises the stakes on a difficult question: whether a stronger currency can accomplish what fiscal policy has so far struggled to deliver, namely pulling Chinese households back to the centre of the economy.
This piece maps the mechanism connecting those two dynamics. It sets out why the divergence is squeezing corporate margins rather than driving a clean demand recovery, and what the yuan’s trajectory can and cannot realistically do for China’s rebalancing effort.
What August’s inflation numbers actually reveal about Chinese demand
Read on their own, the August figures look encouraging. Read together, they describe a squeeze.
Here is the sequence the NBS released on 9 September 2026:
- Headline CPI rose 0.8% year-over-year in August, up from 0.5% in July, in line with consensus.
- Core CPI (excluding food and energy) reached 1.0%, up from 0.9% in July and ahead of the 0.9% consensus estimate.
- PPI climbed 3.8%, accelerating from 3.5% in July and beating the 3.6% forecast.
The core CPI beat is a genuine, if modest, positive. It tells you underlying consumer prices are firming rather than fading. But the number that carries the structural weight is the spread: 3.0 percentage points between what it costs to produce goods and what consumers are willing to pay for them.
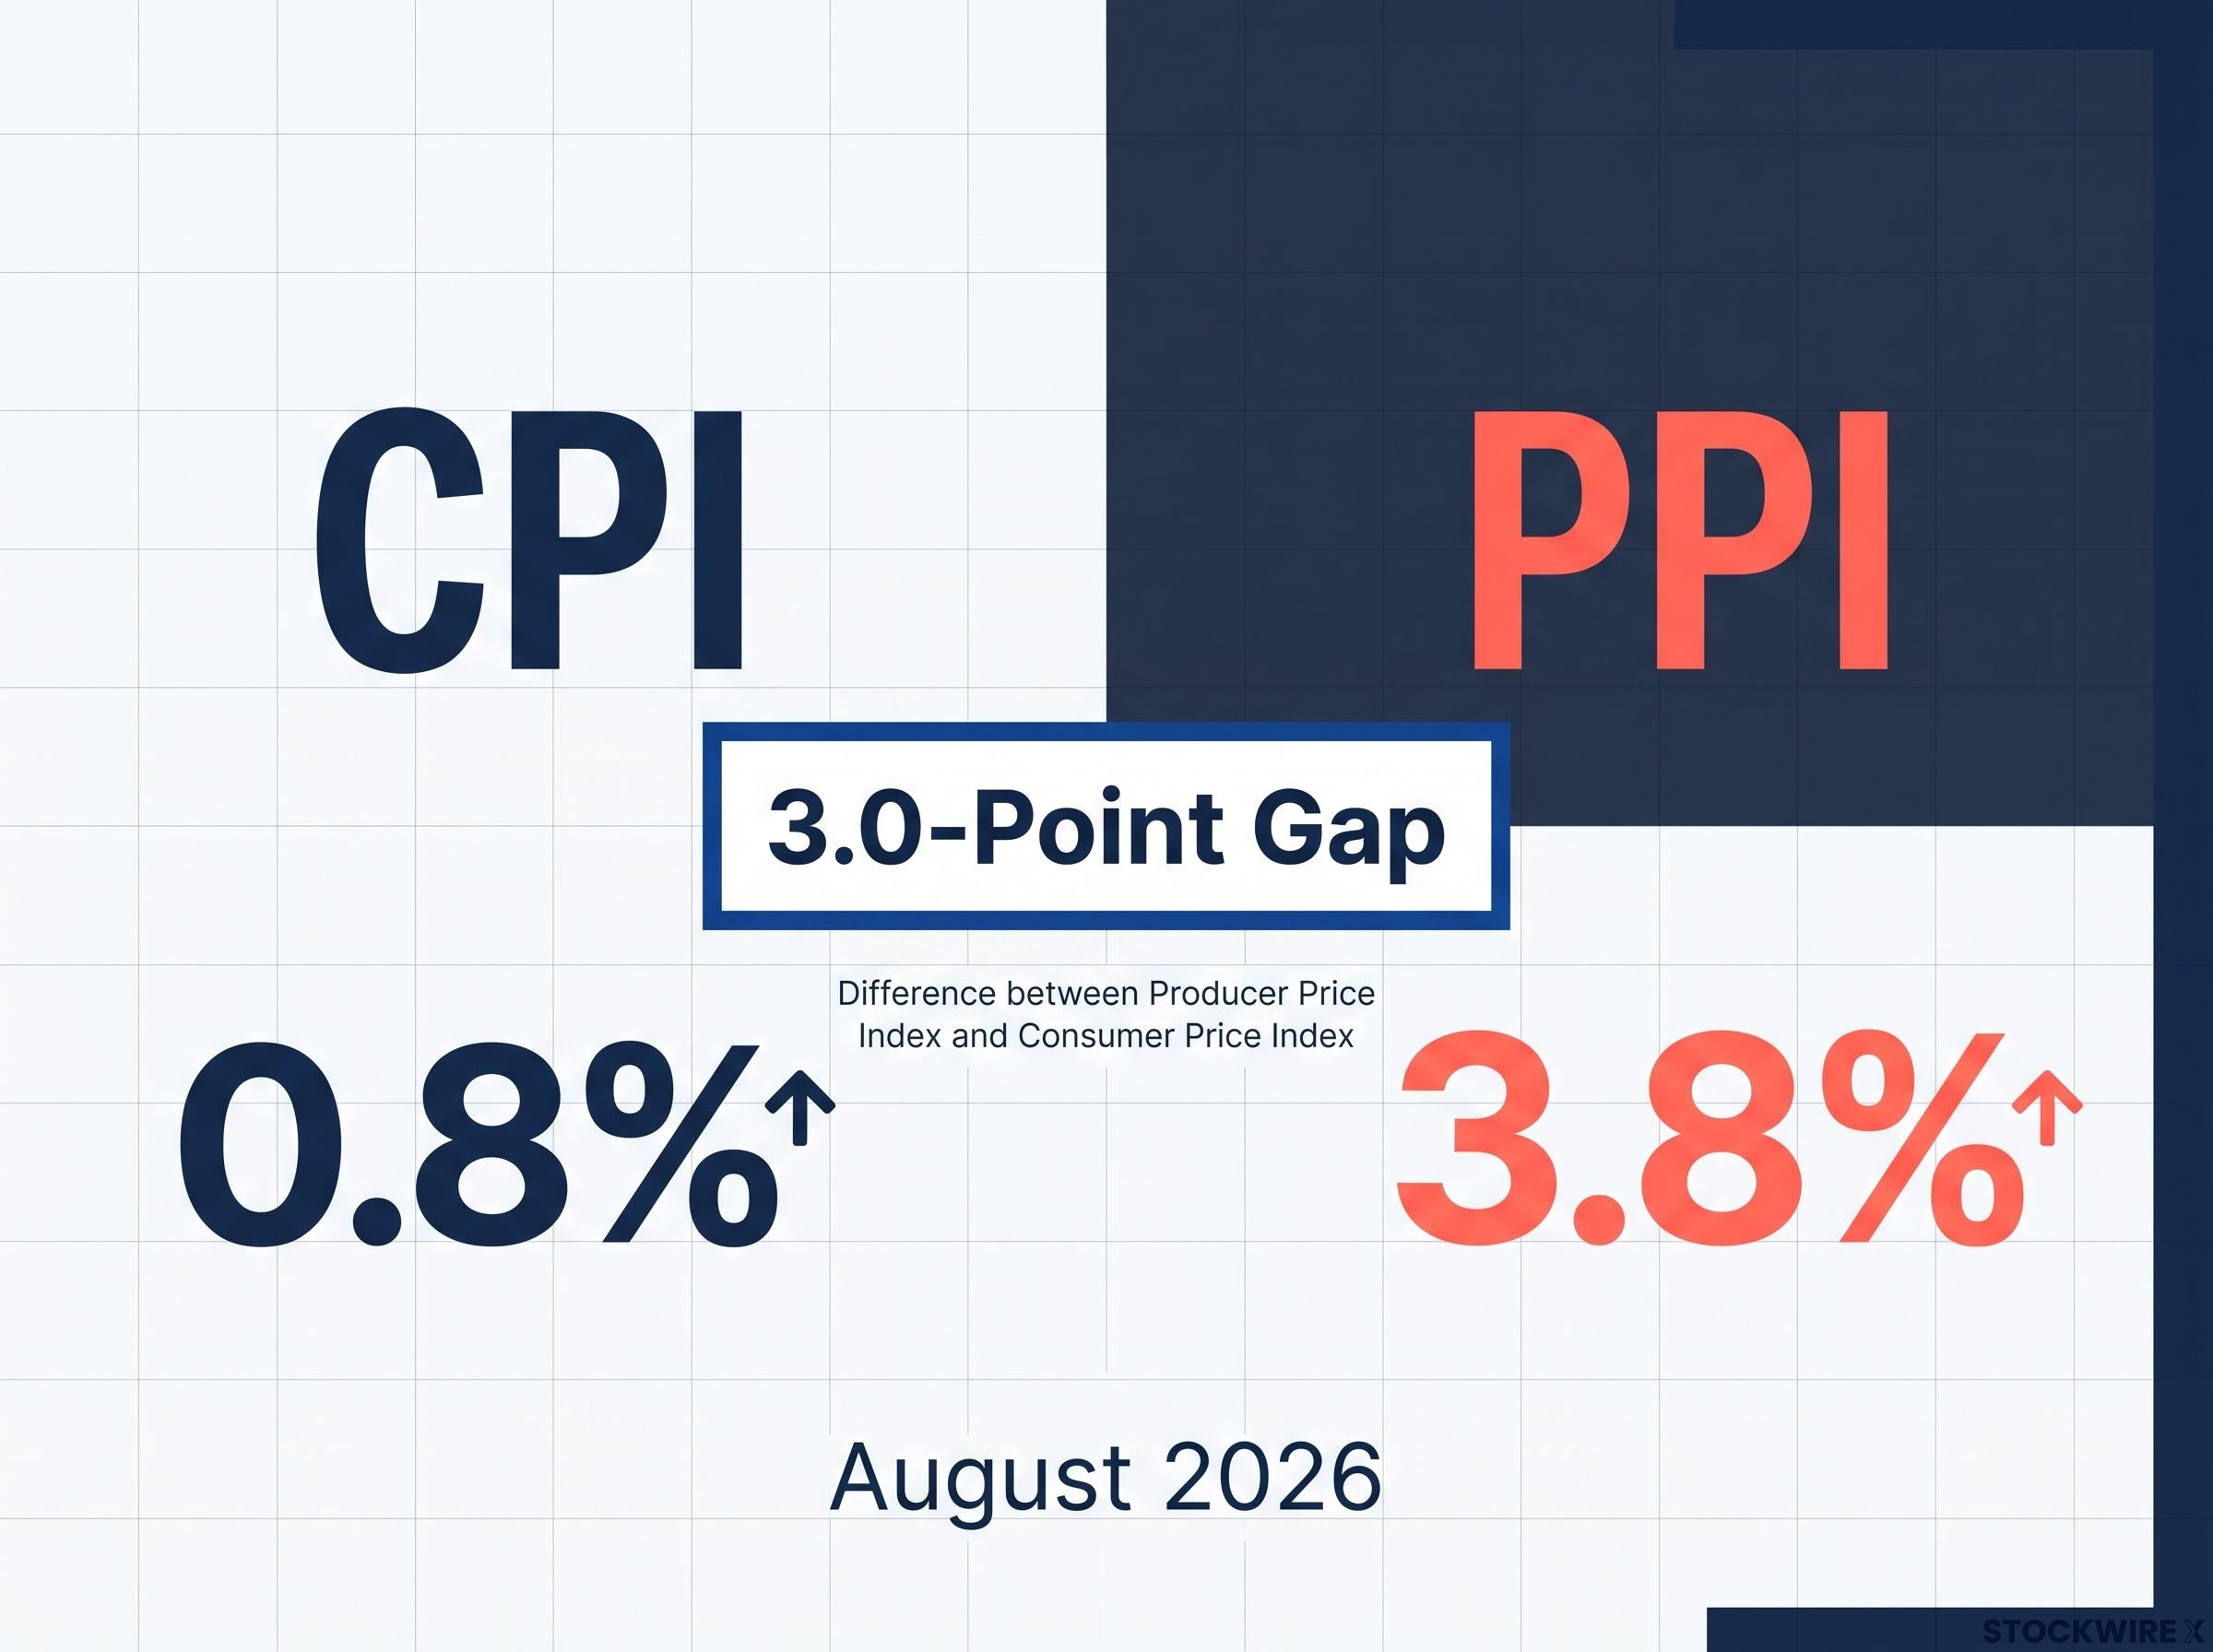
That gap is a pricing-power diagnostic. When producer prices run this far ahead of consumer prices, it means firms facing higher input costs cannot pass those costs through the till. They eat the difference instead.
The June 2026 reading, where the CPI-PPI divergence reached its widest spread in four years, was the earlier inflection point that set the structural conditions visible in the August data; the AI-driven semiconductor demand the NBS statistician flagged then remains one of the principal forces keeping factory-gate inflation elevated.
Analysts at Brown Brothers Harriman note that consumer price growth running weaker than producer price growth reflects constrained corporate pricing power, and points to domestic demand that has yet to fully recover.
For anyone tracking China’s macro trajectory, this is the reading that matters. The 3.0-point gap tells you Chinese firms are absorbing upstream cost inflation rather than passing it on. That is not a sign of competitive health. It is a sign of demand fragility, and it sets a hard ceiling on how far the industrial profit recovery can extend.
From deflation to divergence: how quickly the picture has shifted
The distance travelled in twelve months is real. In August 2025, CPI fell 0.4% on a monthly basis and PPI was down 2.9% year-over-year. The economy was in outright deflation at the factory gate.
Getting out of that hole is progress. But climbing out of deflation and standing in a healthy demand environment are not the same thing, and the spread is the proof that China is doing the former without yet reaching the latter.
When big ASX news breaks, our subscribers know first
How a 3-point spread translates into a margin squeeze across Chinese industry
The abstract gap becomes concrete on the income statement, and the industrial profit numbers show exactly where.
The headline looks strong. Industrial profits for major firms rose 18.7% year-over-year in the first half of 2026, with operating margins reaching 5.7%, the highest year-to-date reading since 2024. That followed a full-year 2025 figure of 0.6% growth to nearly 7.4 trillion yuan, which ended three straight years of decline.
But the momentum is the tell. Profit growth cooled to 15.1% in June and 11.2% in July, the slowest monthly pace of the year.
| Period | Profit Growth (YoY) | Cumulative Profit | Context |
|---|---|---|---|
| Full-year 2025 | +0.6% | ~7.4 trillion yuan | Ended three years of declines |
| H1 2026 | +18.7% | Margins at 5.7% | Highest YTD margin since 2024 |
| June 2026 | +15.1% | Not separately reported | Momentum begins cooling |
| Jan-Jul 2026 | +17.6% | 4.58 trillion yuan | July alone slowed to +11.2% |
The deceleration from 18.7% in the first half to 11.2% in July tells you the recovery is already losing steam. And the source of the drag is not spread evenly. It is concentrated in the parts of Chinese industry most exposed to domestic households.
Two Chinas inside one profit number
The aggregate figure hides two very different stories. Export-focused and AI-linked sectors have posted strong earnings. Industries that sell to Chinese consumers remain under heavy margin pressure.
That divergence is why the headline number obscures more than it reveals. Elevated PPI is lifting revenues in export-heavy industries, which flatters the average, while the domestic-facing side of the economy carries the full weight of the pricing-power problem the spread describes.
Cement output collapsing 11.6% and steel products falling 4.1% in July confirm that property-linked sectors are absorbing the most severe domestic-demand pressure, even as advanced manufacturing flatters the headline industrial output figure; that arithmetic distortion is precisely what makes the 5.7% margin average misleading for investors with construction-linked exposure.
For any China-exposed equity or credit position, that distinction changes the read entirely. A 5.7% operating margin at the peak is still fragile if input costs keep rising faster than the prices firms can charge, and the firms selling to households are the ones with the least protection.
Why the yuan matters: the exchange rate channel as a demand mechanism
The yuan’s rise is usually filed under trade competitiveness. It belongs in a different folder: household purchasing power.
At around 6.71, USD/CNH sits at its lowest since January 2023, according to BBH’s Elias Haddad. OCBC’s Christopher Wong notes the pair briefly tested its February 2023 lows before a higher-than-expected People’s Bank of China (PBOC) fixing offered partial support. The direction is clear, and the level matters for reasons that have nothing to do with the trade balance.
The pro-appreciation case rests on a specific mechanism. A stronger currency reroutes economic energy toward consumers.
- Cheaper imports raise the real disposable income of Chinese households, giving them more to spend.
- Lower input costs ease the very margin pressure the CPI-PPI spread describes.
- A reduced export-subsidy effect nudges the economy away from external reliance and toward domestic demand.
The counterargument is equally precise, and it is about thresholds.
The USD/CNH consolidation near 6.72 observed in late August reflects exactly this managed pace: PBOC fixings set in the 6.78-6.79 area, weaker than market estimates, signalled that Beijing wanted to slow the appreciation rate rather than allow the medium-term trend to run, and US sanctions introduced under Operation Economic Outcast added a geopolitical risk premium that further complicates the clean rebalancing story.
A UNCTAD-linked analysis estimates that a 1% yuan appreciation reduces export margins for high-tech goods by approximately 0.7%, underlining how sensitive high-value manufacturing is to currency moves.
Reuters and BEA framing suggests that while Chinese exports have stayed competitive through recent appreciation thanks to industrial upgrading, a further 5-10% rise would materially erode that edge. EU Chamber President Jens Eskelund has argued that a historically undervalued renminbi has functioned as an effective export subsidy, which is precisely why letting it rise is seen as a rebalancing tool.
The USD/CNH level tells you the yuan is already doing some of this work in real time. But the margin-sensitivity data shows there is a point beyond which appreciation flips from helpful to damaging, and China has not yet found a clean way to know where that line sits.
Where the PBOC’s fixing adds a layer of control
This is not an unmanaged market move. The PBOC sets a daily fixing rate that anchors where the yuan can trade, and the September intervention Wong flagged shows that hand is active.
For your read on policy, that matters. The appreciation is being steered, not simply allowed, which means the pace is a deliberate choice the authorities can slow or accelerate as the export-margin math dictates.
What history says about export economies that try to rebalance through currency
Three advanced economies have run a version of this experiment, and each illuminates a different part of the problem.
Germany shows the export cost. Japan shows the deflation trap. South Korea shows the escape route.
| Economy | Appreciation Scenario | Export Impact | Consumption Rise? | Condition That Mattered |
|---|---|---|---|---|
| Germany | 10% real appreciation | ~6% fall in export volumes | Not automatically | Wage growth and fiscal support |
| Japan | Sharp yen rallies in low inflation | Tradable sector depressed | No, without demand stimulus | Domestic demand support |
| South Korea | Appreciation with strong exports | Absorbed by productivity gains | Sustained | Semiconductor-led productivity |
Bundesbank and OECD studies show a 10% real appreciation cuts German export volumes by roughly 6%, and that consumption does not rise automatically when appreciation is paired with wage restraint and tight fiscal policy.
Japan offers the sharper warning. CME analysis notes that steep yen rallies in a low-inflation setting can reinforce deflationary pressure and depress the tradable sector unless strong domestic-demand stimulus arrives alongside.
South Korea is the counterpoint. Its experience shows appreciation can coexist with robust exports where productivity gains, particularly in semiconductors, are strong enough to offset the currency headwind.
The record tells you currency appreciation is necessary but not sufficient for a consumption-led shift. And China’s specific mix of high precautionary saving, property-sector losses, and constrained fiscal space places it closer to the Japan scenario than the South Korea one.
The limits of the exchange-rate channel: what the yuan cannot fix on its own
Strip away the appreciation story and a harder truth remains: China’s price stability is more fragile than the positive headlines suggest.
The IMF’s 2025/2026 Article IV consultation reported that headline inflation averaged 0% across 2025. It put the baseline probability of deflation at roughly 7%, rising sharply under stress.
The IMF estimates the probability of deflation could reach 27-54% under stress scenarios, and warns that a prolonged episode could cut cumulative real GDP by more than 5%.
The yuan cannot touch the three constraints that sit beneath that fragility:
- Weak household confidence, rooted in losses across the property sector.
- High precautionary saving, as households hold cash rather than spend.
- Local-government debt, which limits the fiscal headroom available for stimulus.
The World Bank has attributed China’s earlier weakness directly to demand, noting CPI contracted 0.1% year-over-year across the first five months of 2025 entirely because of demand shortfalls. Policy has stayed cautious in response. The PBOC cut rates on structural monetary tools by 25 basis points in January 2026, but has held benchmark rates and the reserve-requirement ratio steady since May 2025, pledging in July 2026 only to keep liquidity ample.
Both the IMF and World Bank argue the fix is not a single lever but a coordinated package:
- Fiscal stimulus targeting social spending and household safety nets.
- Monetary easing beyond the structural tools deployed so far.
- Property-sector resolution to stem the wealth losses driving precautionary saving.
- Overcapacity reform to relieve the pressure feeding factory-gate price wars.
For your framework, the takeaway is this: the room for the currency to do rebalancing work alone is far narrower than the appreciation story implies. The exchange-rate channel only functions when those four conditions are moving together.
This article is for informational purposes only and should not be considered financial advice. Investors should conduct their own research and consult with financial professionals before making investment decisions. Past performance does not guarantee future results, and these scenarios are speculative and subject to change based on market and policy developments.
What would have to change for the consumption pivot to actually land
The three threads of this analysis are not three stories. They are three readings of the same problem.
The 3.0-point gap between CPI at 0.8% and PPI at 3.8%, the margin squeeze cooling industrial profits from 18.7% to 11.2%, and the yuan’s climb toward 6.71 all describe one underlying condition: domestic demand that has not yet found its feet. The currency is a necessary input to fixing that. On its own, it is not enough.
So watch for specific signals rather than headlines. A genuine shift shows up in the data before it shows up in the rhetoric:
- The CPI-PPI gap narrowing because consumer prices rise on real demand, not because producer prices fall.
- The household savings rate entering a sustained decline as confidence returns.
- Property-market stabilisation generating a wealth effect that pulls households back into spending.
The PBOC’s reluctance to move beyond structural tools since May 2025 signals caution, not conviction. And the IMF’s four-part reform package is the benchmark to measure future announcements against: not whether any single measure is bold, but whether it addresses the full set of constraints at once.
When the gap closes through demand, when savings fall, and when the PBOC broadens its easing, that is when the rebalancing is finding real traction.
For investors exploring how institutional forecasters are positioning across this regime, our deep-dive into China’s yuan appreciation thesis examines why MUFG held its USD/CNY 6.65 target unchanged after soft July 2025 data, grounding the call in China’s external surplus and policy credibility rather than near-term activity momentum.