Is Macquarie Group’s Rally a Premium Earned or Borrowed?
3 mins ago

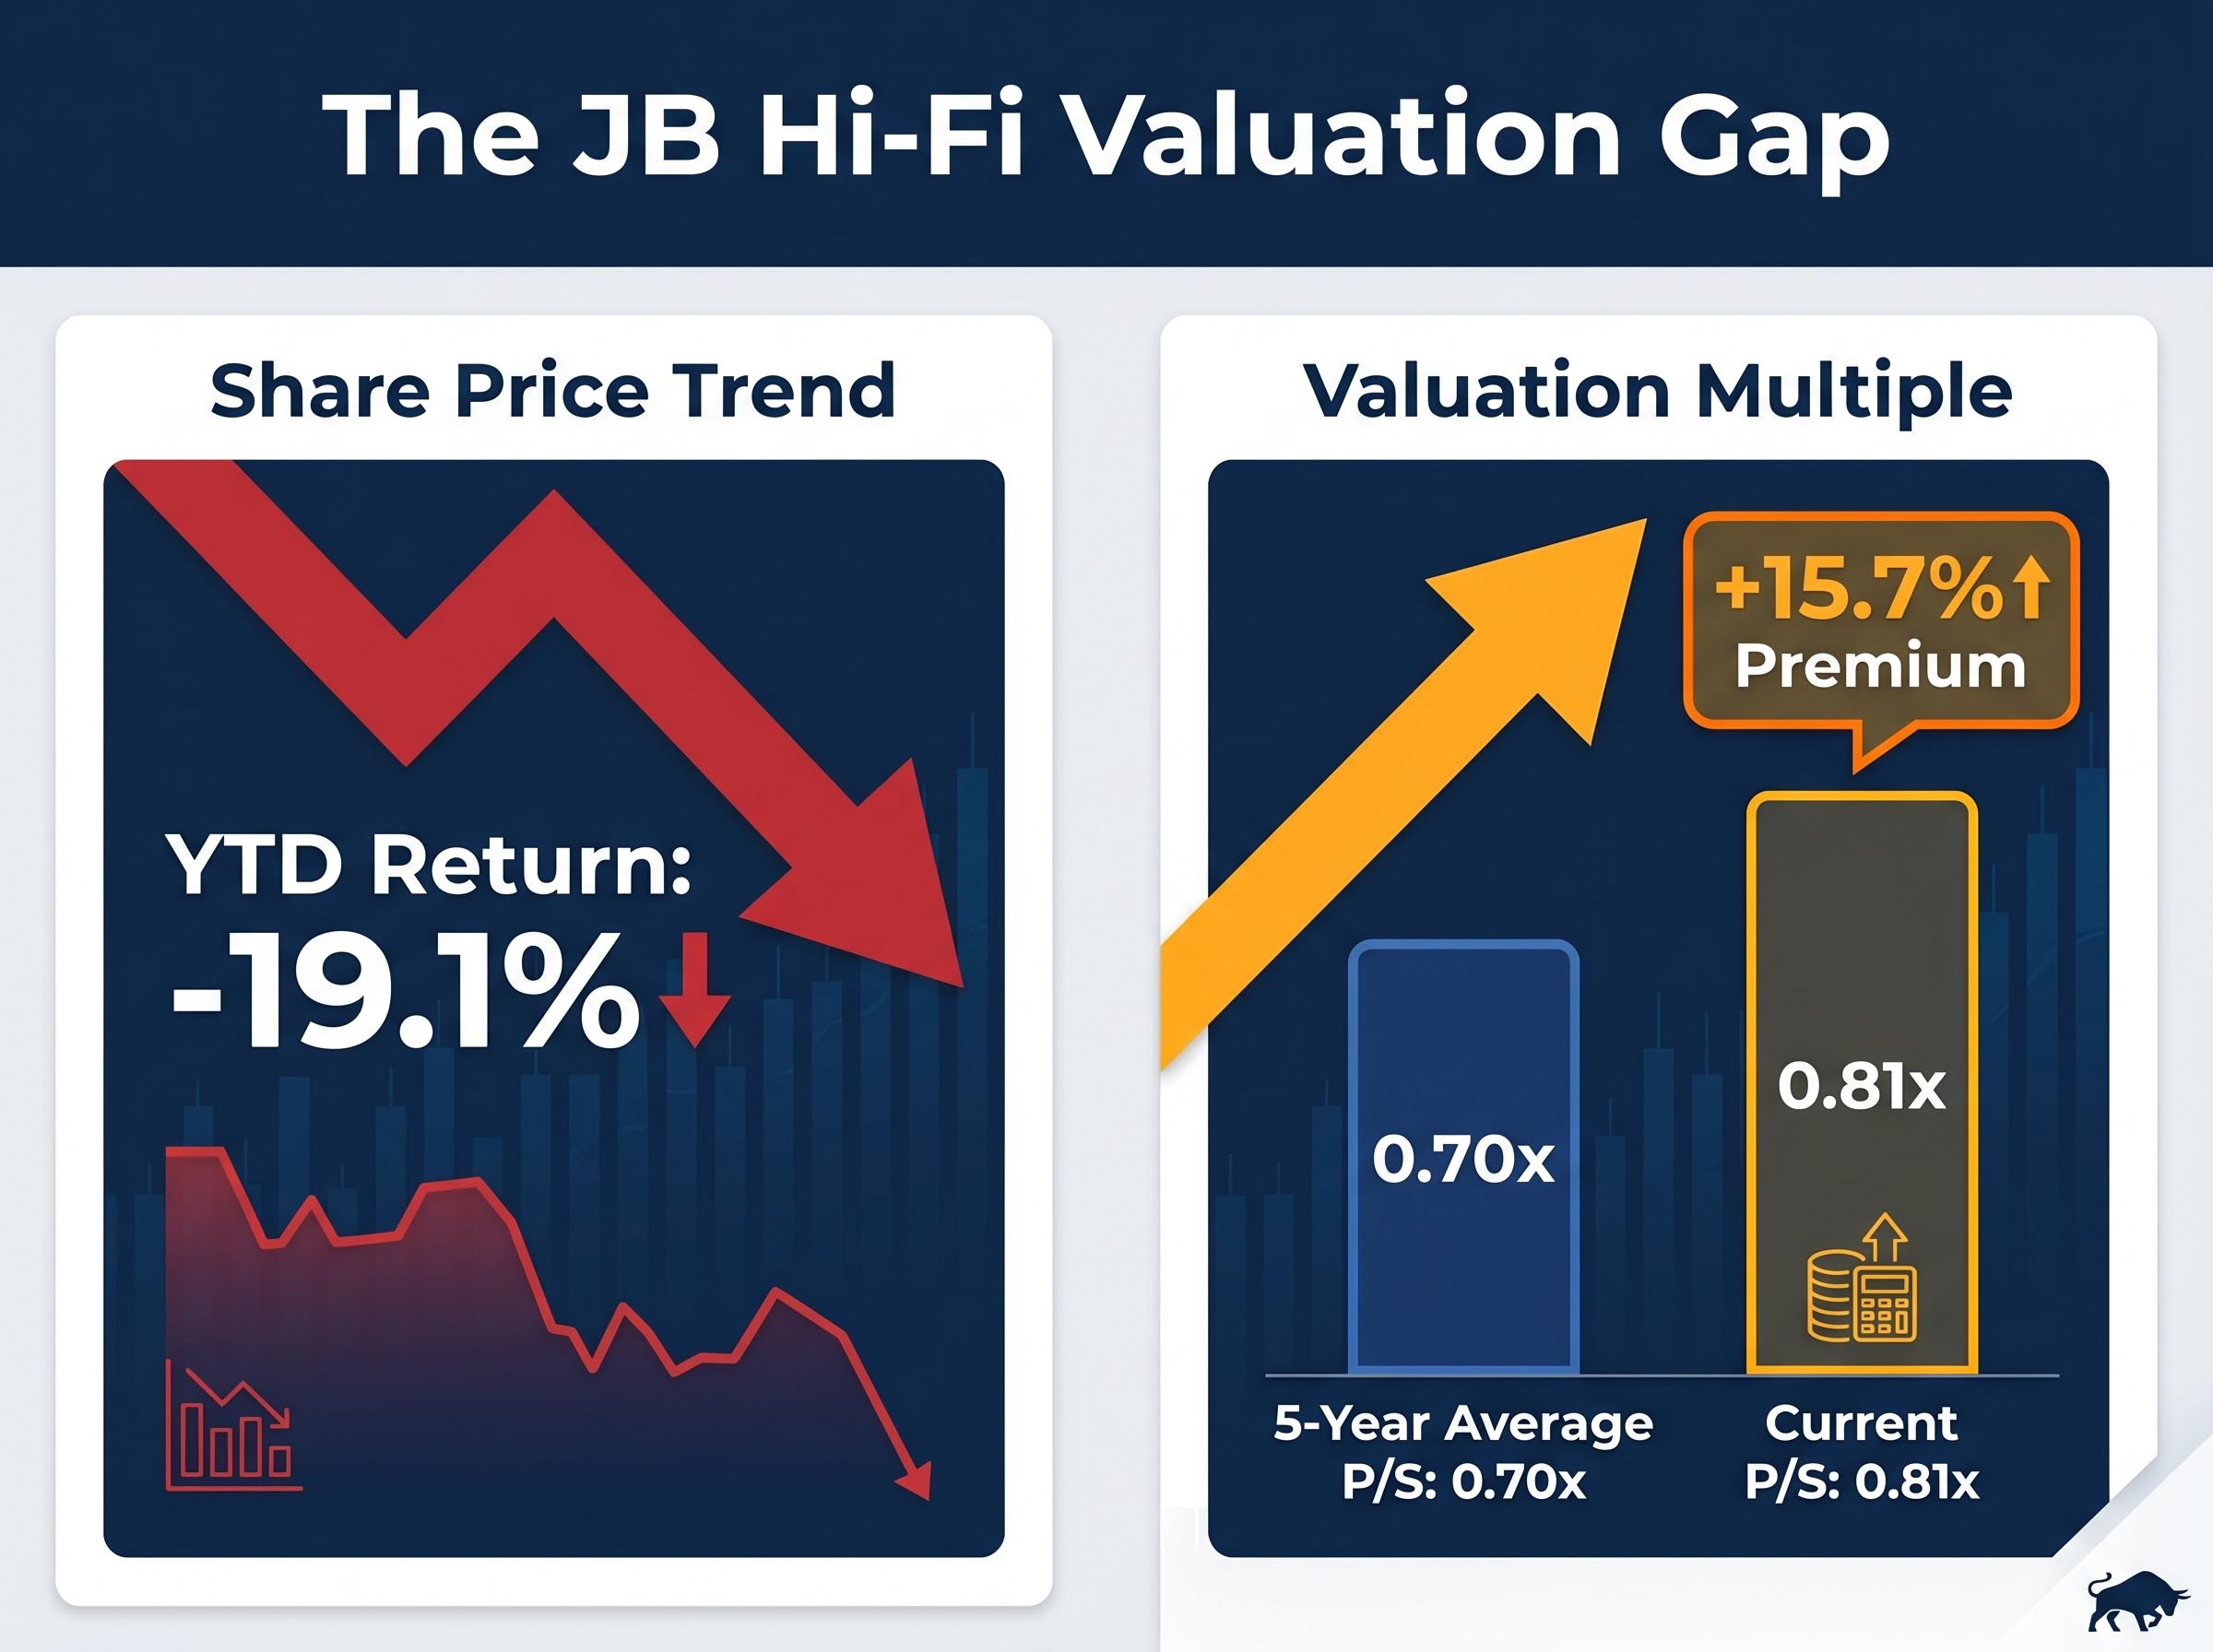
JB Hi-Fi shares closed near $71.24-$71.30 on 14 May 2026, sitting roughly 3.5% above their 52-week low. At first glance, a stock trading that close to its floor looks like it might be offering value. The valuation metrics tell a different story. JBH‘s price-to-sales ratio of 0.81x sits above its five-year historical average of 0.70x, a 15.7% premium to its own norm. That gap, between a share price near its lowest point in a year and a valuation multiple above its historical midpoint, is the tension at the centre of the JB Hi-Fi investment case right now. With a year-to-date decline of -19.1% and a one-year total return of -21.59%, the market has already repriced the stock aggressively for the Australian discretionary retail slowdown. The question is whether that repricing has gone far enough, or whether investors buying here are still paying above fair value for a business facing compressed consumer demand.
What follows is a valuation-first analysis of JBH: what the numbers say, how the business model shapes them, where the bull and bear cases diverge, and what one variable will determine which side is right.
A stock trading 3.5% above its 52-week low feels cheap. A stock trading 15.7% above its five-year average valuation multiple does not.
That is the core tension facing JBH investors in mid-2026. The share price has fallen sharply, from highs that delivered a prior 52-week return of +41.36% to a year-to-date decline of -19.1%. The market capitalisation has compressed to approximately $12.50 billion against a revenue base of $10.55 billion (FY2025 trailing twelve months). Yet the price-to-sales ratio, the metric that relates that market cap to that revenue, has not compressed to match.
| Metric | Current Value | 5-Year Historical Average |
|---|---|---|
| P/S Ratio | 0.81x | 0.70x |
| Share Price (approx.) | $71.24-$71.30 | N/A |
| YTD Return | -19.1% | N/A |
The valuation gap: JBH’s current P/S of 0.81x versus its five-year average of 0.70x means investors are paying more per dollar of revenue than they have, on average, over the past half-decade, even after a 19% share price decline.
“Cheap by price” and “cheap by valuation” are distinct concepts, and for JBH right now, they point in opposite directions. That distinction is the foundation for everything that follows.
JB Hi-Fi was founded in 1974 and ranks among Australia’s largest consumer electronics and home entertainment retailers. The business operates through three segments:
The competitive strategy across all three is cost leadership: deliberately thin margins traded for volume, price competitiveness, and customer loyalty. The financial signature of that strategy is visible in the margin stack.
Margin compression from revenue to profit: Gross margin of 22.36% narrows to an operating margin of 6.57%, which narrows further to a net profit margin of 4.38% (FY2025). For every dollar of revenue, fewer than five cents reach the bottom line.
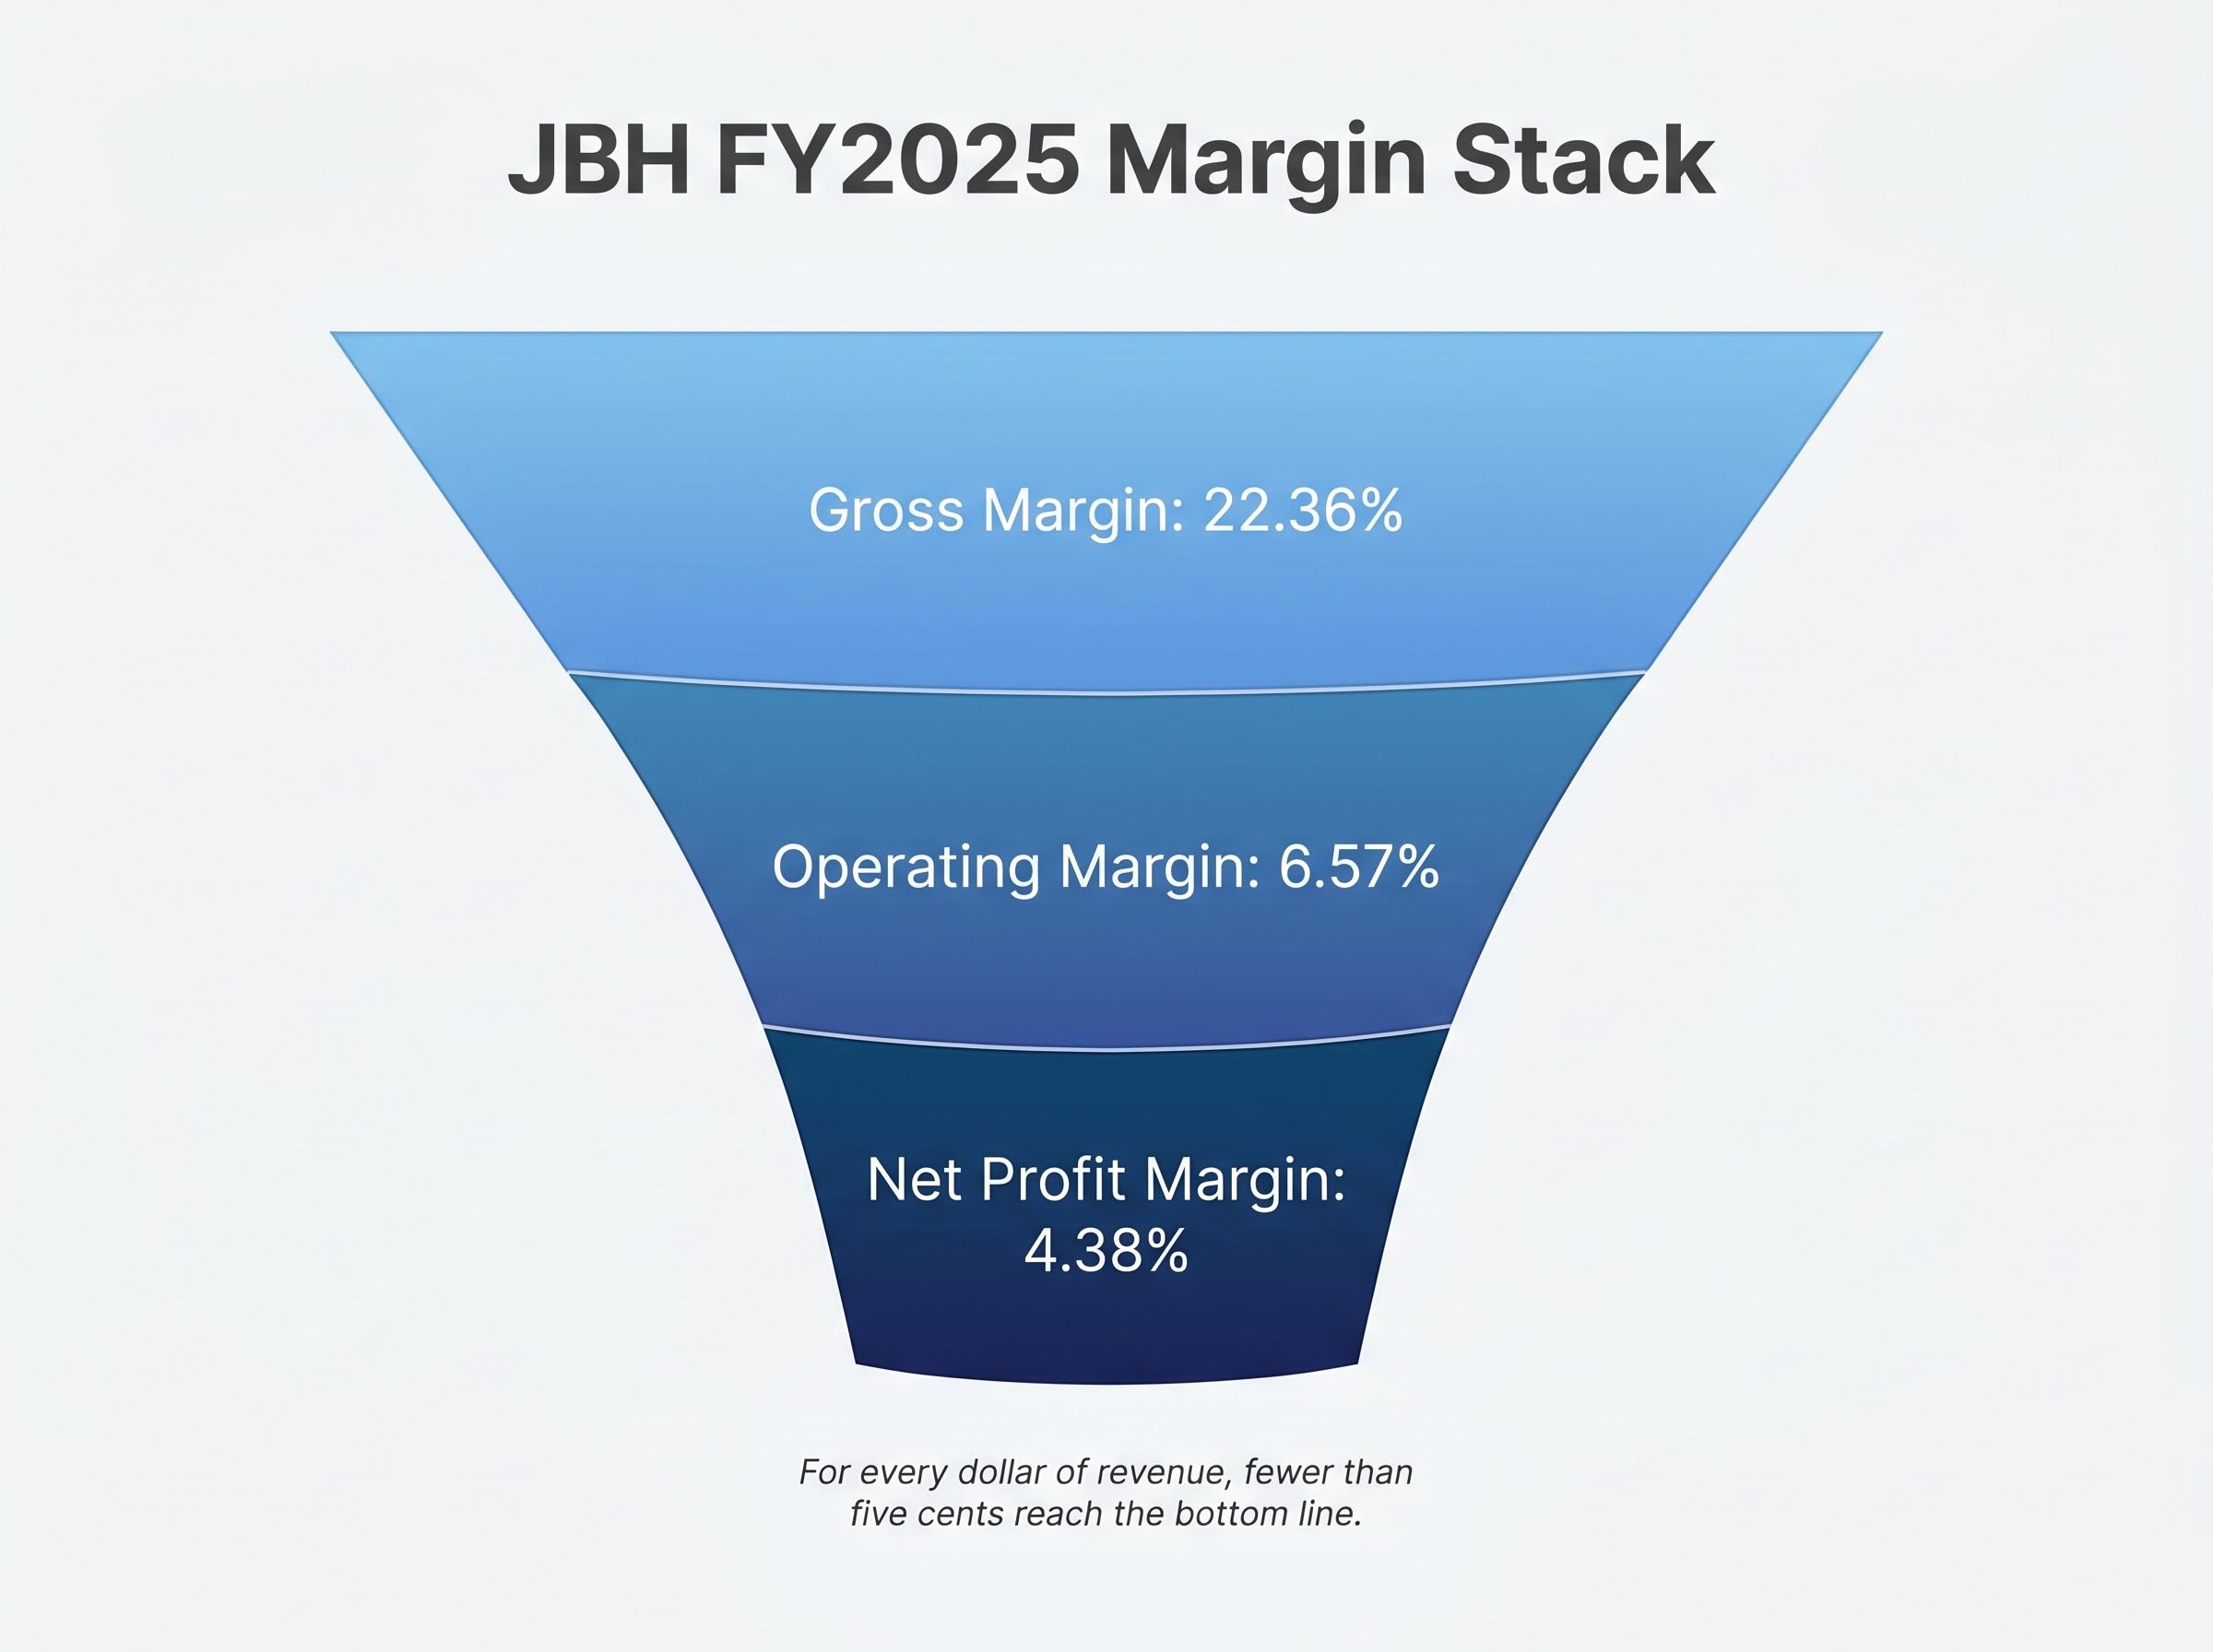
This structure is not a weakness; it is a deliberate strategic choice supported by operational efficiency. Inventory turnover of 6.85x and asset turnover of 2.86x confirm the model is executing well within its design parameters. First-half FY2026 sales of $6.085 billion demonstrate that the revenue engine continues to function even in a difficult consumer environment.
The implication for valuation is direct. When net margins are 4.38%, a 5% swing in revenue does not produce a 5% swing in earnings. It produces a much larger one. That sensitivity is why price-to-sales, rather than price-to-earnings alone, deserves close attention for a business like JBH.
The price-to-sales ratio is one of the simpler valuation tools available, but understanding what it measures, where it is useful, and where it misleads is worth the time for any investor evaluating JBH.
JBH‘s P/S of 0.81x versus the five-year average of 0.70x represents a 15.7% premium to its historical norm. Rask Education recommends using multiple valuation frameworks, including discounted cash flow (DCF) and dividend discount models (DDM), alongside simple multiples to form a complete picture.
P/S tells investors nothing about whether the revenue being generated is translating efficiently into profit. A retailer with a deteriorating gross margin could appear attractively valued on P/S while actually becoming more expensive on an earnings-adjusted basis.
For JBH, the P/E ratio provides a second signal. The trailing P/E ranges from 17.6x to 27.13x, which exceeds the Australian specialty retail sector average of 13.7x. That premium reinforces rather than contradicts the P/S caution: both metrics suggest JBH is priced above its peer group and its own historical norms. Return on equity of 29.1% partially justifies a quality premium, but the question is how much premium that quality warrants in a weak demand environment.
P/E ratio limitations are especially pronounced for thin-margin retailers like JBH, where a modest revenue decline can produce an outsized earnings collapse and make the trailing multiple appear temporarily attractive precisely when the business is most stressed; EV/EBITDA and P/FCF provide a more stable cross-check in these conditions.
The range of analyst views on JBH is unusually wide for an established ASX retailer, and each side rests on distinct assumptions.
| Case | Key Assumption | Price Target / Outcome |
|---|---|---|
| Bull (DCF/consensus) | Blended DCF and multiples analysis; growth initiatives succeed | $83.38-$92.64 |
| Bull (operating leverage) | Revenue recovers toward $12.8B; earnings reach ~$594M | Significant earnings upside |
| Bear (mature cyclical) | JBH is a mature retailer, not a growth story; macro headwinds persist | Sell (Fairmont Equities) |
| Bear (overvaluation models) | Fair value closer to $69.54; current price embeds excess premium | ~12% overvalued |
The bull case draws support from AlphaSpread’s base case fair value of $83.38 (implying 15% undervaluation versus the current $71.24), Simply Wall St’s consensus of $92.64 (implying 24% upside), a strong return on equity of 29.1%, and the 210-cent fully franked interim dividend as a management confidence signal. The e&s acquisition expands the addressable market into premium appliance segments.
The 210-cent fully franked interim dividend that management has maintained signals confidence in cash generation, and applying a dividend discount model to that income stream offers an alternative valuation lens to P/S and P/E, one that explicitly values the franking credit benefit Australian investors receive from fully franked payouts.
The bear case rests on Fairmont Equities’ Michael Gable characterising JBH as a mature cyclical retailer warranting a sell rating, and on valuation models such as Simply Wall St contributor XiaoheGong’s estimate of $69.54 fair value, implying approximately 12% overvaluation. The P/E premium to the sector average of 13.7x is difficult to sustain if consumer demand stays depressed.
The one-year return of -21.59% confirms that the market has already applied significant repricing. The question is whether it has applied enough.
The swing factor: Both cases converge on the same variable. The trajectory of Australian consumer discretionary spending, directly tied to RBA rate policy and cost-of-living conditions through 2026, determines which side is right.
The bull case for JBH is not wrong in principle. It is contingent on a macro recovery that has not yet arrived.
Three headwinds are compressing discretionary retail demand across Australia in mid-2026:
Per capita recession conditions across Australia in 2025-2026, with real wages declining approximately 0.3% and corporate insolvencies reaching their highest level since 1990-91, form the structural backdrop against which JBH’s first-half FY2026 sales holding at $6.085 billion should be read as a resilience result rather than evidence of an improving consumer environment.
The RBA’s May 2026 Statement on Monetary Policy outlines the central bank’s projections for inflation and household spending conditions, providing the clearest official view on how long elevated rates are likely to weigh on the disposable income of mortgage holders who form a core JBH customer segment.
The year-to-date share price decline of -19.1% represents the market’s aggregate assessment of this risk. Yet first-half FY2026 sales of $6.085 billion held reasonably firm, and JBH‘s beta of 0.67 reminds investors that the stock exhibits below-market volatility despite operating in a cyclical category. Management’s strategic responses, including the e&s acquisition and membership programmes, aim to diversify revenue sources against the consumer headwind.
JBH operates a large fixed-cost store and logistics network. Once revenue covers those fixed costs, additional sales fall through to profit at a disproportionately high incremental margin rate. This amplifies earnings in up-cycles and compresses them in down-cycles.
The quantum of recovery needed to activate that leverage is visible in the numbers. Trailing twelve-month revenue sits at $10.55 billion, down from a peak of approximately $12.8 billion. Analyst bull case projections assume a recovery path back toward that peak, which would deliver earnings of approximately $594 million. Operating leverage is the mechanism that makes the bullish targets credible, but it only fires when revenue is growing. In a flat or declining demand environment, the same fixed-cost structure works in reverse.
The quality indicators are not in dispute. Return on equity of 29.1%, asset turnover of 2.86x, consistent fully franked dividends, and long-term shareholder returns of +429% over ten years, +117% over five years, and +92% over three years establish JBH as one of the ASX’s highest-quality discretionary retailers.
The valuation picture is where the contest lies. The P/S ratio above its five-year average and the P/E premium to the sector average of 13.7x mean the stock is priced for earnings conditions better than those currently prevailing. That is the definition of a value trap risk: a high-quality business trading at a premium to its own historical norm during a period of below-average earnings.
The core reading: JBH is a quality business with a contested valuation. The current share price proximity to a 52-week low offers a thinner margin of safety than it appears, because the valuation multiple has not compressed to match.
Investors evaluating JBH from here should monitor four indicators:
JBH‘s proximity to a 52-week low is not the same as proximity to fair value. The P/S ratio of 0.81x, sitting 15.7% above its five-year average, is the clearest evidence of that gap.
This analysis has moved through four distinct layers: the business model’s thin-margin structure and its valuation implications; the mechanics and limits of P/S as a standalone signal; the competing bull and bear cases and the assumptions each requires; and the macro conditions that will determine which case plays out. Each layer points to the same conclusion.
The investment case for JBH improves materially if Australian consumer spending recovers, driven by potential RBA rate relief and easing cost-of-living pressures. Investors may benefit from demanding evidence of that recovery, through upcoming sales data and consumer sentiment readings, before treating the current price as a definitive buying opportunity. Supplementing this analysis with deeper valuation work, including DCF and DDM frameworks, could help form a more complete view.
This article is for informational purposes only and should not be considered financial advice. Investors should conduct their own research and consult with financial professionals before making investment decisions. Past performance does not guarantee future results. Financial projections are subject to market conditions and various risk factors.
A price-to-sales ratio (P/S) measures how much investors are paying per dollar of company revenue; for low-margin retailers like JB Hi-Fi, it is a useful valuation tool because thin net margins make earnings-based ratios more volatile and potentially misleading.
JBH shares have declined approximately 19.1% year-to-date through May 2026, reflecting the broader Australian discretionary retail slowdown driven by elevated interest rates, high fuel prices, and persistent cost-of-living pressures that are suppressing consumer spending on electronics and appliances.
Analyst estimates vary widely: AlphaSpread's base case implies a fair value of $83.38 (suggesting the stock is undervalued), while other models such as one from Simply Wall St contributor XiaoheGong place fair value at approximately $69.54, implying around 12% overvaluation at the current share price.
JB Hi-Fi operates a large fixed-cost store and logistics network, meaning that once fixed costs are covered, additional revenue converts to profit at a disproportionately high incremental margin; this amplifies earnings in revenue recoveries but compresses them sharply when demand is flat or declining.
Investors should monitor the Australian consumer sentiment index, RBA interest rate decisions, JBH comparable sales figures in its full-year FY2026 results expected around August 2026, and movement in the P/S ratio toward its 0.70x five-year historical average as a sign of genuine valuation compression.