How Fund Fees Compound Into a Six-Fold Gap in Success Rates
41 mins ago

Commonwealth Bank of Australia (CBA) shed more than 10% of its value in a single session on 13 May 2026, the kind of move that makes long-time holders reach for a calculator and new buyers start circling. The crash was not random. A federal budget targeting investor property incentives landed on the same day CBA’s own quarterly update flagged flat operating income and a A$200 million provisions top-up. The combination hit a stock that was already trading at a multiple that made many professional investors uncomfortable. The question dominating Australian investing forums, analyst desks, and social feeds is the same: does the sell-off finally make CBA cheap? What follows unpacks whether the post-crash CBA share price represents fair value or a value trap, using specific valuation metrics, peer comparisons, and policy impact modelling to give investors a clearer framework for deciding whether to buy, hold, or step back.
CBA closed at A$171.57 on 12 May. By the following session’s intraday low, shares had fallen to A$153.67. The stock settled at A$154.01, a 10.23% single-session decline that briefly stripped CBA of its position as the largest company on the ASX, handing the title to BHP.
The sell-off was not a single-catalyst event. Two forces compressed the share price simultaneously:
JP Morgan note, 13 May: “CBA’s premium gone; trading at NAB levels now but provisions signal pain.”
Before the crash, CBA’s price-to-earnings (P/E) ratio sat materially above 25x. As of the 14 May close, CBA trades at A$153.92, with a P/E of 25.1x on FY27 estimated earnings per share (EPS) of A$6.13. A 52-week low of A$151.00 was touched on the morning of 14 May before a partial recovery to approximately A$154.50.
The scale of the 13 May sell-off is best understood against the pre-crash Big Four valuations that had already drawn unanimous sell ratings from analysts covering CBA, with all 14 brokers in coverage carrying sell ratings and an average price target of approximately A$130 as recently as late April 2026, a consensus that now looks prescient rather than contrarian.
The distinction matters for anyone considering buying the dip. The crash compressed the share price, but it did not reset the earnings base. The P/E denominator, the number that determines whether the multiple is justified, faces its own set of pressures.
A P/E ratio of 25.1x means an investor buying CBA today is paying $25.10 for every $1 of expected annual earnings. Compare that to a stock trading at 12x: the same dollar of earnings costs less than half the price. For CBA, the question is whether the bank’s earnings quality and growth profile justify that premium, or whether the market has been overpaying for perceived safety.
P/E captures the relationship between price and profits. For banks, though, a second metric often tells a sharper story.
Technology companies hold few hard assets, so book value is a poor proxy for what the business is actually worth. Banks are different. A bank’s core business is managing a leveraged balance sheet of loans and deposits, and book value represents a reasonable approximation of what shareholders actually own.
CBA’s price-to-book (P/B) ratio sits at 3.8x, based on a book value of A$40.52 per share. That means the market is pricing CBA at nearly four times the value of its underlying assets. A high P/B is only defensible if the business generates a sustainably high return on equity (RoE), the measure of how effectively the bank turns shareholder capital into profit.
CBA’s RoE is 15.2%. JPMorgan Chase, by comparison, generates a 16.0% RoE but trades at a P/B of just 1.9x.
For investors applying this lens, the test is straightforward:
Investors wanting to build their own fair value range for CBA rather than relying solely on broker consensus targets will find our comprehensive walkthrough of ASX bank valuation methods covers the PE, P/B, Dividend Discount Model, and DCF frameworks in sequence, including the Australian-specific adjustments for franking credits and APRA capital requirements that make direct comparisons with international bank peers systematically misleading without them.
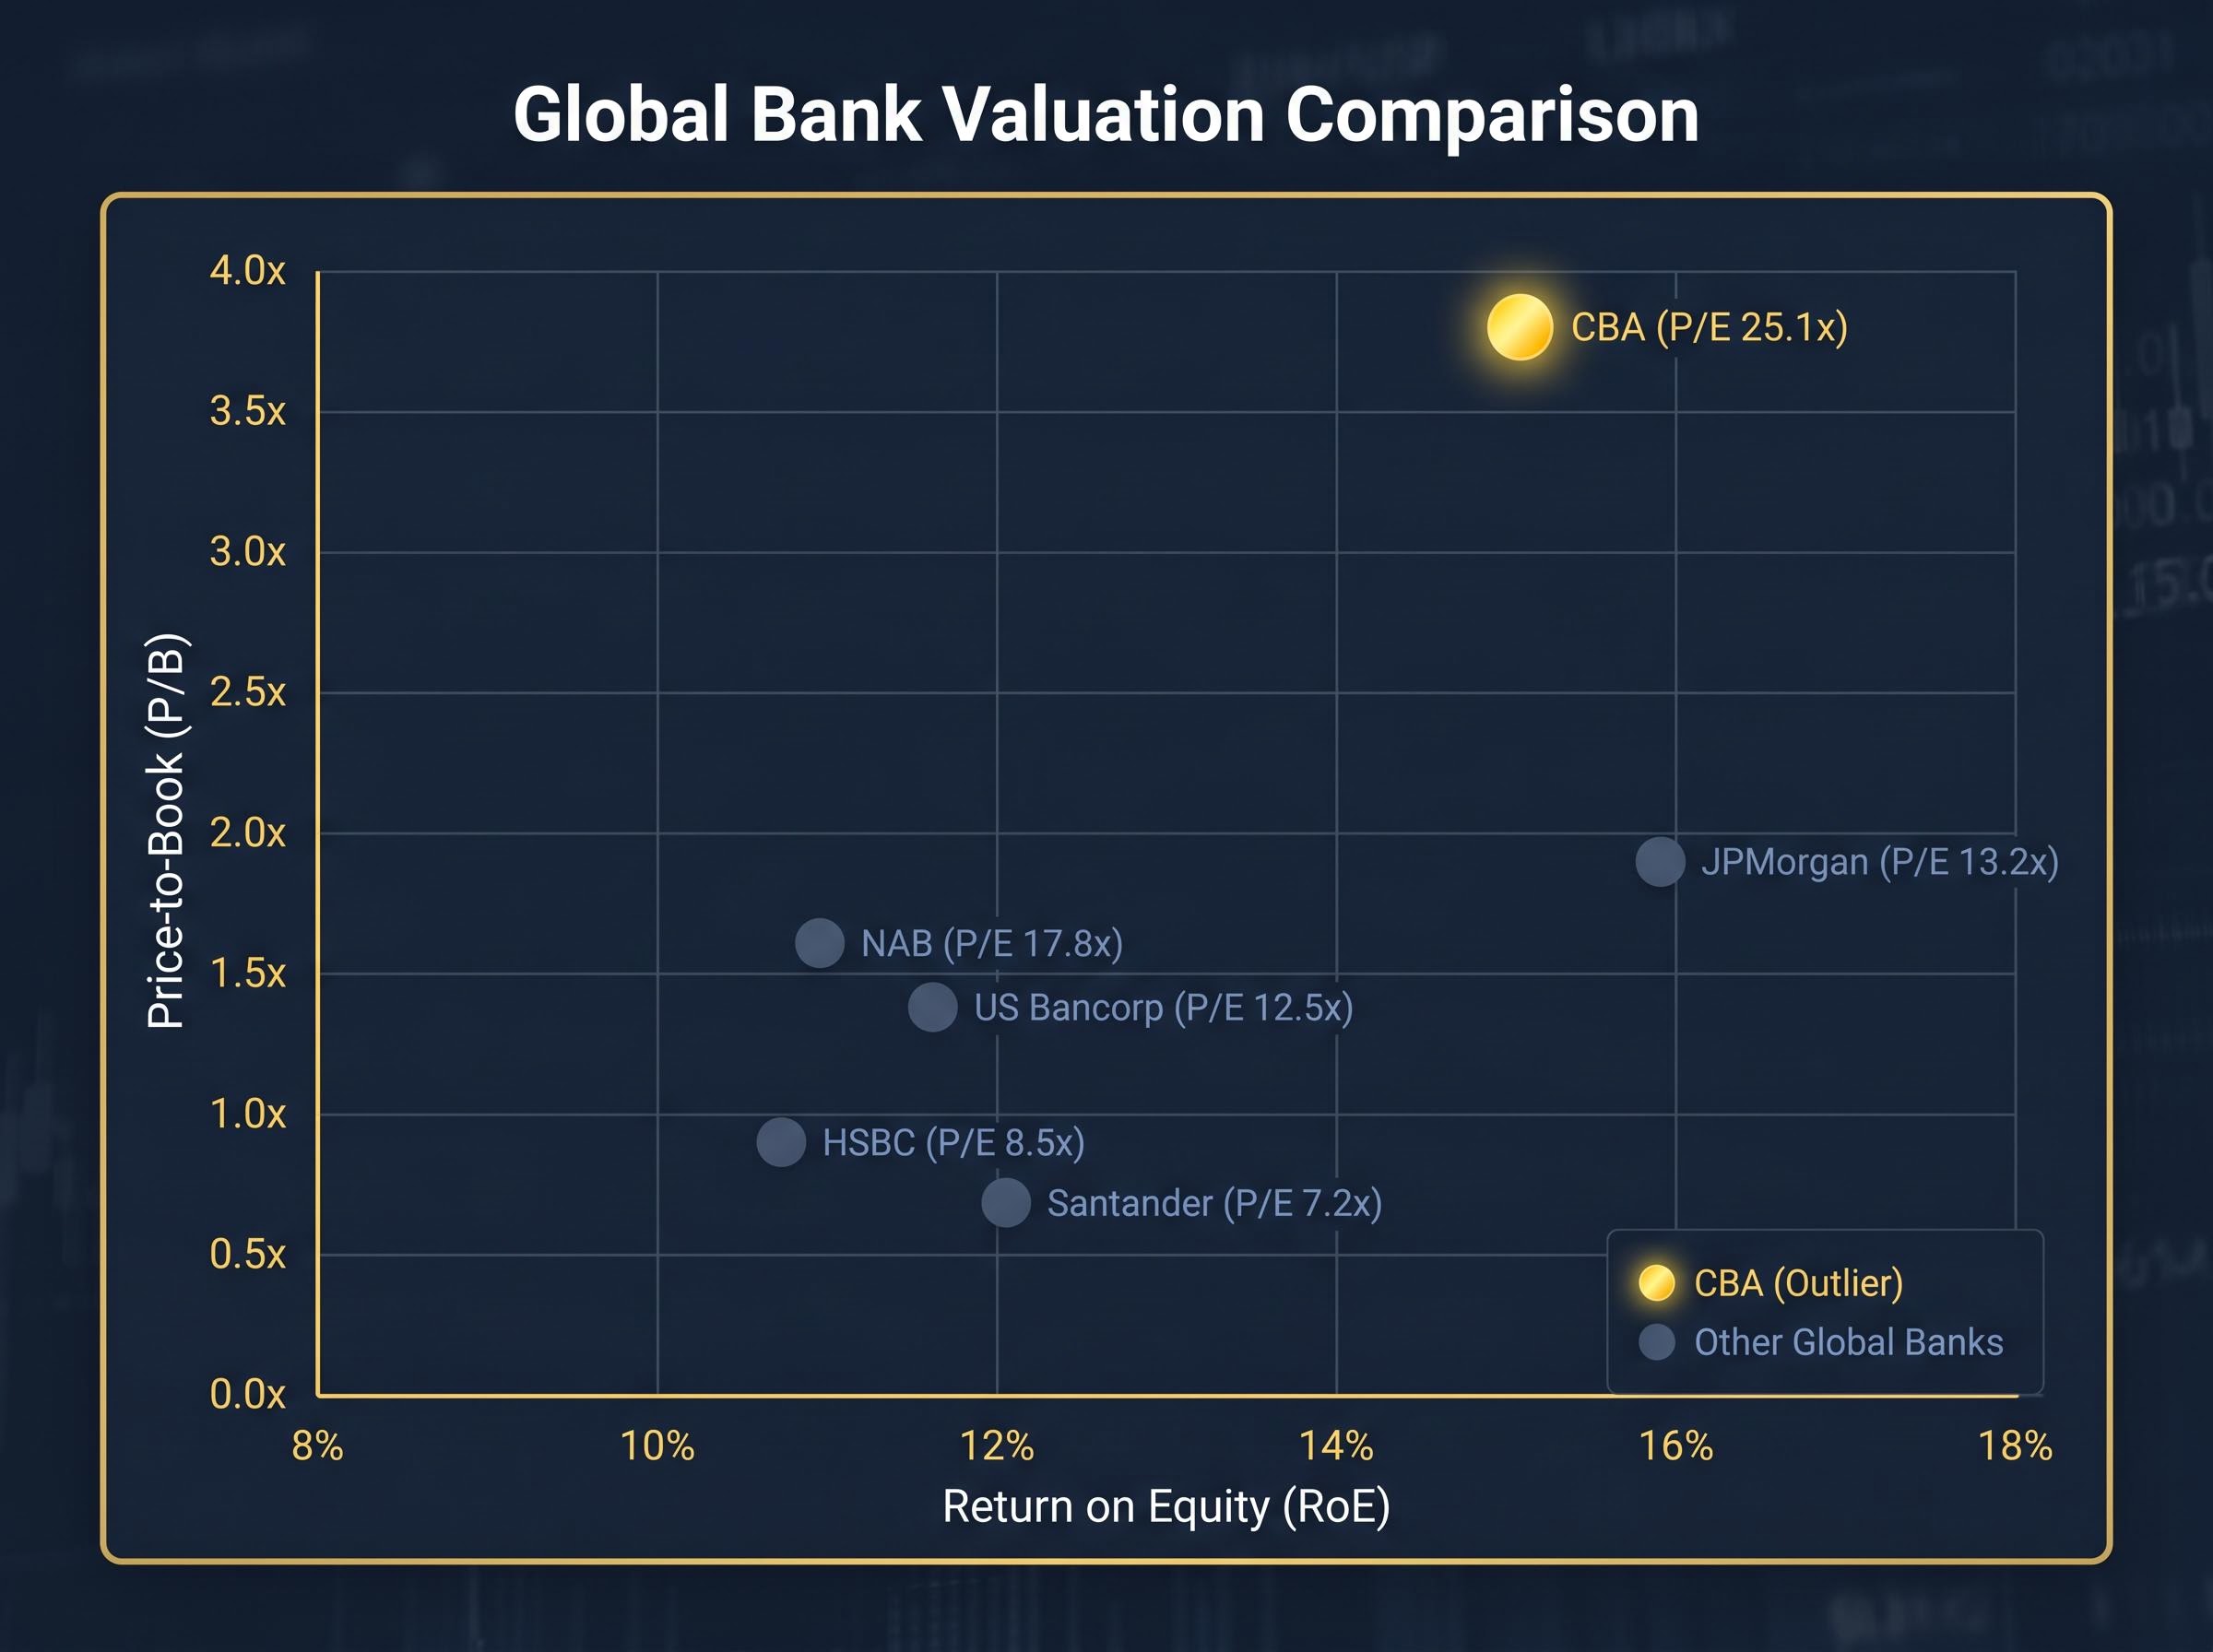
The domestic gap is the starting point. National Australia Bank (NAB) trades at 17.8x earnings with a 1.6x P/B and an RoE of 11.0%. CBA’s P/E sits 1.4x above NAB’s, a premium Goldman Sachs’ AU Banks team described on 14 May as “unsustainable” given that peers average a P/E of 12x on lower provisions risk.
The global comparison widens the gap further.
| Bank | Market | P/E (FY27E) | P/B | RoE (%) |
|---|---|---|---|---|
| CBA | ASX | 25.1x | 3.8x | 15.2 |
| NAB | ASX | 17.8x | 1.6x | 11.0 |
| JPMorgan | US | 13.2x | 1.9x | 16.0 |
| US Bancorp | US | 12.5x | 1.4x | 11.5 |
| HSBC | UK | 8.5x | 0.9x | 10.8 |
| Santander | Spain | 7.2x | 0.7x | 12.1 |
The paradox sits in the JPMorgan line. A bank with a higher RoE than CBA (16.0% versus 15.2%) trades at roughly half the P/B multiple. Santander generates a 12.1% RoE and trades at 0.7x book, a fraction of CBA’s 3.8x.
The P/E and P/B comparison captures the valuation gap between CBA and its peers, but NIM and CET1 capital ratios determine whether that gap reflects genuine earnings quality differences or simply accumulated market sentiment; NAB’s H1 2026 NIM of approximately 1.71% sits below the sector average of 1.78%, while CBA’s relative NIM advantage is one of the structural justifications its bulls have historically cited for the premium.
According to UBS’s “Global Banks Outlook” note on 13 May, Australian banks trade at a 40% P/B premium to US and UK peers despite similar RoE profiles. UBS suggested the budget may begin to normalise that premium toward 3x.
Morningstar data reinforces the picture: the ASX Big Four average a P/B of 2.8x versus a global bank average of 1.5x. CBA sits well above even that elevated domestic average. For additional context, CBA trades at a higher P/E than Meta Platforms (22.4x), despite being a mature, regulated bank rather than a high-growth technology platform.
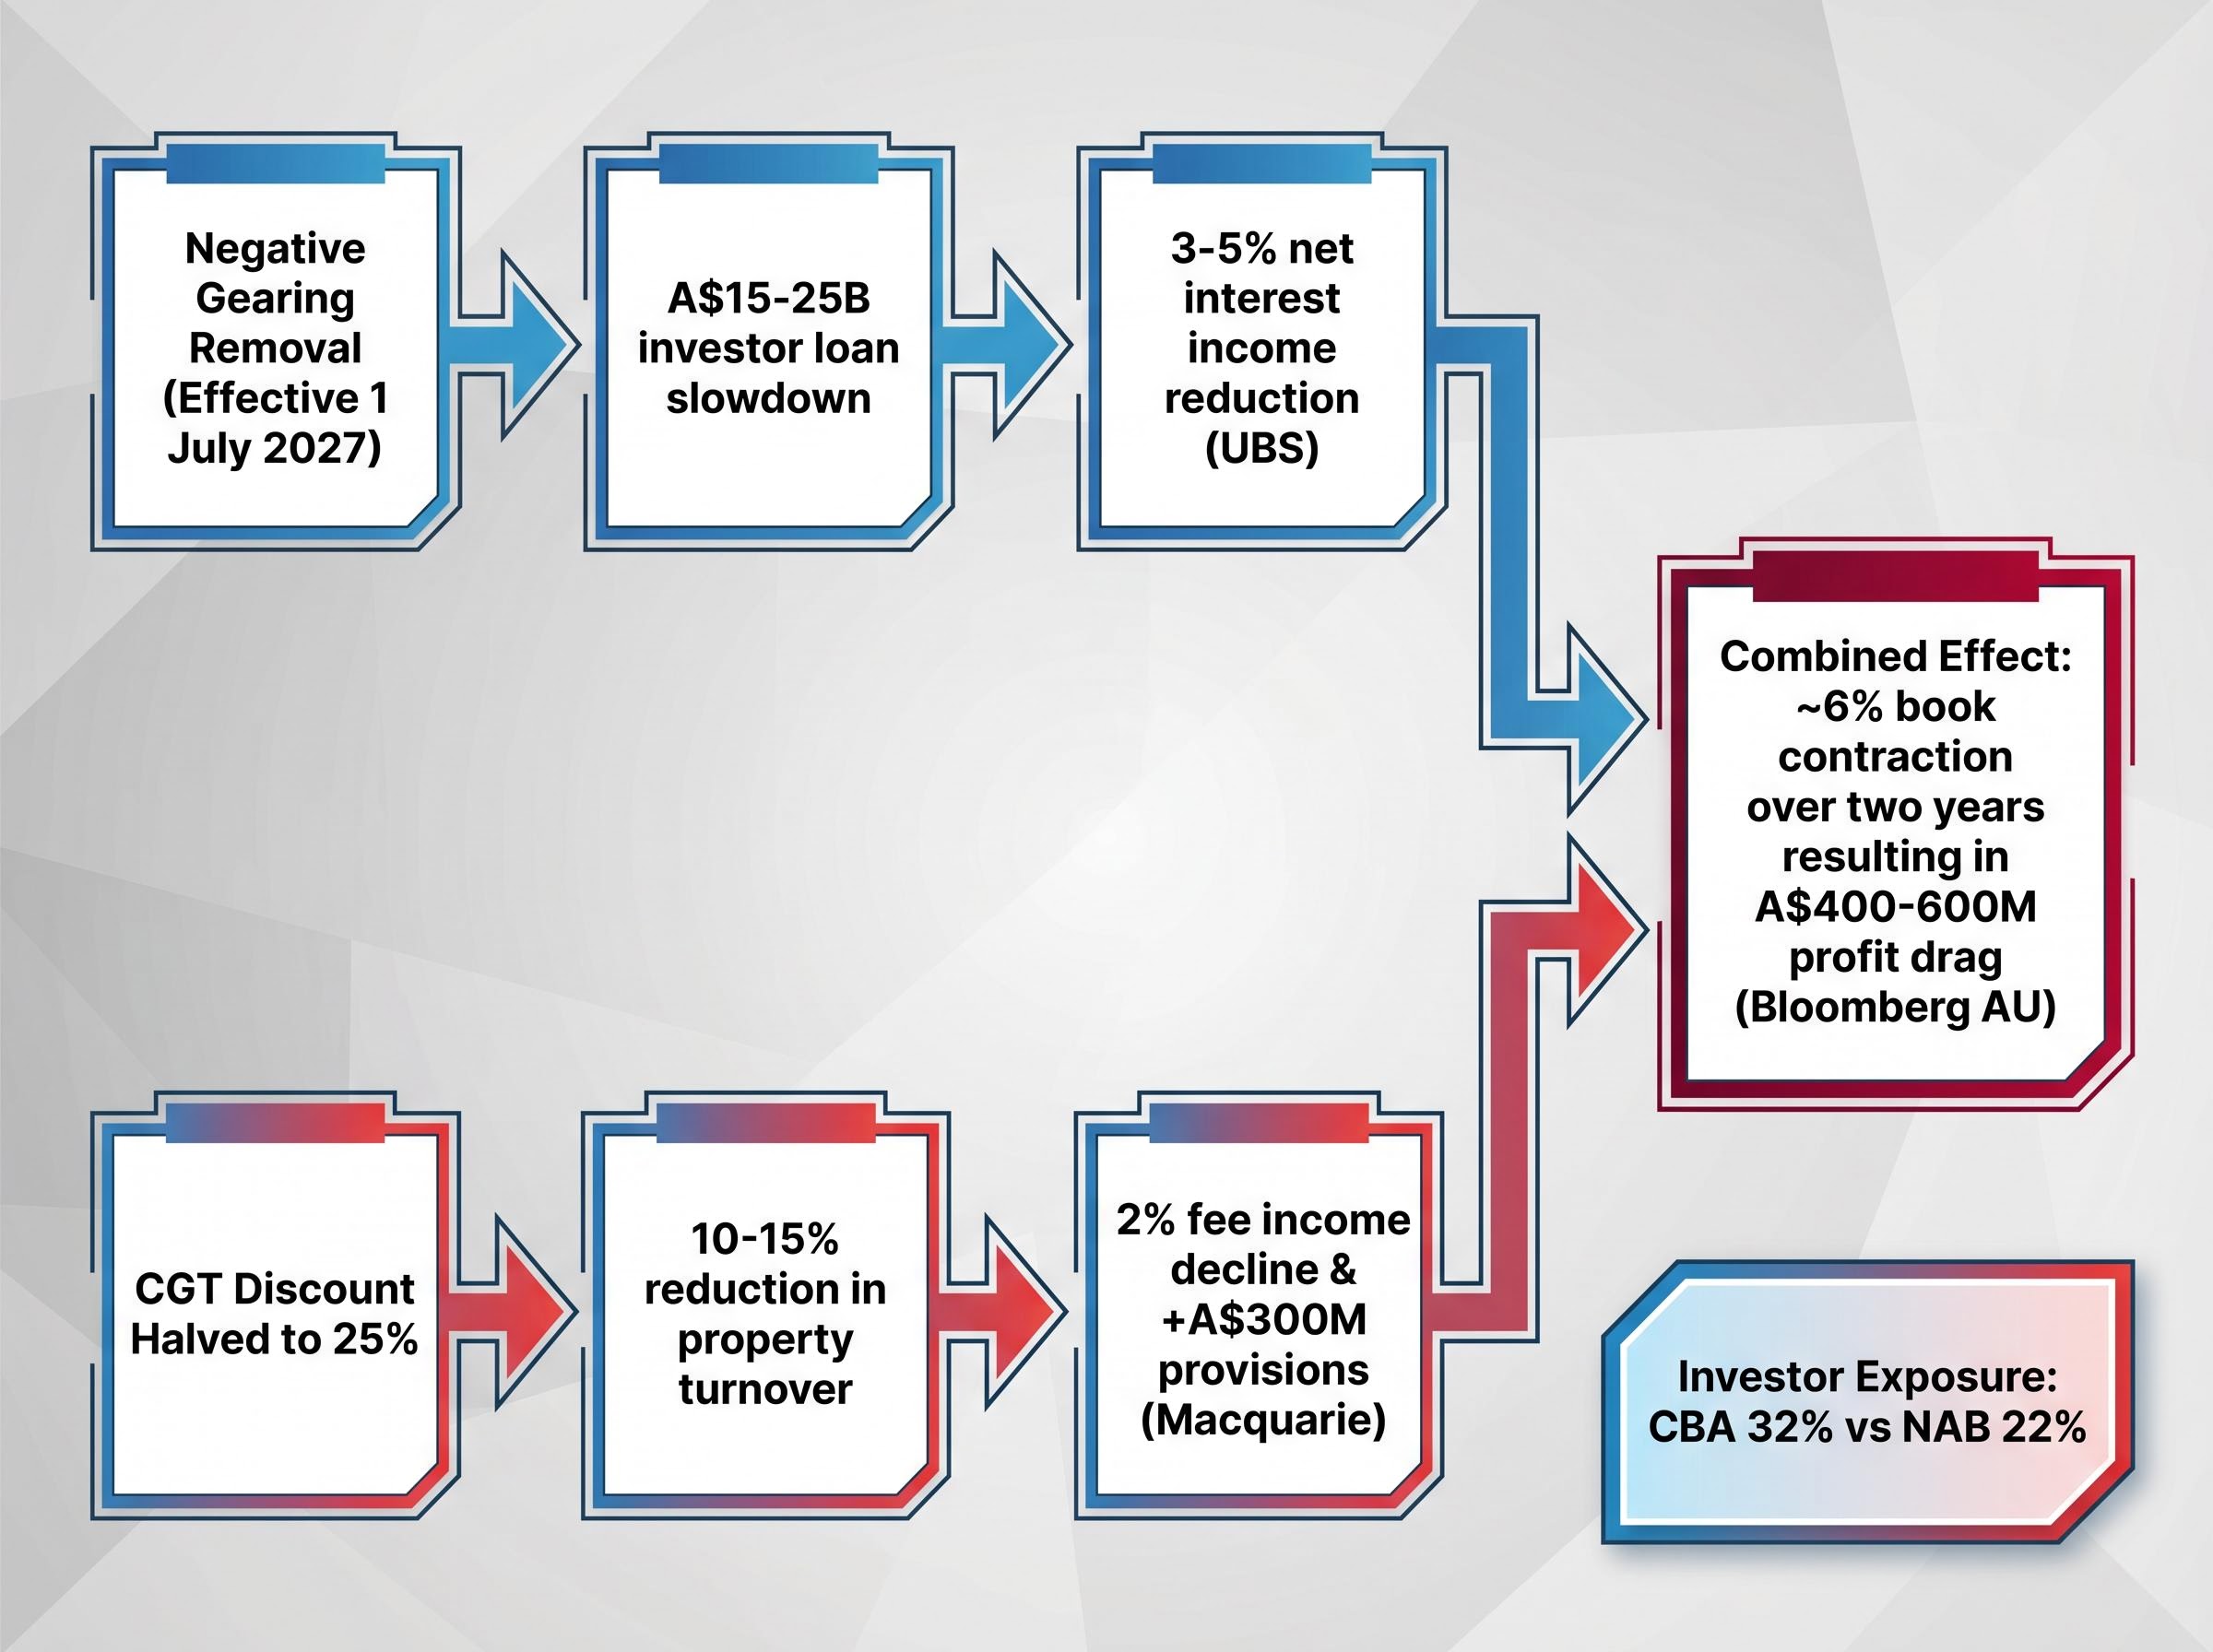
CBA’s mortgage book exceeds A$400 billion, with investor lending comprising approximately 25% of the total. That concentration is the reason the budget’s two property-focused policy changes hit CBA harder than any other Big Four bank.
Negative gearing allows property investors to offset rental losses against other income, reducing their taxable income and making leveraged property purchases more attractive. Its removal, effective 1 July 2027, strips that incentive. Property investors who relied on the tax offset to make negative-cashflow holdings viable face a fundamentally changed equation.
PwC Australia’s federal budget tax analysis confirms that from 1 July 2027 negative gearing will be limited for established residential properties acquired after 12 May 2026, and that the 50% CGT discount will be replaced by cost base indexation for assets held beyond 12 months, materially altering the after-tax equation for leveraged property investors.
The halving of the CGT discount from 50% to 25% compounds the pressure. A lower after-tax gain on sale suppresses property turnover and, with it, new loan origination. Fewer transactions mean fewer mortgages written.
Macquarie’s van der Merwe told the AFR on 14 May: “Investor retreat hits CBA hardest, 32% exposure vs. NAB’s 22%.”
The earnings impact is where the valuation case becomes uncomfortable.
| Policy Change | Mortgage Book Hit | Earnings Impact (FY27E) |
|---|---|---|
| Negative gearing removal | A$15-25B investor loan slowdown | 3-5% net interest income reduction (UBS) |
| CGT discount halving | 10-15% reduction in property turnover | 2% fee income decline; +A$300M provisions (Macquarie) |
| Combined effect | ~6% book contraction over two years | A$400-600M profit drag (Bloomberg AU) |
UBS and Macquarie modelling projects a 5-8% contraction in CBA’s mortgage book over two years. CBA’s own Q3 ASX update on 13 May acknowledged the direction of travel, flagging the A$200 million provisions top-up partly attributable to “policy headwinds.” A valuation case for CBA must now account for whether the earnings base will shrink before it grows again.
The post-crash analyst target range maps a narrow band of disagreement, but the tone within that band is telling.
| Broker | Target Price | Rating | Change from Pre-Crash |
|---|---|---|---|
| Goldman Sachs | A$165 | Buy | Trimmed from A$178 |
| Macquarie | A$160 | Neutral | Cut from A$172 |
| JPMorgan | A$162 | Neutral | Downgraded from Overweight |
| UBS | A$158 | Sell | Maintained |
| Consensus (10 brokers) | A$162.40 | Hold | — |
Even the bull case, Goldman Sachs at A$165, implies the stock remains materially below pre-crash levels. The bear case from UBS at A$158 sits only A$4 above the current price. Consensus at A$162.40 implies approximately 5.5% upside, a thin margin for a stock facing an unresolved policy overhang.
Institutional activity reinforces the caution:
Perpetual’s Ryan told the AFR on 14 May that CBA appeared “fairly valued at 23x but risks 20% downside on budget.” Magellan’s Byrne flagged A$150 as the support level under monitoring. Retail sentiment tracked a similar line: HotCopper’s top-rated post called the 25x P/E a “joke post-budget,” with the consensus waiting for A$140. A Livewire poll showed 55% of respondents favouring sell or hold.
When professional scepticism and retail bearishness align, the conditions for a swift recovery bounce historically weaken.
The crash moved the price. It did not move the earnings trajectory. At A$153.92 and FY27E EPS of A$6.13, the P/E sits at 25.1x. If the A$400-600 million profit drag from the budget’s property policies materialises, EPS could fall toward A$5.80-5.90, pushing the effective forward P/E above 26x. The P/B of 3.8x remains the highest of any major bank globally at a comparable RoE.
The consensus target of A$162.40 implies approximately 5.5% upside from current levels, a thin margin given the policy uncertainty.
For CBA at A$154 to be genuinely cheap, several conditions would need to hold:
For CBA at A$154 to prove a value trap, a different set of conditions applies:
ASX 200 bank concentration risk compounds the CBA decision for investors who already hold domestic index funds or superannuation with an Australian equity tilt, since the Big Four collectively represent roughly 25% of the entire index, meaning a position in CBA alongside broad ASX exposure can push total bank allocation well above 40% of a domestic equity portfolio without the investor registering it as a concentrated sector bet.
Three data points will determine which scenario unfolds in coming months:
The crash created a lower entry point. Whether it created a good one depends on numbers that have not yet been reported.
This article is for informational purposes only and should not be considered financial advice. Investors should conduct their own research and consult with financial professionals before making investment decisions. Past performance does not guarantee future results. Financial projections are subject to market conditions and various risk factors.
Price-to-book (P/B) ratio compares a bank's share price to the net value of its assets per share. CBA's P/B of 3.8x means investors are paying nearly four times the value of the bank's underlying assets, a premium that is only justified if the bank sustains a high return on equity over time.
Two events hit simultaneously: the federal budget announced the removal of negative gearing (effective 1 July 2027) and halved the capital gains tax discount to 25%, both targeting investor property demand, while CBA's own Q3 update disclosed flat operating income and a A$200 million provisions top-up citing policy headwinds.
CBA's mortgage book exceeds A$400 billion, with investor lending making up approximately 32% of total exposure. Removing negative gearing strips a key tax incentive for leveraged property buyers, and UBS and Macquarie modelling projects a 5-8% contraction in CBA's mortgage book over two years as investor demand retreats.
A 10-broker consensus sets a target of A$162.40, implying approximately 5.5% upside from the post-crash price near A$154. Goldman Sachs holds the most optimistic target at A$165 (Buy), while UBS has the lowest at A$158 (Sell).
CBA trades at a P/E of 25.1x and a P/B of 3.8x, while JPMorgan trades at 13.2x earnings and 1.9x book despite generating a higher return on equity of 16.0% versus CBA's 15.2%, highlighting that CBA carries a significant premium relative to comparable global banks.