BofA Forecasts $2.7 Trillion Semiconductor Market by 2030
11 mins ago

WTI crude fell 1.86% overnight on 6 May 2026, settling at $100.37 per barrel, even as the Strait of Hormuz sat effectively closed and a 400,000-barrel-per-day Russian refinery burned. The global oil market, it seems, is caught between two realities at once. Three geopolitical events are colliding simultaneously: a fragile US-Iran ceasefire agreed on 8 April that is already showing strain, a de facto shutdown of the world’s most strategically important oil chokepoint, and a Ukrainian drone strike that has knocked Russia’s Kirishi refinery offline. Each event would move markets independently. Together, they are producing a pricing paradox that is confounding institutional forecasters. This analysis explains what each disruption means on its own, why prices are behaving counterintuitively in the short term, and what the structural supply picture looks like for investors making energy allocation decisions through mid-2026.
The overnight price drop tells a clean story on the surface. WTI fell 1.86% to $100.37 per barrel. Brent declined roughly 3.3% overnight to approximately $108.77, though it remained up about 1% on the week. The catalyst was the US-Iran ceasefire agreed on 8 April 2026, which continues to hold in a narrow technical sense. Markets treated the absence of fresh escalation as permission to unwind risk premium.
The ceasefire agreed on 8 April did not arrive in a vacuum: it followed the Hormuz closure in late April that drove Brent above $125 per barrel on 30 April 2026, the highest intraday level in approximately four years, as the IEA estimated roughly 13 million barrels per day had been removed from global circulation at the peak of the disruption.
The underlying facts tell a different story. Iran has been testing the ceasefire’s boundaries. The US is preparing contingency plans for a potential resumption of military operations. Israeli Defence Minister Katz stated publicly that military action against Iran may be required again in the near future. Most critically, Project Freedom, the US naval escort operation designed to guide commercial vessels through the Hormuz Strait, was paused as of 5 May 2026.
That pause is the single most important fact undermining the relief trade.
Chevron CEO Mike Wirth characterised the Strait of Hormuz as having “remained effectively closed,” with fuel shortages a growing concern in certain regions.
If the ceasefire were genuinely stabilising the region, Project Freedom would be expanding, not pausing. The operational signal contradicts the price signal, and investors selling energy exposure on ceasefire headlines may be pricing in a durability that the facts do not support.
J.P. Morgan’s Brent target of $60 per barrel was published on 27 February 2026, weeks before the Hormuz disruption reached its current severity. The bank assessed at the time that “protracted disruptions to oil supply are unlikely,” citing soft supply-demand fundamentals. Brent now sits more than $48 above that target. This is not a criticism of the bank’s analytical framework; it is evidence of how rapidly the geopolitical situation has outpaced institutional modelling. Any investor still anchoring portfolio decisions to that February forecast is working with a map that no longer describes the territory.
Under normal conditions, approximately 20% of global seaborne oil trade transits the Strait of Hormuz. As of 5 May 2026, throughput is effectively near zero. The conditional ceasefire has not translated into resumed commercial shipping; tanker operators and insurers have not been willing to treat the route as safe.
The physical consequences are already visible. Iraq is offering significant price discounts to term buyers on May-loaded crude, conditional on tankers being willing to transit the strait. That conditionality reveals how commercially toxic the route has become. Buyers can access cheaper crude, but only if they accept a risk that most operators currently refuse.
The commercial paralysis documented by Chevron’s CEO reflects more than a binary open-or-closed assessment of the waterway: the triple lock on Hormuz transit, combining US naval blockade operations, Iranian toll enforcement on non-US and non-Israeli vessels, and the near-total withdrawal of commercial war risk insurance, has made the strait commercially unusable even for operators willing to navigate the physical risk.
Goldman Sachs has warned of accelerating depletion in three refined product categories:
The bank identified localised shortage risks in four specific regions:
| Region | Refined product at risk | Shortage risk status |
|---|---|---|
| South Africa | Jet fuel, naphtha | Elevated |
| India | LPG, naphtha | Elevated |
| Thailand | Jet fuel, LPG | Elevated |
| Taiwan | Naphtha, LPG | Elevated |
Goldman Sachs estimates global oil inventories are declining, though the specific days-of-coverage figures cited in some reports have not been independently confirmed. The EIA has characterised the market as being in “a period of heightened volatility and uncertainty.” The Hormuz closure is not a temporary blip; it is reshaping physical crude routing and compressing the inventory buffer faster than consensus demand models anticipated.
The Strait of Hormuz is a narrow waterway connecting the Persian Gulf to the Gulf of Oman and, from there, the open ocean. It is the only sea route out of the Gulf for Saudi Arabia, Iraq, Iran, Kuwait, and the UAE. When it functions normally, roughly 20% of the world’s seaborne oil passes through it. When it does not function, there is no maritime alternative.
IEA data on Hormuz seaborne oil volumes recorded that approximately 25% of the world’s seaborne oil trade transited the strait in 2025, a figure that underscores why the current effective closure is compressing global supply buffers at a pace that demand-side adjustments alone cannot offset.
Bypass pipelines exist, but they carry only a fraction of the strait’s normal volume:
Combined, these two bypass routes handle a fraction of normal daily Hormuz throughput. Precise figures on current utilisation are not publicly available from the IEA or Lloyd’s List, and the analysis should be read with that data gap in mind. What is clear directionally is that neither pipeline, nor both together, can compensate for a full closure of the strait.
The IEA’s April 2026 report forecast global crude runs at 82.9 million barrels per day average for 2026, down approximately 1 million barrels per day year-over-year. WTI traded in an observed range of $79-$118 per barrel during April 2026, with analyst consensus identifying a floor near $80 and a ceiling near $120. For investors, the distinction matters: the Hormuz disruption is a structural supply event, not a sentiment event. Headlines claiming the closure is temporary or manageable need to be evaluated against the physical reality that no bypass infrastructure exists at sufficient scale to replace the strait’s throughput.
The Kirishi refinery, one of Russia’s largest, processes approximately 400,000 barrels per day. Ukrainian drone strikes in late March 2026 halted operations and ignited fires across multiple production units. Subsequent attacks as of 5 May 2026 have caused further damage, and the facility remains offline.
This disruption compounds an already constrained Russian supply picture. Approximately 70% of Russian crude is now subject to international sanctions, limiting both the volume and the routing options available to Russian exporters. The Kirishi damage removes refining capacity on top of those constraints.
The distinction between the two simultaneous disruptions matters:
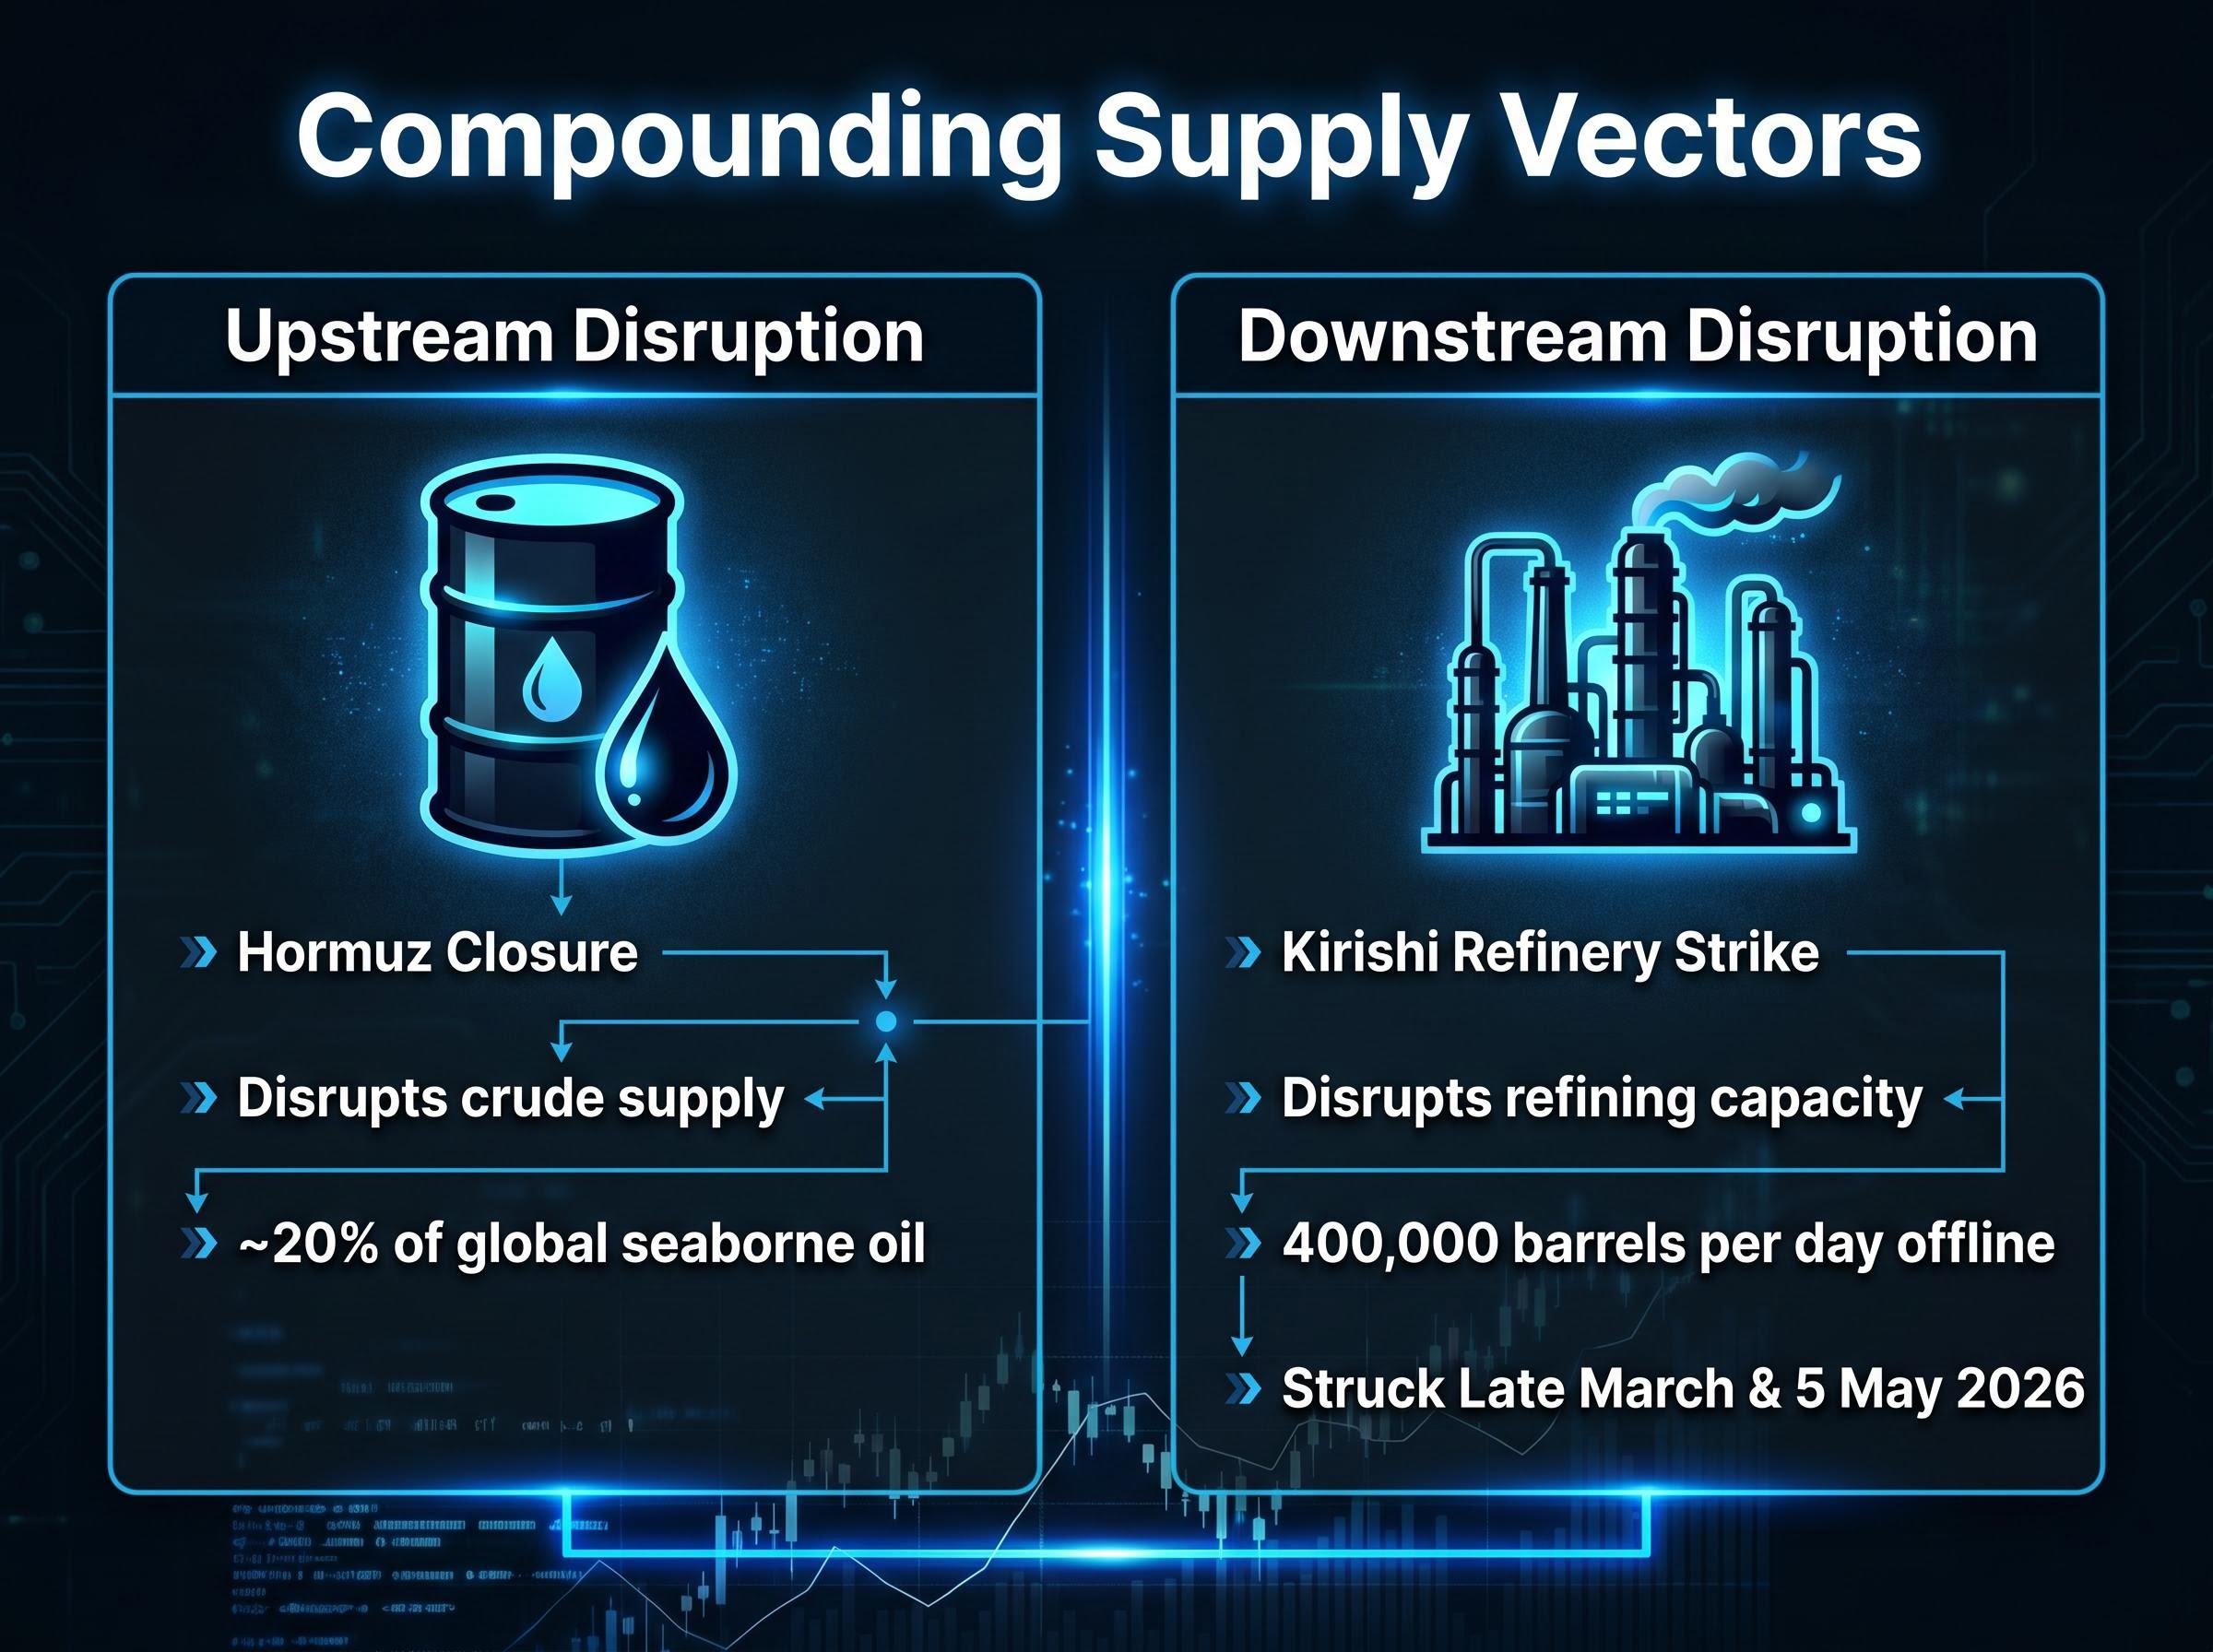
Goldman Sachs has forecast a shift from a 1.8 million barrels per day surplus in 2025 to a 9.6 million barrels per day deficit in Q2 2026, driven by tightening supply conditions.
The IEA noted in its 14 April 2026 report that refining margins are temporarily elevated due to supply tightness. The Kirishi disruption tightens refined product supply precisely when downstream inventories are already being drawn down by the Hormuz closure. Crude-only price analysis misses this compounding effect. The simultaneous tightening of both upstream crude and downstream refining capacity creates a qualitatively different market environment than either disruption would produce alone.
The Kirishi disruption’s tightening of refined product supply feeds into a broader economic cascade that is simultaneously reshaping corporate earnings, airline viability, and Federal Reserve rate policy: ExxonMobil and Chevron both beat Q1 2026 estimates while reporting net income declines of 36-45%, a paradox explained by billions in legacy hedge losses accumulated as crude prices surged above their hedged positions.
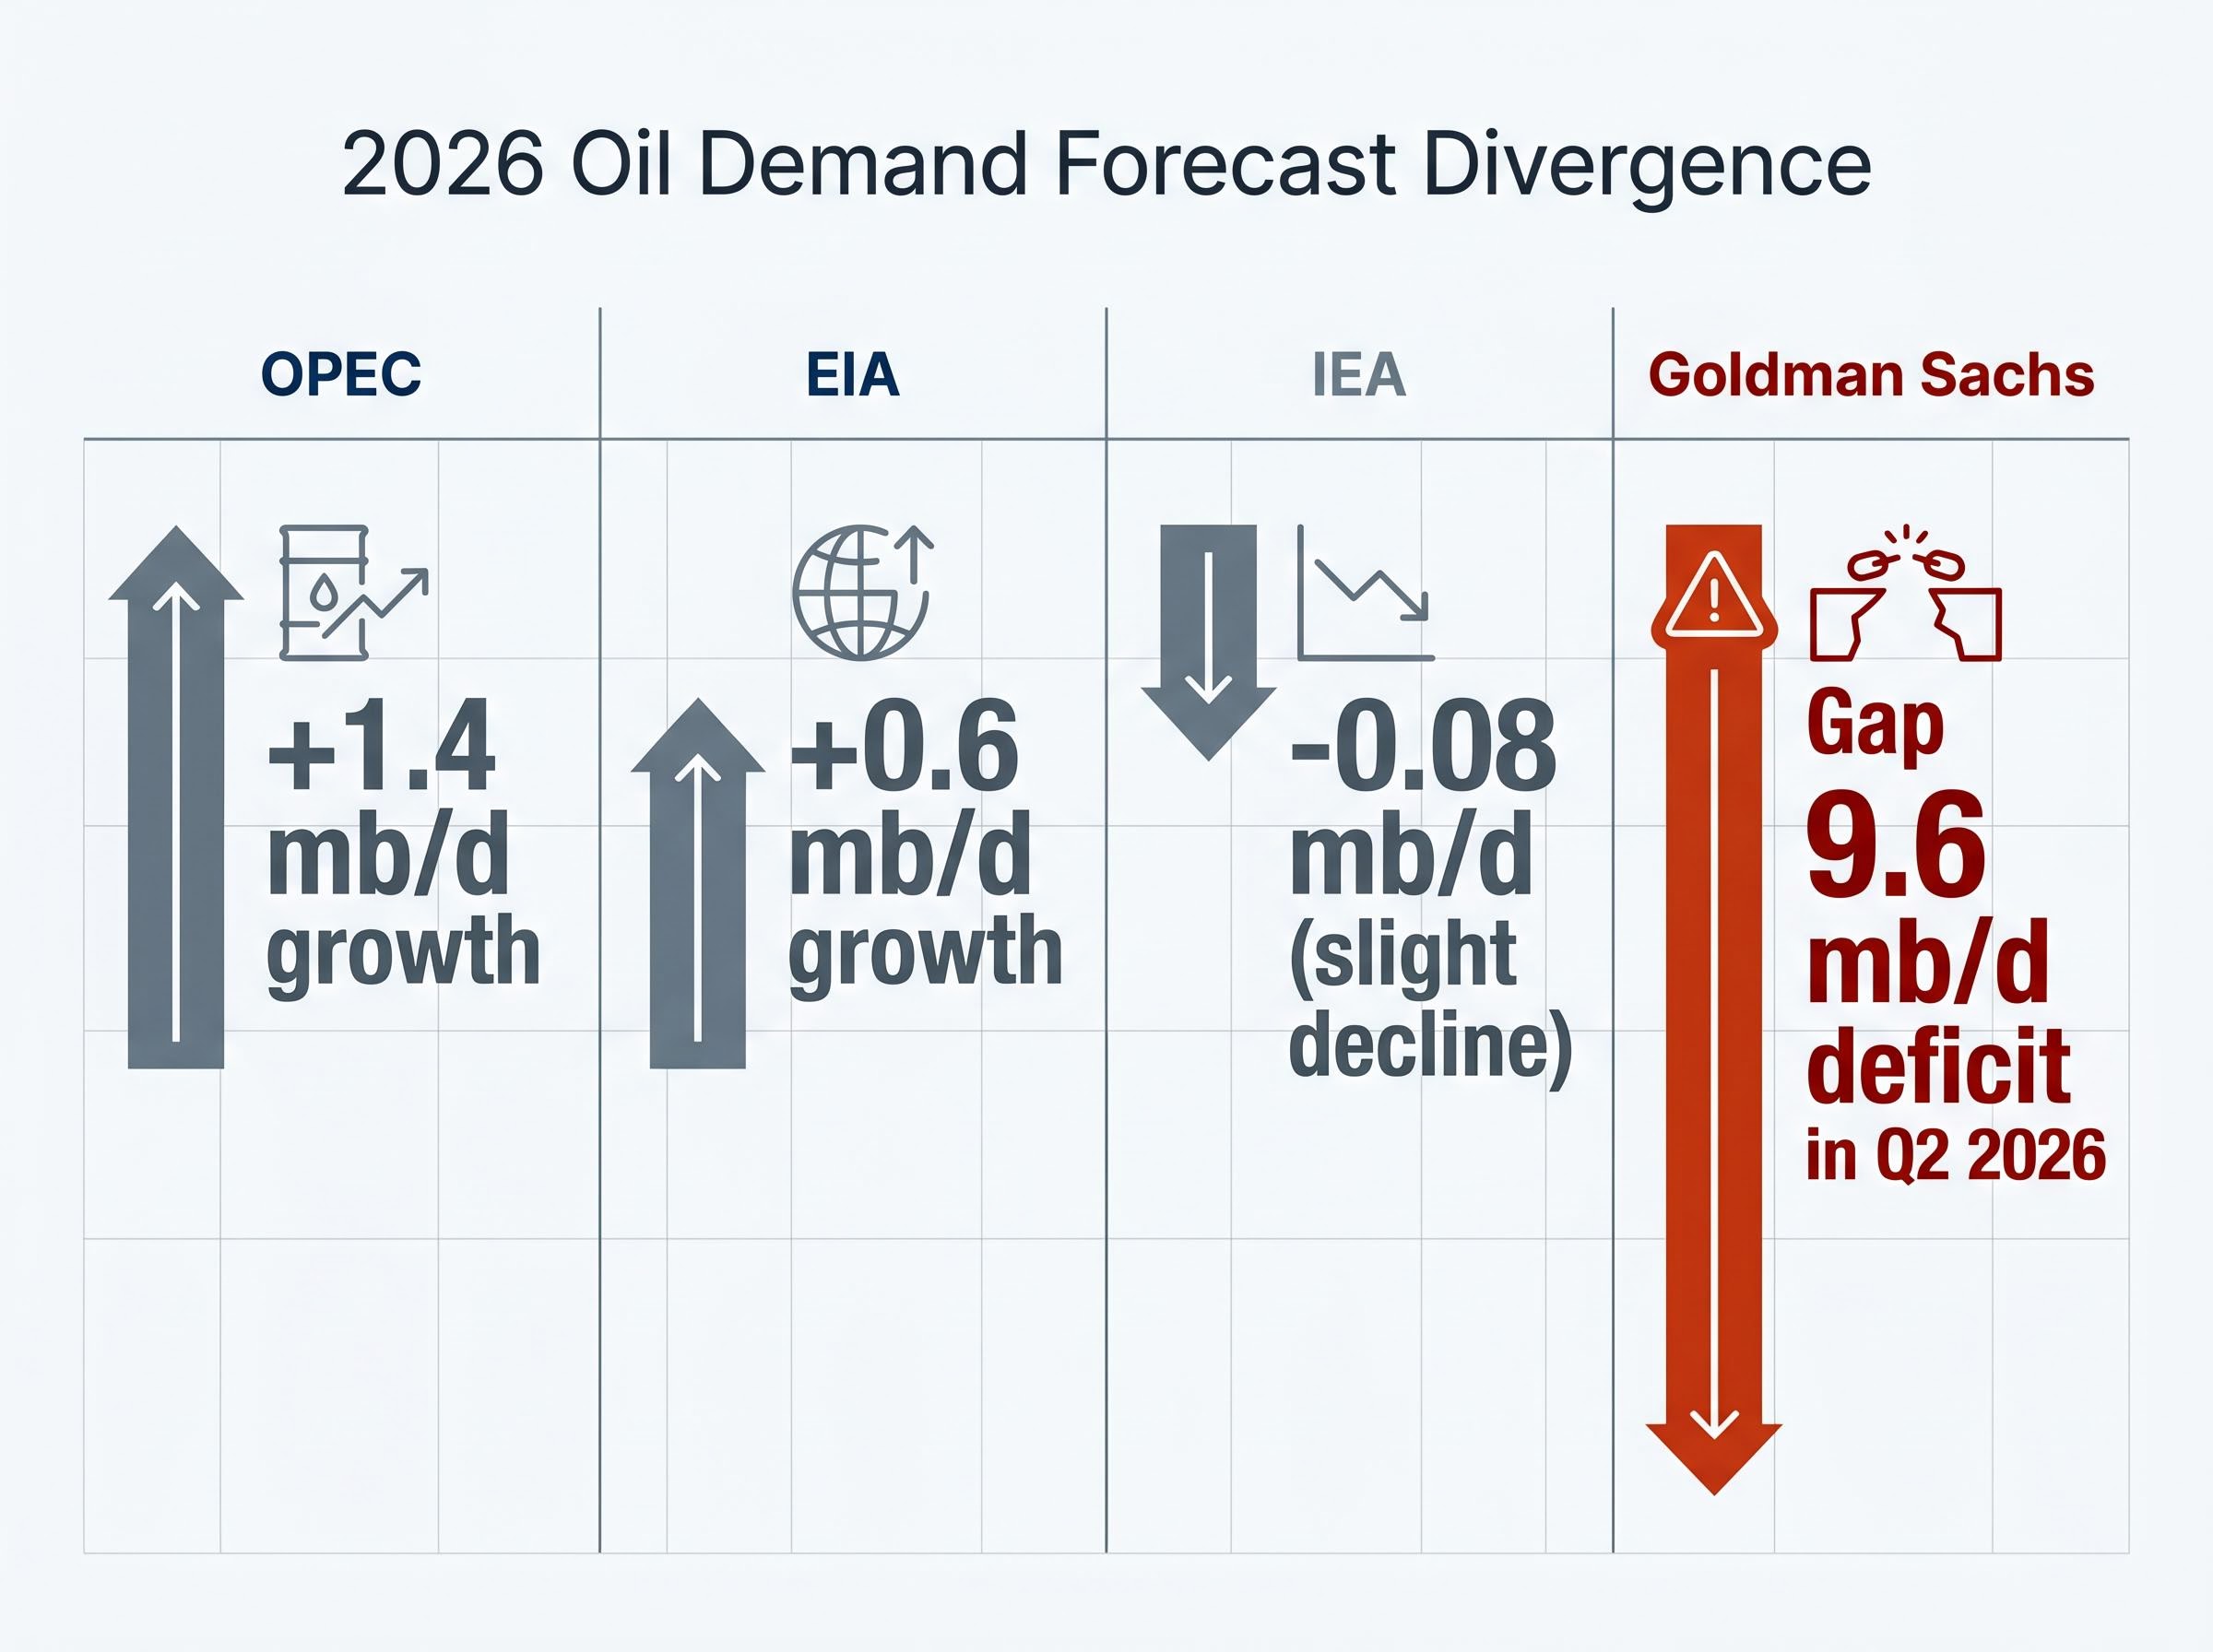
The four major institutional forecasts for 2026 oil demand span a range wide enough to imply fundamentally different market environments:
| Institution | 2026 demand forecast | Next update |
|---|---|---|
| EIA | +0.6 mb/d growth | 12 May 2026 |
| OPEC | +1.4 mb/d growth | 13 May 2026 |
| IEA | -0.08 mb/d (slight decline) | Mid-May 2026 |
| Goldman Sachs | 9.6 mb/d deficit in Q2 2026 | Ongoing |
The IEA projects a slight demand decline. OPEC projects 1.4 million barrels per day of growth. Goldman Sachs sees a 9.6 million barrels per day deficit in Q2 alone.
Goldman Sachs projects a 9.6 million barrels per day deficit for Q2 2026, the single sharpest supply-demand imbalance forecast among the major institutions.
This divergence is not a data error. It reflects legitimately different model assumptions about how aggressively high prices destroy demand versus how persistently supply disruptions compress available barrels. The IEA is modelling a world where $100-plus crude triggers sufficient demand destruction to offset the supply shock. Goldman Sachs is modelling a world where supply losses outrun any demand response.
J.P. Morgan’s $60 per barrel Brent forecast from February 2026 serves as a stark reminder that every institutional model is anchored to a geopolitical assumption set that can be invalidated in weeks. The bank’s February assessment was internally consistent; the world simply moved faster than the model.
When the institutions diverge this sharply, the divergence itself is information. It signals a regime where historical demand models are unreliable guides, and position sizing should reflect that uncertainty rather than ignore it.
The paradox is straightforward: WTI is falling on ceasefire sentiment even as the physical supply situation has not materially improved. The Hormuz Strait remains effectively closed. The Kirishi refinery remains offline. Inventory drawdowns are accelerating. Yet prices on 6 May sat at $100.37 for WTI and $108.77 for Brent, near the midpoint of the $80-$120 analyst consensus range.
Two scenario paths emerge from here. In the first, the ceasefire holds, Hormuz reopens to commercial traffic, and prices decline toward the $80 floor as the risk premium unwinds and physical supply normalises. In the second, the ceasefire fractures or Hormuz remains closed through June, pushing WTI toward the $120 ceiling with refined product shortages amplifying downstream price pressure.
CME Group open interest and positioning data for 5-6 May 2026 is not yet available, leaving a gap in the speculative positioning picture.
For investors weighing whether the $80-$120 price range represents a stable equilibrium or a precursor to broader economic damage, our full explainer on oil price recession transmission covers the four simultaneous channels through which sustained $100-plus crude flows into reduced consumer spending, business input cost compression, Federal Reserve rate pressure, and hiring freezes, with historical context from every major US recession preceded by an oil shock since 1973.
The following four leading indicators will carry the most directional weight in the coming fortnight:
These are analytical indicators, not investment recommendations. The current price level sits near the midpoint of the analyst consensus range, meaning the market is not yet pricing either scenario with conviction. The mid-May institutional update cycle represents the first opportunity for markets to reprice against updated fundamentals.
The ceasefire remains fragile. The Hormuz Strait remains closed in practice. The Kirishi refinery remains offline. This is not a single-shock event cycling through the usual volatility-and-recovery pattern. It is a compounding, multi-vector supply compression unfolding in real time, with upstream crude disruption and downstream refining damage reinforcing each other simultaneously.
The institutional forecast divergence, as wide as it has been in years, reflects genuine analytical uncertainty about how this resolves. The next two weeks of data releases will materially reset market assumptions:
Until those reports land, the global oil market sits in a pricing gap between ceasefire optimism and structural supply reality. Investors making energy allocation decisions in this window are doing so with less institutional consensus to lean on than at any point in the past twelve months.
This article is for informational purposes only and should not be considered financial advice. Investors should conduct their own research and consult with financial professionals before making investment decisions. Past performance does not guarantee future results. Financial projections referenced in this analysis are subject to market conditions and various risk factors.
The Strait of Hormuz is a narrow waterway connecting the Persian Gulf to the Gulf of Oman, and under normal conditions roughly 20% of global seaborne oil trade passes through it. When it is effectively closed, as it has been since late April 2026, there is no maritime alternative capable of replacing its throughput, which compresses global supply buffers and drives price volatility.
Markets unwound risk premium in response to the US-Iran ceasefire agreed on 8 April 2026, treating the absence of fresh escalation as a signal that the worst-case scenario had passed. However, the ceasefire has not restored commercial shipping through Hormuz, and the US naval escort operation known as Project Freedom was paused as of 5 May 2026, meaning the physical supply situation has not materially improved despite the price drop.
The Hormuz closure disrupts upstream crude supply by reducing the volume of raw oil reaching global markets, while the Kirishi refinery strike disrupts downstream refining capacity by reducing the volume of finished products such as petrol, diesel, and jet fuel available to end consumers. Goldman Sachs has warned that both disruptions are occurring simultaneously, compounding the tightening effect on global inventories.
The four leading indicators with the most directional weight are: reinstatement of the US Project Freedom naval escort operation through Hormuz (bearish signal if resumed), Goldman Sachs inventory drawdown updates, the EIA report on 12 May, the OPEC report on 13 May, and the IEA mid-May Oil Market Report. Any convergence in institutional demand forecasts would reduce uncertainty, while further Russian infrastructure strikes would tighten the refined product market further.
The IEA projects a slight demand decline while OPEC forecasts 1.4 million barrels per day of growth and Goldman Sachs sees a 9.6 million barrels per day deficit in Q2 2026 alone. The divergence reflects genuinely different model assumptions about how aggressively high crude prices above $100 destroy demand versus how persistently supply disruptions compress available barrels, and the gap itself signals that historical demand models are unreliable guides in the current environment.