
How Hormuz Closure at $104 Oil Is Reshaping Every Asset Class
5 hrs ago

The S&P 500 delivered a cumulative total return of 305% over the past decade. For American investors who stayed the course through volatility, a pandemic, and two bear markets, that outcome felt like confirmation of a straightforward thesis: the U.S. stock market is the only market that matters.
That thesis is now facing its most serious quantitative challenge in years. Valuations sit at the 90.5th percentile of modern-era history. Three major asset managers project sub-5% annualised U.S. returns over the next decade. International equity markets are already outperforming in 2026. The question for long-horizon investors is no longer whether to think about investing in international stocks; it is whether they have the analytical framework to act on it.
What follows explains why U.S. equities earned their dominant record, what the data says about whether that dominance can continue at the same pace, and what a proportionate, evidence-based response looks like for American investors today.
The number itself deserves a moment. The S&P 500’s 305% cumulative total return through 23 April 2026, as calculated by Motley Fool analyst Neil Patel, represents one of the strongest decade-long stretches in the index’s history.
305% cumulative total return for the S&P 500 over the past decade, a result driven by structural advantages that compounded year after year.
This was not a rising-tide outcome. International developed and emerging markets delivered positive returns over the same period, but nothing close to the compounding force of U.S. large-cap equities. The Magnificent Seven, the cohort of mega-cap technology names that came to dominate the index, represented the most concentrated expression of a broader pattern: American companies capturing outsized shares of global profit growth.
The durability of that pattern extends well beyond a single decade. Warren Buffett’s Berkshire Hathaway compounded at approximately 20% annualised over six decades, a record Buffett attributed in his 2021 shareholder letter to the structural advantages of operating within the American economic system.
The historical case for building wealth through index funds rests on the same compounding logic that produced the S&P 500’s 305% decade: low costs, broad diversification, and the discipline to stay invested through drawdowns rather than exit at the worst moments.
Buffett’s 20% annualised compound rate across six decades serves as the longest-running illustration of how consistently the U.S. equity system has rewarded patient capital.
The U.S. equity market’s outperformance was not an accident of timing. It was built on an interlocking system of structural advantages that reinforced one another over decades.
The world’s largest economy provided the base. A legal system with strong property rights protection and contract enforcement created the conditions for long-term capital formation. Deep, liquid capital markets attracted global talent and capital, which in turn generated the innovation that deepened those markets further. Each layer reinforced the next, creating a compounding loop that no other single national market replicated at the same scale.
Buffett’s 2021 shareholder letter framed this as the core of the investment case: not any single company or sector, but the system itself.
On top of that economic foundation, U.S. firms built global leadership positions across multiple sectors:
The Magnificent Seven represent the apex of this pattern in the current era. Their dominance of global technology spending, particularly in AI capital expenditure, has concentrated an extraordinary share of global equity market capitalisation within a handful of U.S.-listed names. That concentration powered index-level returns but also created the valuation conditions that now warrant scrutiny.
The structural story is real. The question is how much of it is already reflected in the price investors pay today.
As of April 2026, the S&P 500 trades at a forward price-to-earnings ratio of approximately 21.3x-25.8x, depending on methodology. As of 31 December 2025, that valuation sat at the 90.5th percentile of the modern era, a level only previously exceeded at the dot-com peak.
The competing valuation signals in the S&P 500 matter because forward P/E and cyclically adjusted P/E are telling different stories right now: forward earnings estimates have compressed the near-term multiple toward five-year norms, even as the Shiller P/E remains at its second-highest reading in 155 years of data.
The S&P 500’s 90.5th percentile valuation ranking means that in roughly 90% of all historical starting points, the index was cheaper than it is today.
When three independent, quantitatively rigorous asset managers build long-horizon models from different methodologies and converge on the same conclusion, the signal warrants attention. Vanguard’s December 2025 forecast projects 4-5% annualised U.S. equity returns over the next decade. GMO’s March 2026 seven-year forecast estimates U.S. large-cap real returns of approximately 0-2%. Research Affiliates projects approximately 3.4% nominal over ten years.
The contrast with international markets sharpens the picture considerably.
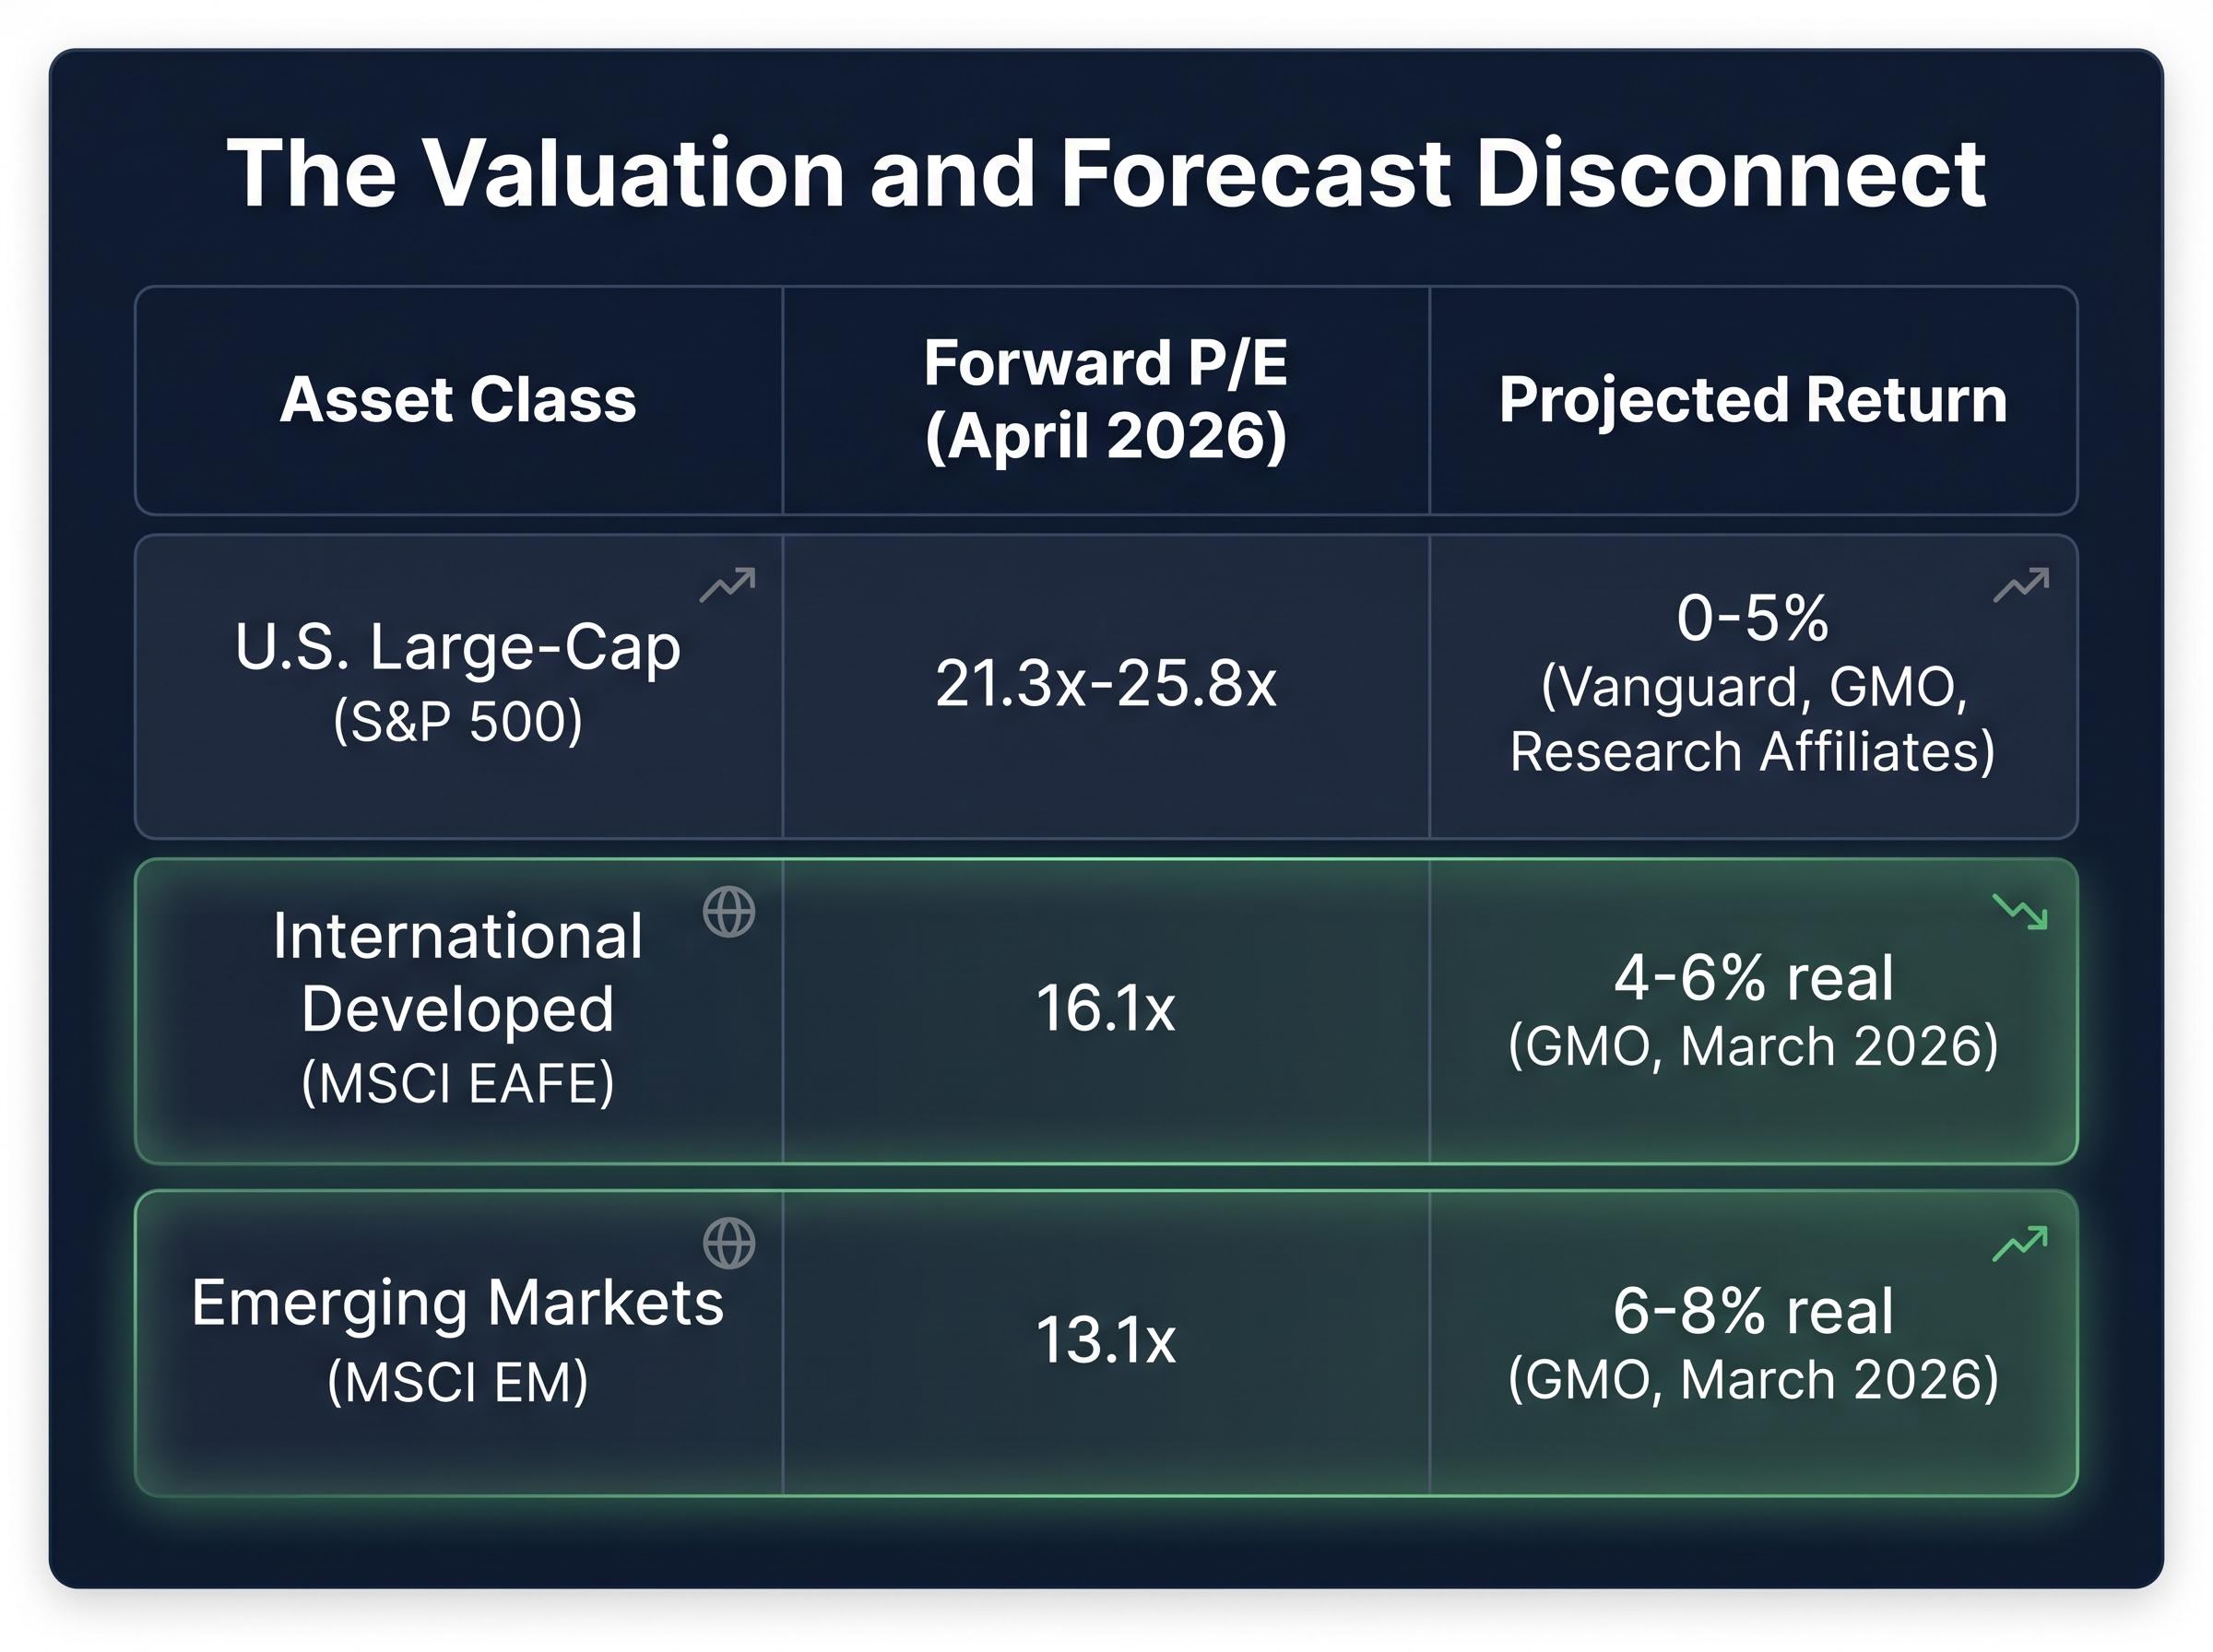
| Asset Class | Forward P/E (April 2026) | Projected 7-10 Year Return |
|---|---|---|
| U.S. Large-Cap (S&P 500) | 21.3x-25.8x | 0-5% (range across Vanguard, GMO, Research Affiliates) |
| International Developed (MSCI EAFE) | 16.1x | 4-6% real (GMO, March 2026) |
| Emerging Markets (MSCI EM) | 13.1x | 6-8% real (GMO, March 2026) |
The valuation gap is not subtle. International developed markets trade at a meaningful discount to U.S. equities, and emerging markets at a steeper one still. The institutional forecasts reflect that starting-point advantage compounding over a decade.
The forecast-implied rotation is no longer theoretical. As of 27 April 2026, international equity markets are outperforming U.S. equities on a year-to-date basis:
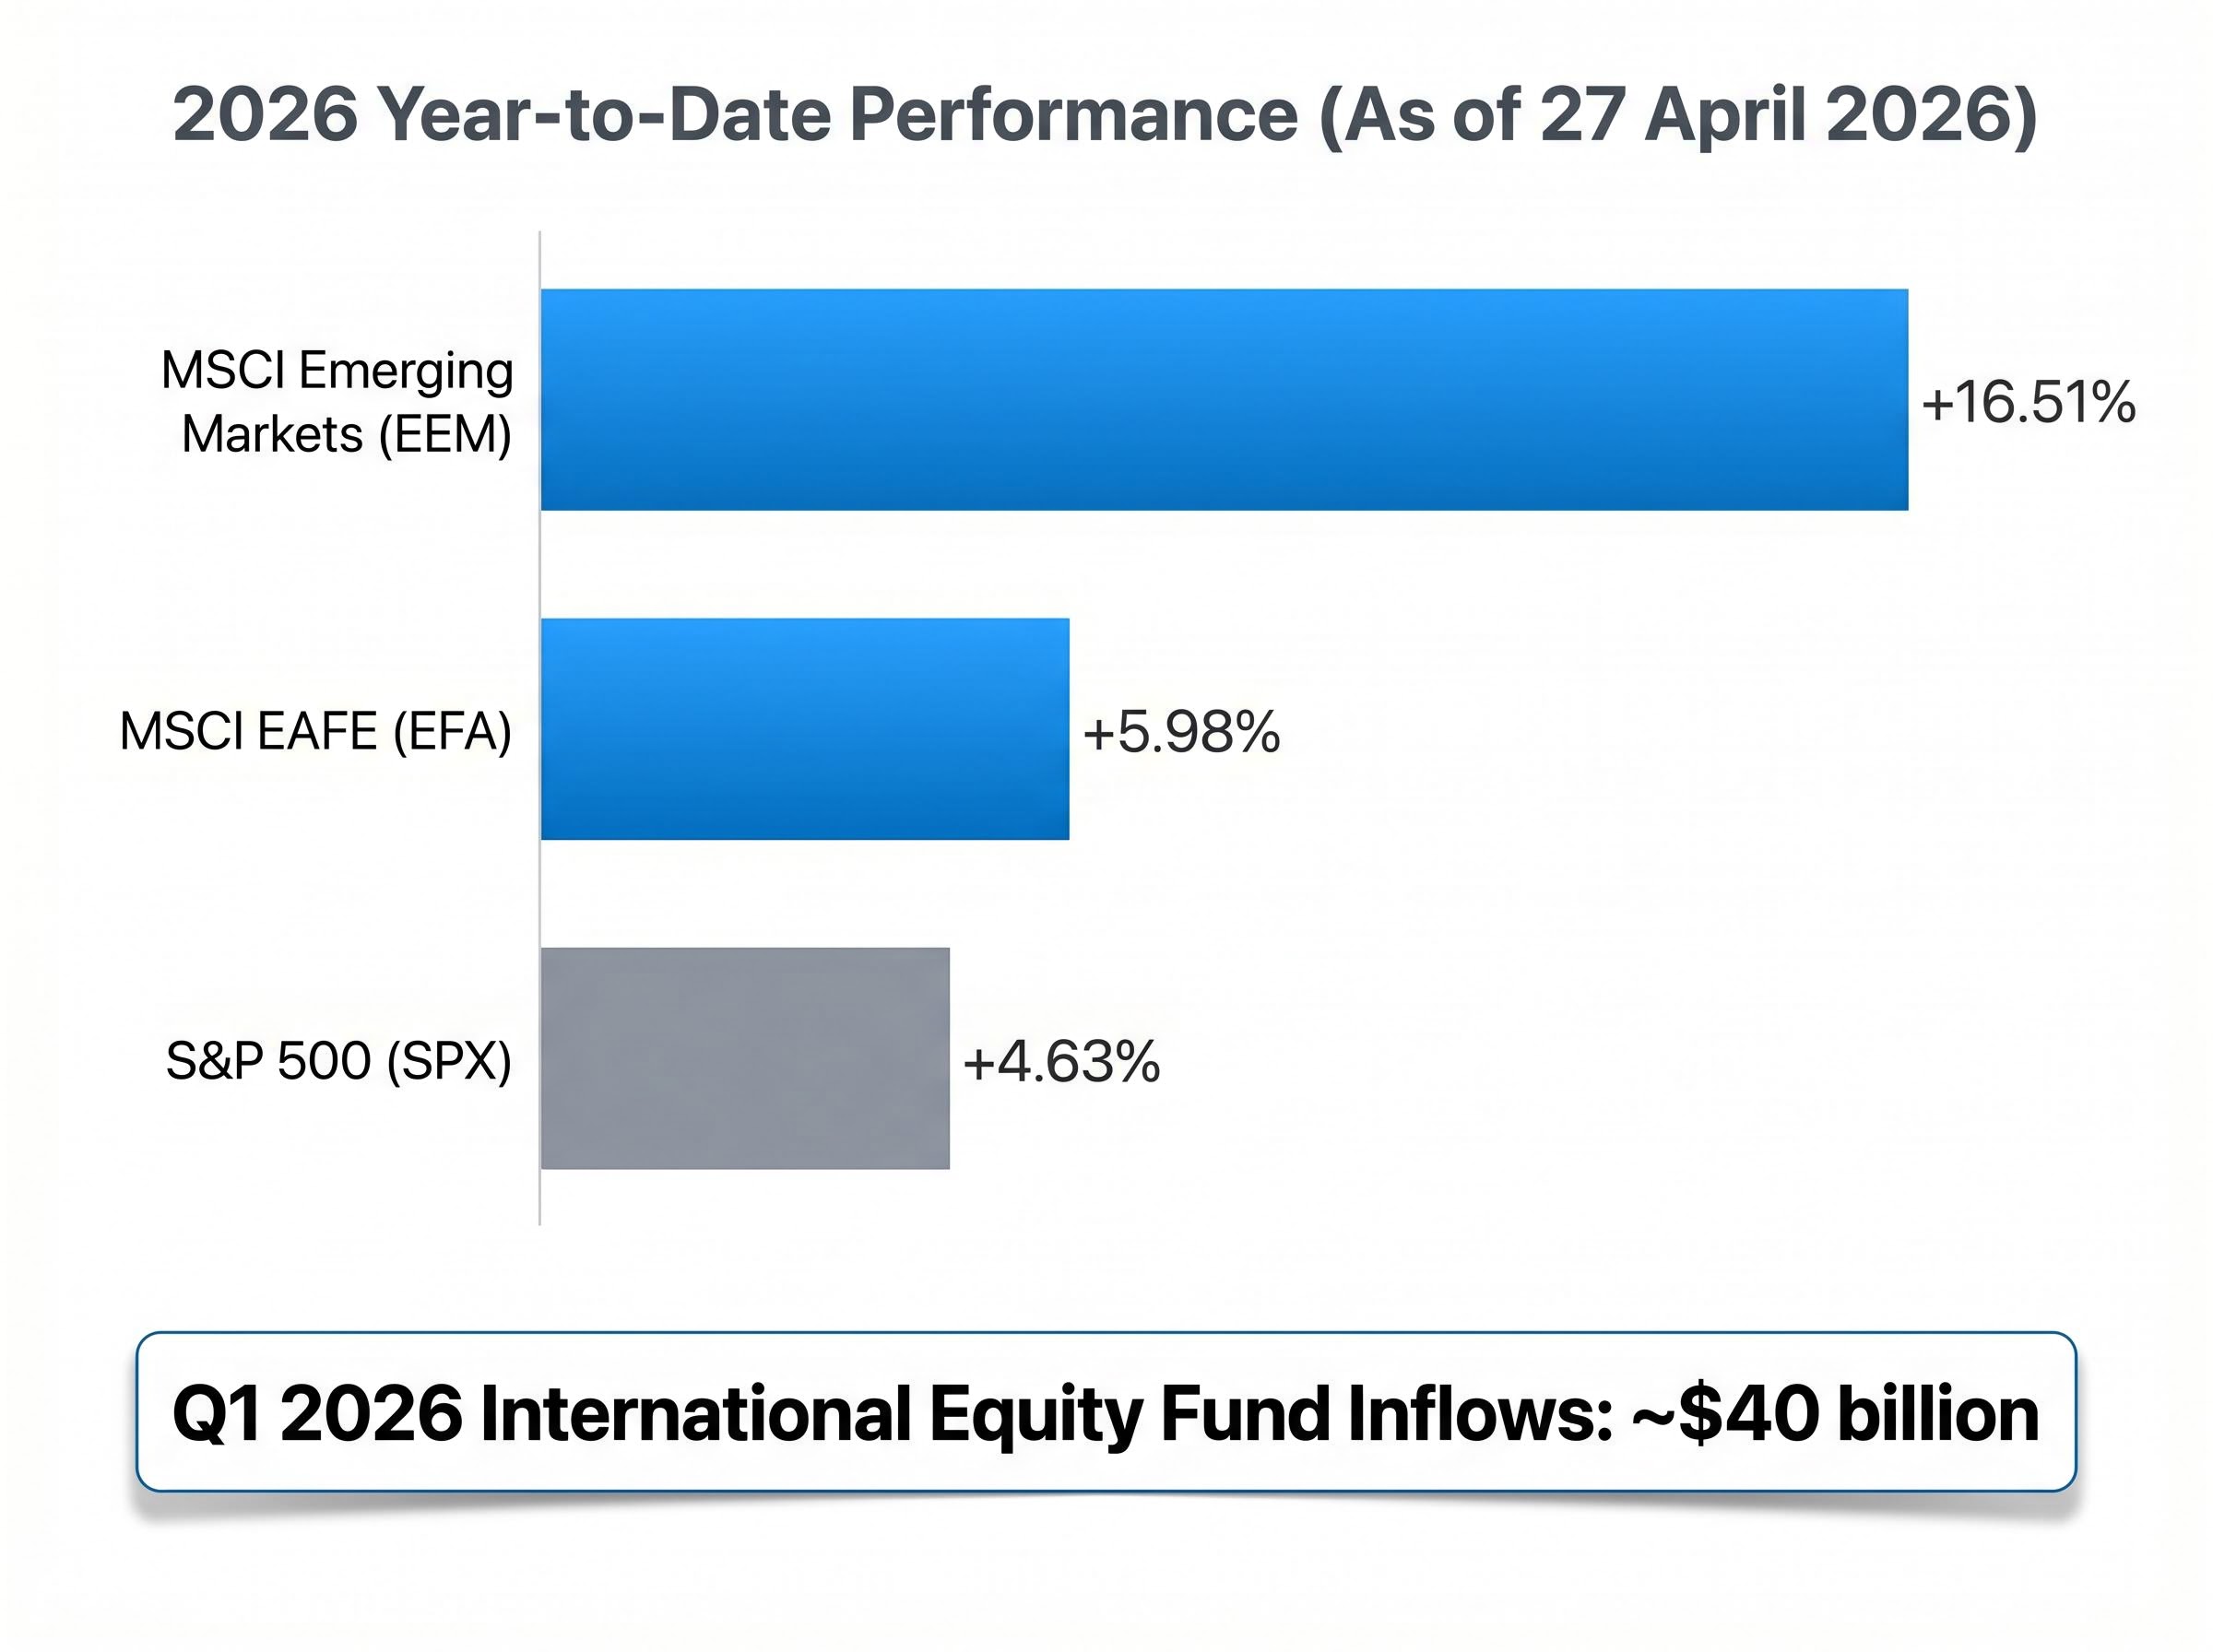
The fund flow data reinforces the price signal. International equity funds attracted approximately $40 billion in global inflows during Q1 2026, with emerging markets ETFs leading the trend. TIAA, in its late-2025 positioning research, had flagged non-U.S. stocks for a potential multiyear rotation based on cheaper valuations and improving fundamentals. The early 2026 data is consistent with that thesis beginning to materialise.
The scale of the international equity rotation already underway is larger than 2026 price data alone suggests: international stocks outperformed the S&P 500 by double-digit percentage points in 2025, triggering approximately $75 billion in outflows from US equity funds over the six months through February 2026.
One partial year does not confirm a decade-long forecast. But when price action, capital flows, and institutional projections all point in the same direction, the confluence is meaningful rather than coincidental.
The valuation starting point is the structural headwind. Layered on top of it are several active risk factors that do not require a recession scenario to compress U.S. relative returns:
The Federal Reserve’s March 2026 FOMC statement confirmed the decision to hold the federal funds rate at 3.50%-3.75%, with the accompanying language offering no forward guidance that would indicate cuts are imminent in the near term.
These headwinds are cumulative. They do not need to trigger a crisis; they merely need to persist while international alternatives compound from cheaper starting valuations. The arithmetic of starting-point P/E ratios, compounded over a decade, is difficult to overcome with earnings growth alone.
The evidence presented in prior sections does not call for abandoning U.S. equities. It calls for a measured adjustment to portfolio construction.
Neil Patel’s April 2026 analysis for Motley Fool suggests a 5% starting allocation to international equities as a low-friction entry point for investors currently at zero international exposure. That figure is a risk-management floor, not a ceiling. Traditional diversification benchmarks from Vanguard, Fidelity, and Schwab continue to endorse a 20-30% international allocation for long-term portfolios.
The gap between 5% and 20-30% is itself informative. Most U.S. investors are likely underweight international equities relative to any reasonable long-term standard, and closing that gap does not require a dramatic portfolio overhaul. It requires a first step.
For investors seeking broad international exposure through a single, cost-efficient vehicle, the Vanguard Total International Stock ETF (VXUS) offers coverage across developed and emerging markets at an expense ratio of 0.05%.
The top holdings reflect the reality that international does not mean avoiding technology exposure. It means accessing technology leadership that happens to be listed outside the United States.
For investors ready to move beyond the allocation decision and evaluate the mechanics of the vehicle itself, our full explainer on the VXUS ETF covers country weights, top holdings by region, the currency exposure implications of unhedged international positions, and how VXUS compares to peer funds like VEU, IXUS, and SPDW across coverage and cost.
This article is for informational purposes only and should not be considered financial advice. Investors should conduct their own research and consult with financial professionals before making investment decisions. Past performance does not guarantee future results. Financial projections are subject to market conditions and various risk factors.
The U.S. equity market earned its dominant record through structural advantages that remain real: the world’s deepest capital markets, a legal system that protects capital formation, and a technology sector that continues to shape global spending. None of that is in dispute.
What has changed is the price of admission. At the 90th-plus percentile of historical valuations, with three independent institutional forecasters projecting sub-5% annualised returns and international markets already demonstrating the rotation in 2026 price data, the forward-looking case for exclusively domestic allocation has weakened materially.
U.S. equities may still deliver positive returns over the next decade. The question is whether investors who also look beyond the domestic market will be compensated for doing so. The valuation data, the institutional forecasts, and the early 2026 evidence all point in the same direction.
U.S. equities currently sit at the 90.5th percentile of historical valuations, with three major asset managers projecting annualised returns of just 0-5% over the next decade. International developed and emerging markets trade at significantly lower valuations and carry higher return projections, making diversification beyond domestic equities a data-supported strategy.
The MSCI EAFE index tracks large- and mid-cap equities across developed markets outside the U.S. and Canada. As of 27 April 2026, it had returned 5.98% year-to-date, outperforming the S&P 500's 4.63% gain over the same period.
Traditional benchmarks from Vanguard, Fidelity, and Schwab recommend a 20-30% international allocation for long-term portfolios. Motley Fool analyst Neil Patel suggests 5% as a low-friction starting point for investors currently at zero international exposure.
The Vanguard Total International Stock ETF (VXUS) offers broad coverage across developed and emerging markets at an expense ratio of just 0.05%, with top holdings including Taiwan Semiconductor Manufacturing, Samsung Electronics, and ASML Holding.
Yes. As of 27 April 2026, MSCI Emerging Markets (EEM) had gained 16.51% year-to-date and MSCI EAFE (EFA) had gained 5.98%, both ahead of the S&P 500's 4.63% return. International equity funds also attracted approximately $40 billion in global inflows during Q1 2026.


