
Why Orion Stock Fell 4.3% Despite 47% Profit Growth in Q1
1 hr ago

The S&P 500’s Shiller P/E ratio stands at 40.09 as of 21 April 2026, marking the second-highest valuation in 155 years of recorded data, exceeded only by levels that preceded the dot-com crash. This historically extreme reading arrives amid a market that has recovered 8.2 per cent from its March lows, even as crude oil trades near $96 per barrel following the Strait of Hormuz disruptions and March inflation jumped to 3.3 per cent year-over-year. This analysis unpacks what current valuation metrics actually signal for investors, examining the forces compressing forward multiples, the sectors experiencing repricing, and the scenarios that could unfold through the remainder of 2026.
The Shiller P/E of 40.09 sits 23 points above the 155-year historical mean of approximately 17. Only the dot-com peak exceeded this level. The reading climbed 2.43 points from 37.66 on 1 March 2026, a seven-week rise that reflects fundamental repricing of growth expectations, particularly within technology and AI-related investments.
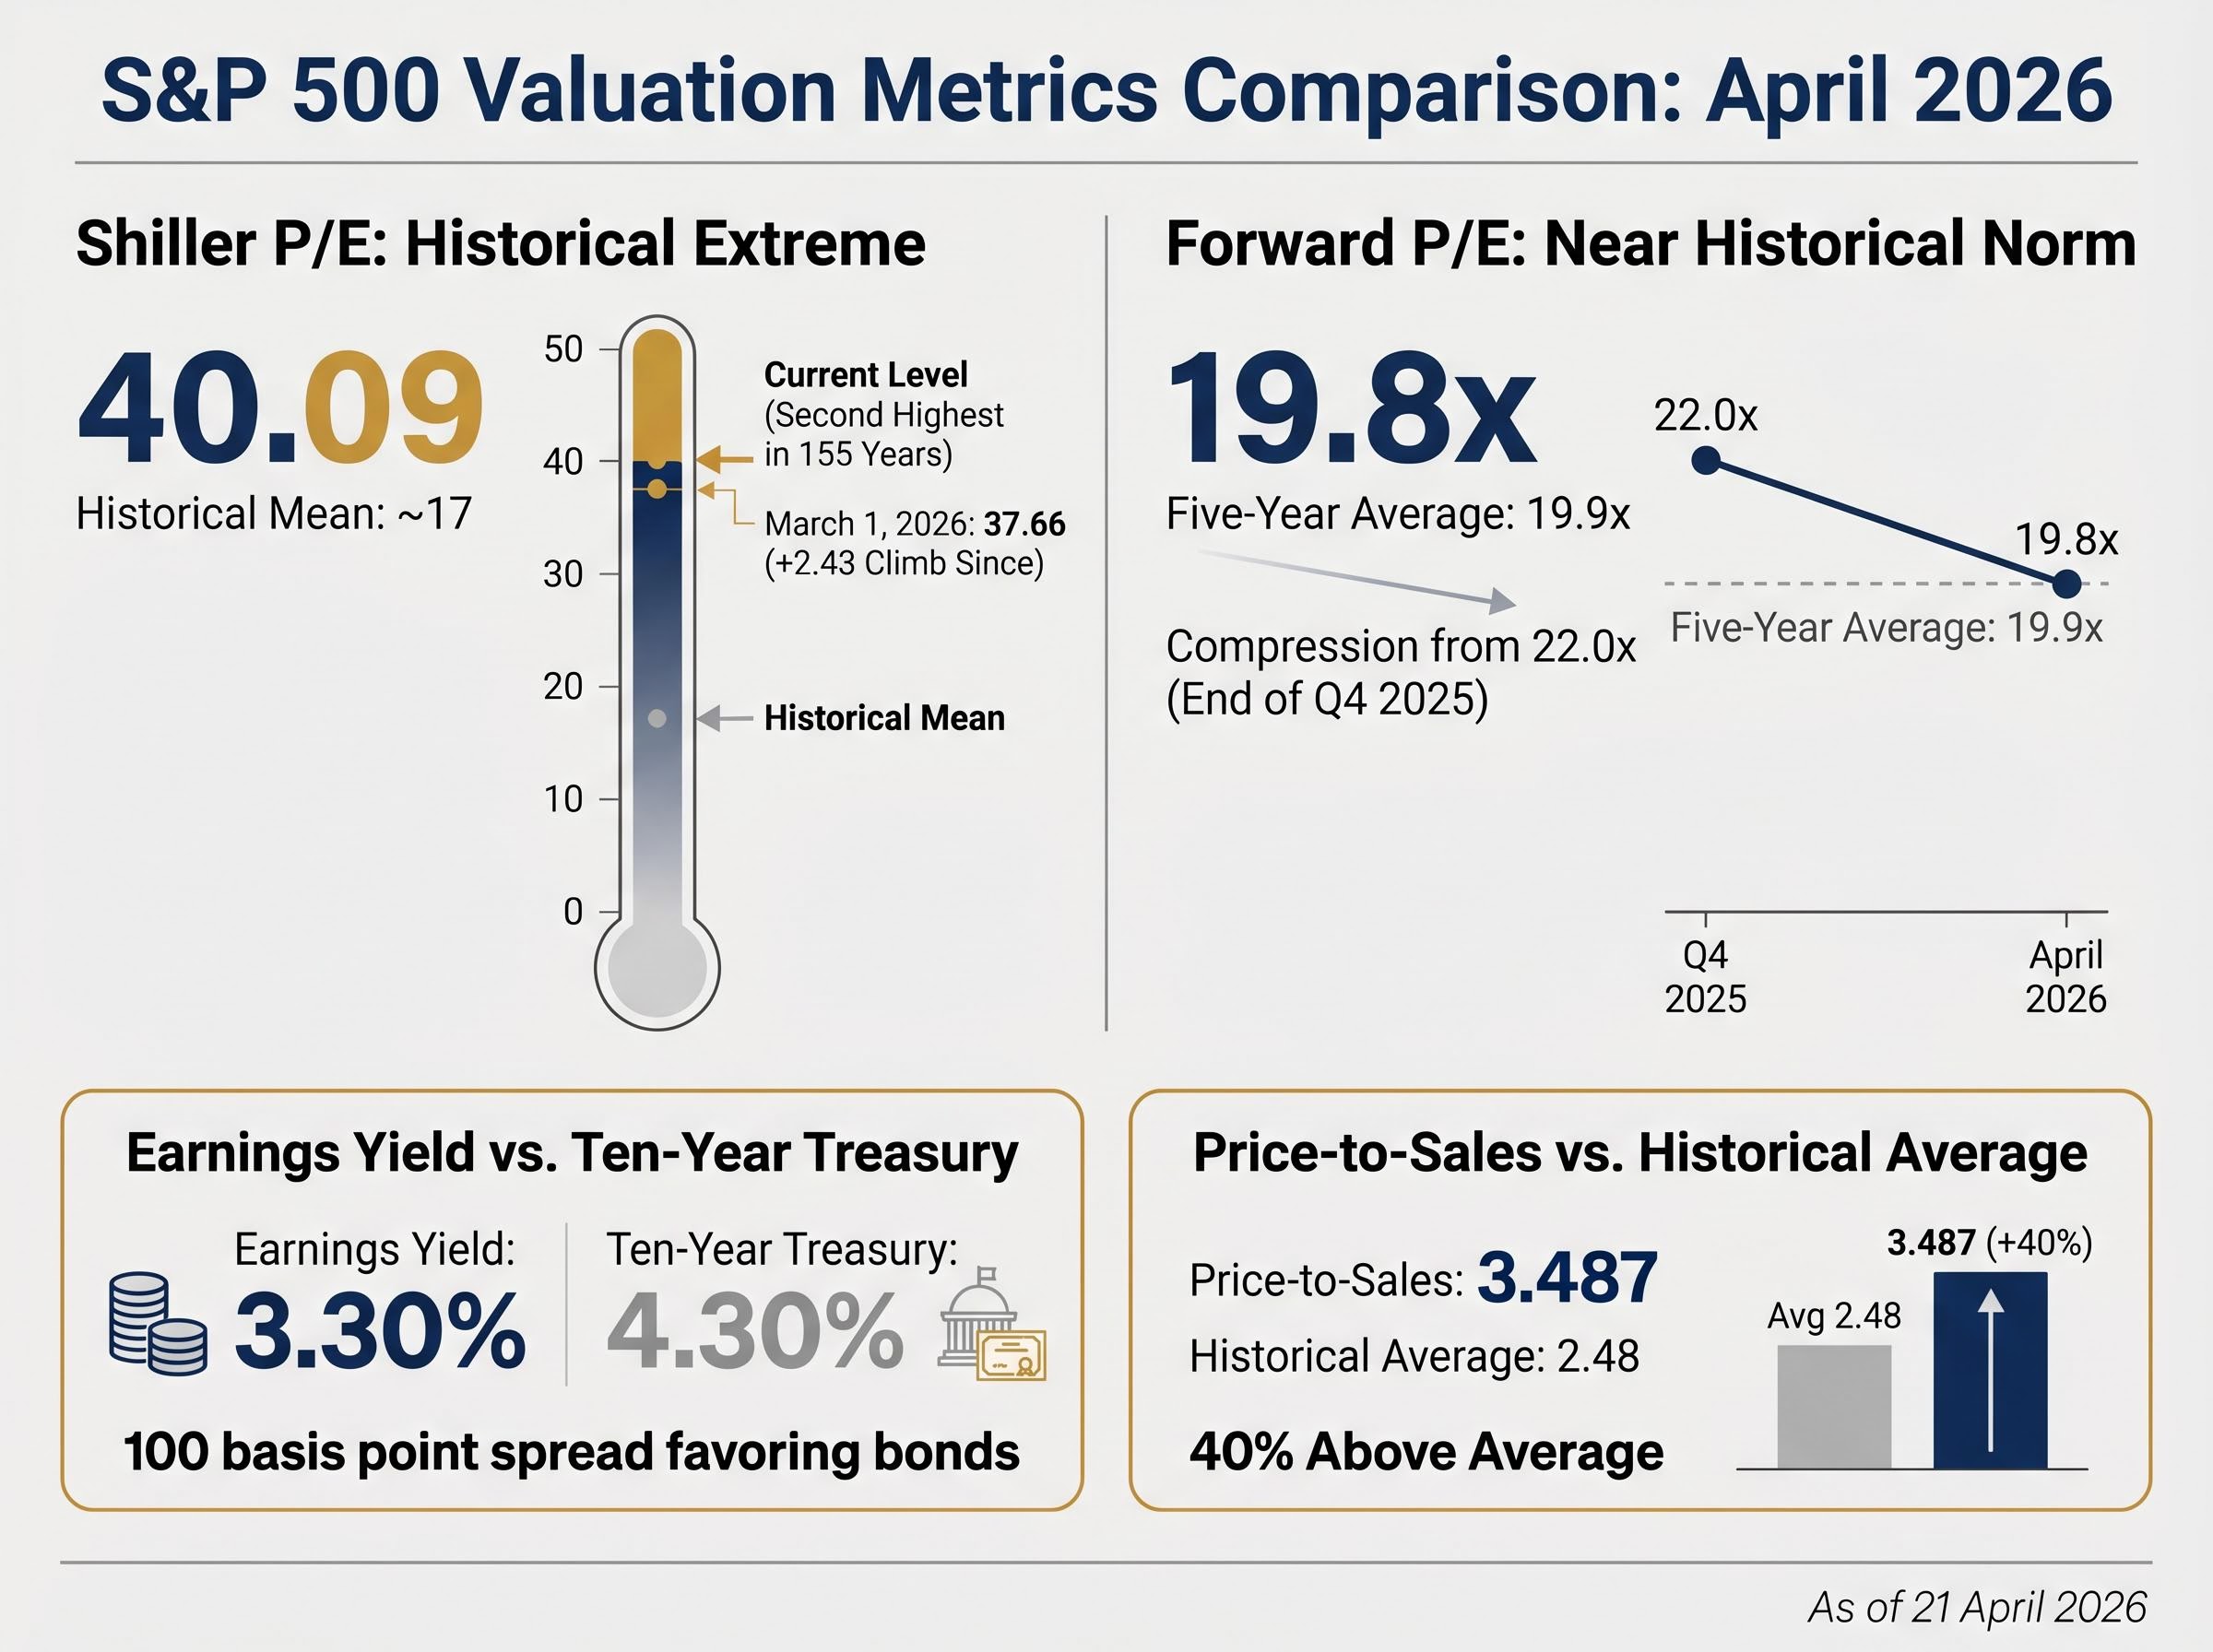
Yet the forward P/E tells a different story. The index now trades at 19.8 times next-twelve-month earnings, down from 22.0 at the end of Q4 2025. The current 19.8 forward P/E sits modestly below the five-year average of 19.9, suggesting valuations have already compressed toward historical norms even as the Shiller ratio flashes warning signals.
This divergence matters because strong earnings growth expectations are pulling forward multiples down even as trailing metrics remain elevated. Analysts project 18 per cent earnings growth for 2026, up from 14 per cent at year start. The earnings yield stands at 3.30 per cent versus the ten-year Treasury yield of approximately 4.30 per cent, a one-hundred-basis-point spread favouring bonds that has created renewed debate among institutional investors regarding equity attractiveness. The price-to-sales ratio of 3.487 trades 40 per cent above the historical average of 2.48, placing the market well above typical value ranges of 1.95 to 2.75.
The dynamic between Shiller P/E and forward P/E ratios has produced a striking divergence, but history shows that falling S&P 500 PE ratios during a bull market often arise when earnings estimates outpace prices, leading to compressed multiples even as stock indices set new highs.
| Metric | Current Level | Historical Average | Signal |
|---|---|---|---|
| Shiller P/E | 40.09 | ~17 | Elevated (2nd highest in 155 years) |
| Forward P/E | 19.8x | 19.9 (5-year avg) | At historical norm |
| Earnings Yield | 3.30% | Varies | Below 10-year Treasury (4.30%) |
| Price-to-Sales | 3.487 | 2.48 | 40% above average |
Historical Context The Shiller P/E of 40.09 represents the second-highest valuation in 155 years of data, exceeded only by the dot-com bubble peak that preceded a 49 per cent market decline.
Understanding which valuation lens applies helps investors avoid the trap of relying solely on one metric. The Shiller P/E flashes warning signals while forward P/E suggests valuations have already compressed toward historical norms.
The chain reaction began on 28 February 2026. Iran’s military conflict escalated, triggering the de facto closure of the Strait of Hormuz, a maritime chokepoint through which roughly 25 per cent of global maritime oil transport flows. Countries including Iraq, Saudi Arabia, and the United Arab Emirates shut in production. Brent crude, which started Q1 2026 at $61 per barrel, peaked at $118 in March, a 93.4 per cent surge in less than twelve weeks.
Gas station prices transmitted the shock directly to consumers. The March Consumer Price Index, released on 10 April 2026, revealed the damage. The all-items index increased 0.9 per cent on a seasonally adjusted basis in March, substantially above the 0.3 per cent increase recorded in February. Year-over-year inflation jumped from 2.4 per cent to 3.3 per cent.
The BLS Consumer Price Index report for March 2026 confirmed the all-items index increased 0.9 per cent on a seasonally adjusted basis, with the gasoline index rising 21.2 per cent and accounting for nearly three-quarters of the monthly all-items increase, validating the direct transmission of energy shocks to consumer inflation.
Energy’s Inflation Footprint Gasoline increased 21.2 per cent in March, accounting for nearly three-quarters of the monthly all-items increase.
The transmission mechanism operated through five steps:
Even partial resolution leaves residual pressure. Crude currently trades near $96 per barrel, approximately $29 higher than prices one year prior. The Cleveland Fed Inflation Nowcasting projects April trailing 12-month inflation at approximately 3.58 per cent. The average 30-year mortgage rate climbed from 5.99 per cent in February to the 6.3-6.5 per cent range by mid-April, erasing nine consecutive months of affordability gains.
Energy crisis-driven inflation in 2026 saw the CPI spike alongside S&P 500 record highs, illustrating the unusual intersection of market optimism with persistent price pressures stemming from external supply shocks.
The energy-inflation transmission mechanism explains why the market’s recent recovery may face renewed pressure if ceasefire talks falter and crude prices reaccelerate toward March levels.
The Federal Reserve maintained its target range at 3.5 to 3.75 per cent following its 17-18 March 2026 meeting. Nearly all Committee members agreed to hold, with only one dissent from Stephen I. Miran, who preferred to lower the rate by one-quarter percentage point. The vote came during significant geopolitical uncertainty, with the Committee acknowledging that “the implications of developments in the Middle East for the U.S. economy are uncertain.”
The dilemma is structural. Cutting rates risks stoking inflation that already exceeds the 2 per cent target. Raising rates risks recession when the economy faces geopolitical headwinds and potentially deteriorating financial conditions. Doing nothing may satisfy neither mandate.
Market expectations shifted sharply following the 10 April release of March CPI data. The modal path based on options prices became consistent with no rate change through year-end, compared with one 25-basis-point cut previously expected. J.P. Morgan Global Research now expects the Federal Reserve to hold rates steady throughout 2026, with the next anticipated move being a 25-basis-point hike in Q3 2027.
The oil-driven reversal in Fed rate cut expectations for 2026 demonstrates how rapidly commodity shocks can reshape market-implied policy paths and force central banks to reconsider their stance in the face of persistent inflation.
The three policy options each carry distinct risks:
Policy Paralysis Stakes KPMG’s chief economist characterised the bind as particularly acute, noting that if stagflation were to take hold, the “only clear way out” for the economy might be a “deep recession.”
The Fed’s paralysis means investors cannot rely on monetary easing to support equity valuations. Rate-sensitive sectors and duration assets face headwinds as long as inflation remains sticky above target.
The technology sector absorbed a 20 per cent forward P/E compression year-to-date even as earnings per share estimates rose approximately 17 per cent. The sector’s forward P/E now stands at 21.3 times, down from a 2024 high of 32.0 times and approaching the 20-year average multiple of 18.6 times. This divergence, where valuations decline while earnings estimates improve, represents a fundamental shift from the pattern that dominated 2024 and 2025, when valuation multiple expansion driven by AI enthusiasm far outpaced actual earnings growth.
Despite the compression, technology earnings remain extraordinarily strong. Analysts project the sector to grow earnings per share by 44 per cent in Q1 2026, accounting for 87 per cent of S&P 500 index earnings growth. Goldman Sachs has estimated that AI infrastructure investment will account for roughly 40 per cent of all S&P 500 earnings growth in 2026.
Energy sector stocks experienced the opposite dynamic. Chevron posted 35 per cent returns for the quarter, benefiting directly from elevated crude prices. Higher commodity prices translated quickly into stronger profit expectations, with the sector simultaneously experiencing both earnings upgrades and higher valuation multiples.
| Sector | P/E Change | Earnings Trend | YTD Performance |
|---|---|---|---|
| Technology | -20% (32.0x to 21.3x) | +17% EPS estimates | Compressed valuation |
| Energy | Multiple expansion | Upgrades on oil prices | +35% (Chevron) |
| Consumer Staples | Stable | Resilient margins | New all-time highs |
| Utilities | Stable | Defensive positioning | New all-time highs |
The financial services sector benefited from improved fundamentals in a higher-for-longer rate environment. Banks experienced net interest income margin expansion driven by the Federal Reserve’s maintenance of elevated short-term rates. Bank of America posted Q1 earnings per share of $1.11, up 25 per cent year-over-year and exceeding analyst expectations of $1.01. The bank raised its full-year 2026 net interest income growth guidance to 6 per cent to 8 per cent.
Goldman Sachs reported first-quarter 2026 earnings per common share of $17.55 with an annualised return on common equity of 19.8 per cent, demonstrating the substantial profitability elevated interest rates create for financial intermediaries.
Consumer Staples and Utilities reached new all-time highs even as technology stocks declined, acting as flight-to-safety plays amid elevated geopolitical and inflation uncertainties. Energy-importing sectors bore the brunt of the energy shock selloff, but consumer staples, being less directly impacted by energy prices while maintaining stable demand and pricing power, remained resilient.
Sector-level dynamics determine whether an investor’s portfolio participates in the recovery or suffers from concentration in areas still repricing. Diversification across sectors with different interest rate and energy sensitivities matters more now than during narrow mega-cap leadership.
The Shiller P/E uses a decade of inflation-adjusted earnings data, averaging ten years of real earnings to smooth volatility. This methodology makes the metric resilient to short-term disruptions but slow to reflect earnings acceleration. The decade-long averaging window means current profitability surges take years to meaningfully move the ratio.
Forward P/E operates differently. It prices in analyst expectations for the next twelve months, capturing current earnings momentum but vulnerable to overly optimistic projections. When earnings accelerate rapidly, as they have in 2026 with consensus growth expectations reaching 18 per cent, forward multiples compress even if prices rise, because the denominator (expected earnings) grows faster than the numerator (current price).
Both metrics can be correct simultaneously during periods of rapid earnings growth. The Shiller P/E of 40.09 warns about long-term mean reversion risk, flagging that the market trades at valuations exceeded only once in 155 years. The forward P/E of 19.8 suggests near-term earnings support, with valuations at five-year average levels.
Historical precedent adds weight to the Shiller warning:
What each metric captures:
Mean Reversion Warning Following the two prior instances when the Shiller P/E exceeded 40, the S&P 500 declined 49 per cent and 25 per cent respectively.
The NBER research on valuation ratios and long-run stock market forecasting, co-authored by Robert Shiller who developed the CAPE methodology, demonstrates that elevated valuation ratios have historically preceded extended periods of below-average returns, with the relationship holding across more than a century of market data.
Investors who understand what each metric measures can avoid false precision. Neither is the “right” answer in isolation. The Shiller P/E warns about long-term mean reversion risk. The forward P/E suggests near-term earnings support.
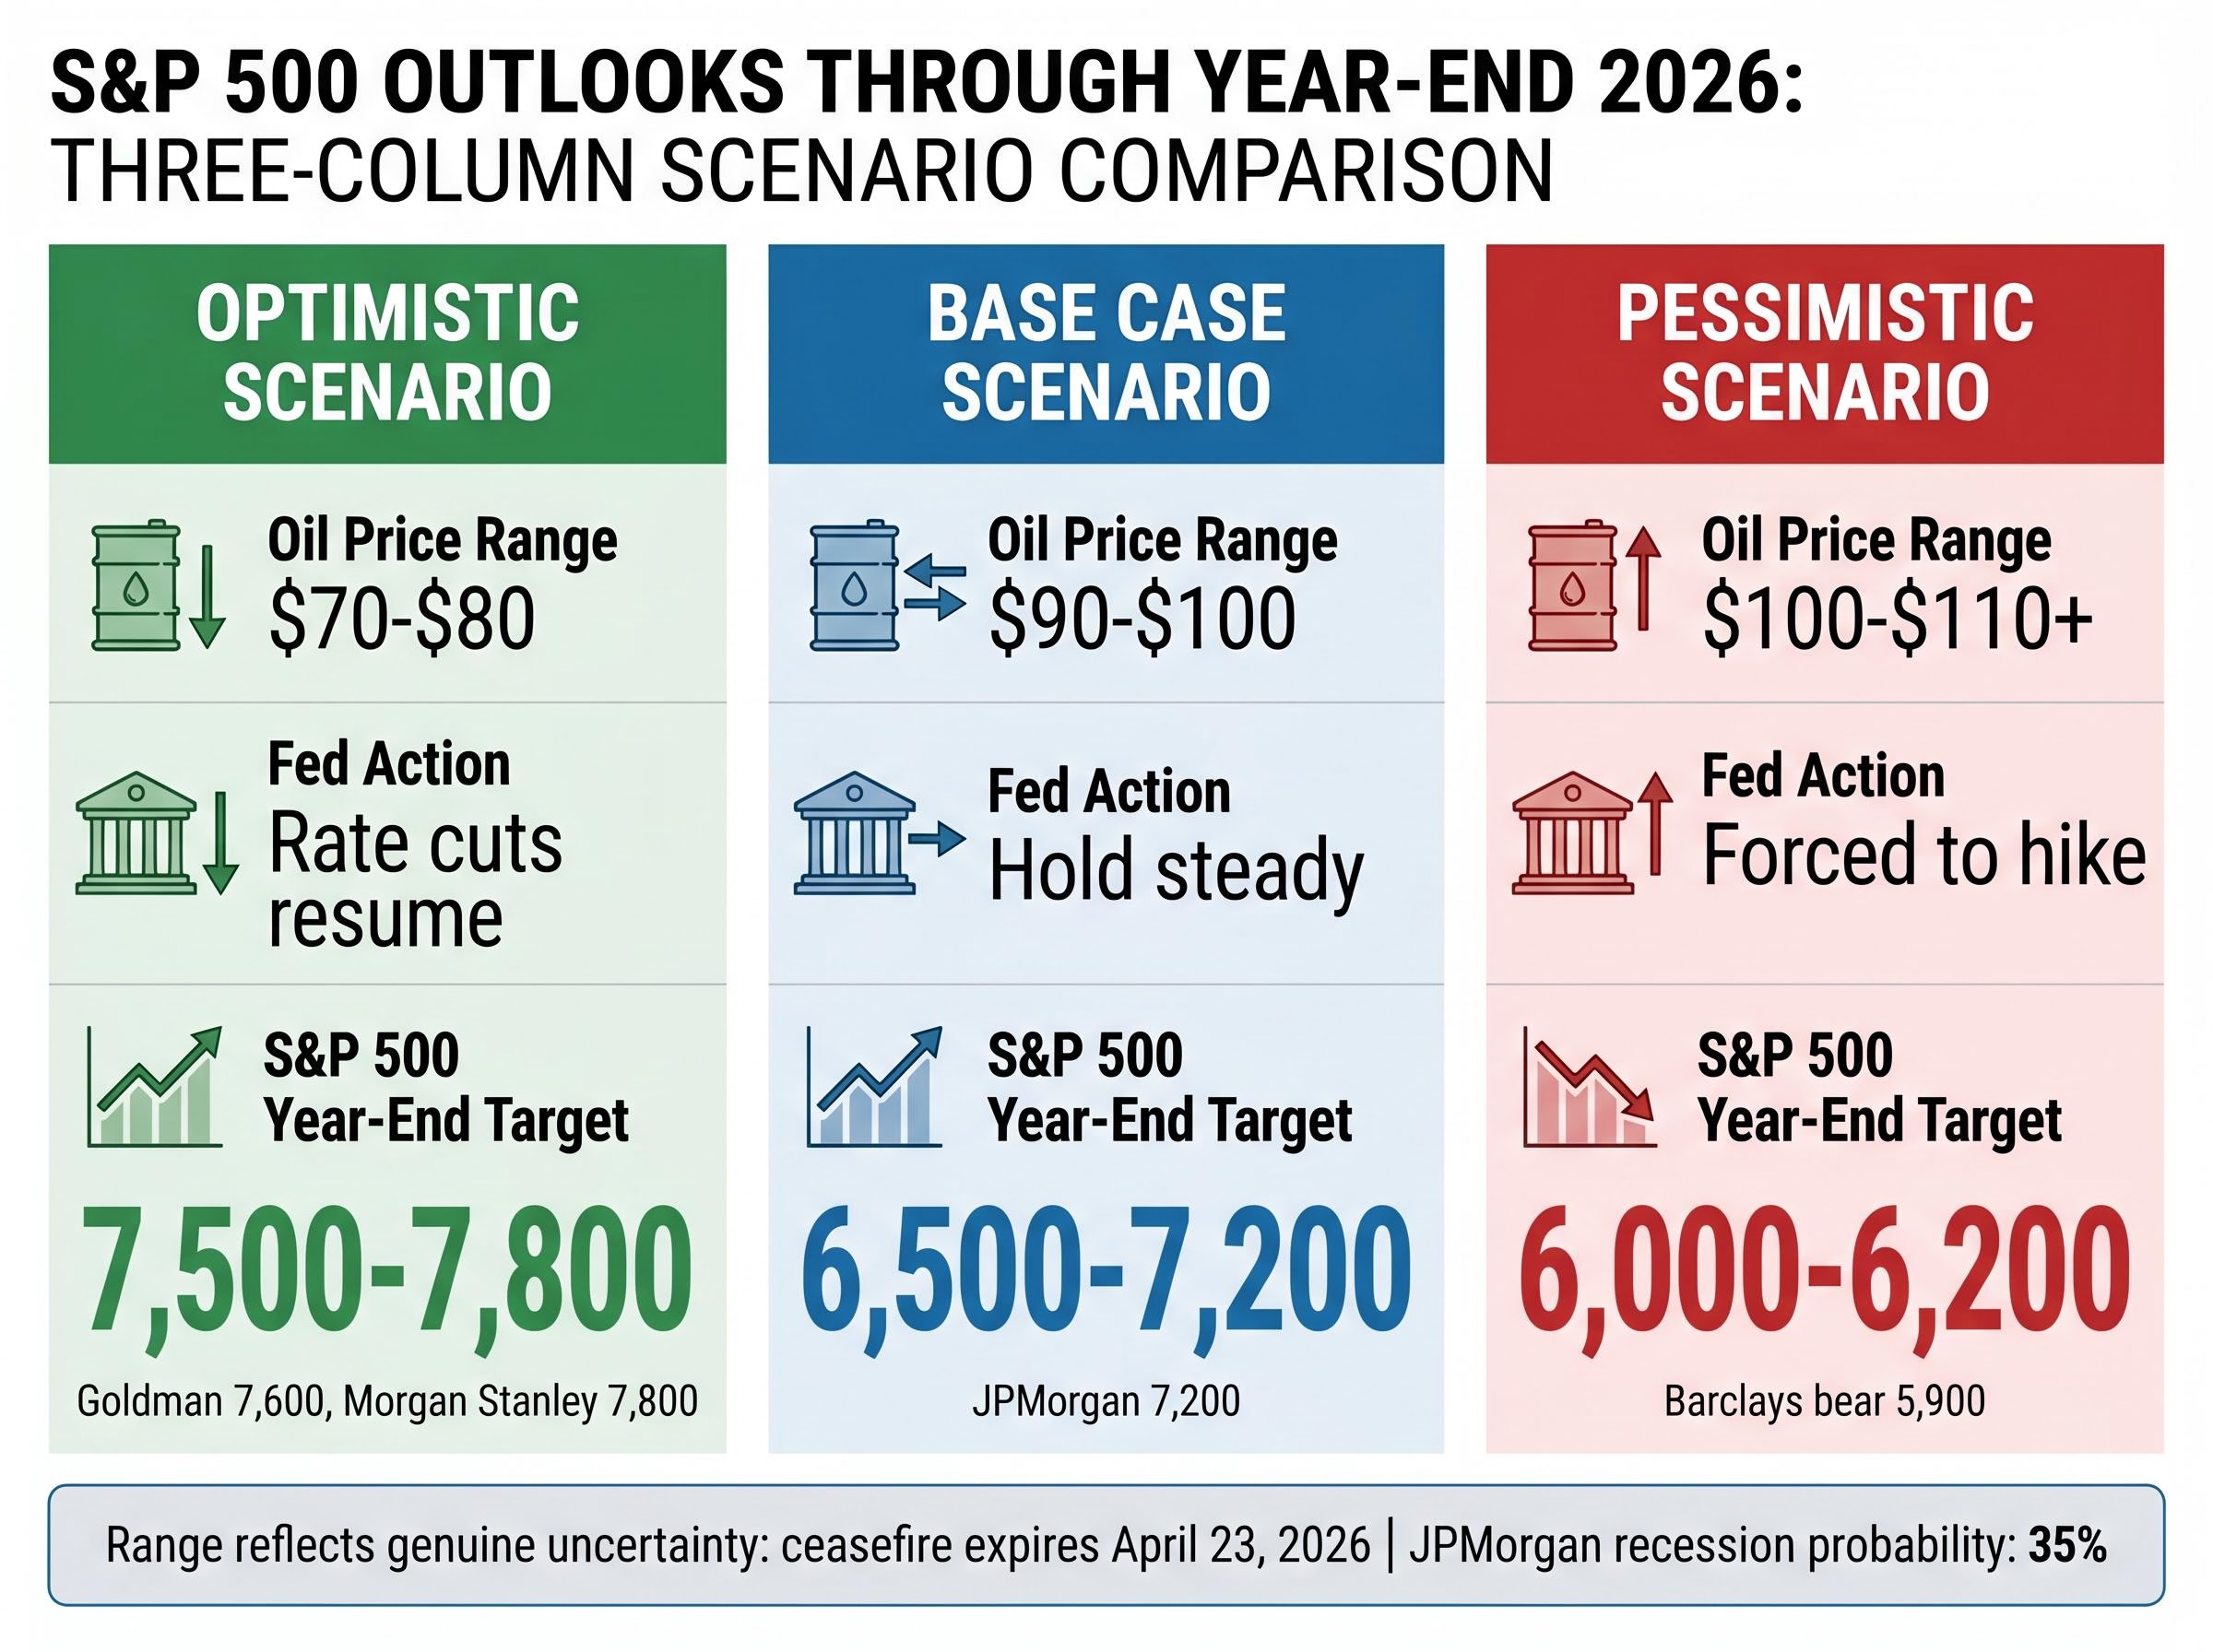
The wide range of analyst targets, from 5,900 (Barclays bear case) to 7,800 (Morgan Stanley), reflects genuine uncertainty rather than analytical incompetence. The path forward depends on variables, particularly geopolitical resolution and crude oil stabilisation, that remain outside the market’s control.
The broad range of S&P 500 expected return ranges for 2026 highlights the complexity of projecting outcomes when valuations are stretched and macroeconomic uncertainty is high, with some forecasts calling for historic single-digit returns over the coming decade.
| Scenario | Oil Price Range | Fed Action | S&P 500 Year-End Range |
|---|---|---|---|
| Optimistic | $70-$80 | Rate cuts resume | 7,500-7,800 |
| Base Case | $90-$100 | Hold steady | 6,500-7,200 |
| Pessimistic | $100-$110+ | Forced to hike | 6,000-6,200 |
The optimistic scenario envisions geopolitical resolution of the Iran conflict, gradual normalisation of crude oil prices toward $70-80 per barrel, moderation of inflation toward the Federal Reserve’s 2 per cent target, and broadening of earnings growth beyond technology. Goldman Sachs maintains a year-end target of 7,600, predicated on projected earnings of $309 per share for full-year 2026. Morgan Stanley’s 12-month target of 7,800 assumes 17 per cent earnings growth and modest valuation contraction.
The base case involves moderate resolution of geopolitical tensions, oil price stabilisation in the $90-100 range, persistent but gradually moderating inflation, Federal Reserve maintenance of current rate levels through 2026, and corporate earnings growth that meets but does not substantially exceed current consensus expectations. Under this scenario, the S&P 500 might consolidate in the 6,500-7,200 range. JPMorgan cut its year-end target from 7,500 to 7,200 in mid-March, reflecting greater caution about sustainability.
The pessimistic scenario involves geopolitical escalation, crude oil prices remaining elevated above $100-110 per barrel, persistent inflation that forces the Federal Reserve toward rate hikes, substantial corporate earnings disappointments as input costs compress margins, and broad repricing that carries the S&P 500 toward 6,000-6,200. JPMorgan forecasts a 35 per cent recession probability in 2026. Barclays outlined a bear case of 5,900.
The ceasefire announced in mid-April expires on 23 April 2026 (Wednesday evening), with planned peace talks between the United States and Iran remaining uncertain. Oil futures rose nearly 5 per cent on 21 April as the Strait of Hormuz remained closed ahead of the final day of the ceasefire.
Key monitoring points for determining which scenario unfolds:
Scenario thinking helps investors stress-test their portfolios rather than anchoring to a single forecast. The wide range reflects genuine uncertainty, not analyst incompetence.
S&P 500 valuations in late April 2026 present a genuinely mixed picture. The Shiller P/E at 40.09 signals long-term mean reversion risk, while forward P/E compression to 19.8 times reflects substantial repricing already absorbed. The energy shock has rewired inflation expectations, paralysed the Fed, and triggered dramatic sector rotation from technology toward energy, financials, and defensives.
Neither headline bulls nor headline bears are clearly wrong. The optimistic case rests on 18 per cent earnings growth, geopolitical resolution, and oil normalisation toward $70-80 per barrel. The pessimistic case points to the second-highest Shiller P/E in 155 years, a Federal Reserve constrained by 3.3 per cent inflation, and fragile ceasefire dynamics that could send crude back toward $118.
The path forward depends on variables, particularly geopolitical resolution and crude oil stabilisation, that remain outside the market’s control. Investors should stress-test their portfolios against the three scenarios outlined above and monitor the ceasefire dynamics expiring 23 April, April inflation data released in early May, and technology sector earnings for signals of which path is unfolding.
This article is for informational purposes only and should not be considered financial advice. Investors should conduct their own research and consult with financial professionals before making investment decisions.
The Shiller P/E, also called CAPE, averages ten years of inflation-adjusted earnings to smooth short-term volatility, giving a long-run view of whether the market is over or undervalued. At 40.09 in April 2026, it sits at the second-highest level in 155 years of recorded data, exceeded only by the dot-com peak that preceded a 49 per cent market decline.
The forward P/E uses analyst projections for the next twelve months, and with 2026 earnings growth consensus running at 18 per cent, rising earnings estimates are pulling the forward multiple down to 19.8 times even as prices recover. The Shiller P/E uses a decade of historical earnings, so it responds slowly to near-term profit acceleration, creating the divergence.
The closure triggered a 93.4 per cent surge in crude oil from $61 to $118 per barrel, pushing March CPI to 3.3 per cent year-over-year and forcing the Federal Reserve to hold rates steady rather than cut, which removed a key support for equity valuations. Energy stocks benefited while rate-sensitive and energy-importing sectors faced significant repricing pressure.
The five key signals are: durability of the mid-April ceasefire (which expired 23 April 2026), Federal Reserve communications on potential rate hikes, April earnings season margin data, technology sector Q1 earnings validating 44 per cent growth projections, and whether crude oil stabilises below $100 per barrel or reaccelerates. These variables determine whether the index ends the year near 7,500 or closer to 6,000.
Energy stocks led gains, with Chevron posting 35 per cent returns for the quarter as crude prices surged. Financials benefited from net interest income expansion in a higher-for-longer rate environment, while Consumer Staples and Utilities reached new all-time highs as flight-to-safety plays, contrasting sharply with the 20 per cent forward P/E compression absorbed by the technology sector.


