
OpenAI Misses User Target, Sends AI Stocks Tumbling on 28 April
2 hrs ago

Brent crude crossed $104 per barrel on 28 April 2026, not because of an OPEC production cut or a demand surge, but because a single 54-kilometre waterway remains functionally closed for the second consecutive month. The Strait of Hormuz, through which roughly one-fifth of global oil normally flows, has been below 10% of normal crossing levels since late February. A brief reopening window around 17-18 April was quickly reversed after Tehran reimposed restrictions, citing the U.S. naval blockade as a breach of the Pakistan-brokered ceasefire. The diplomatic situation deteriorated further over the weekend of 26-27 April, when President Trump cancelled plans to send negotiators to Pakistan for a new round of talks, having rejected an Iranian proposal that would reopen Hormuz while deferring nuclear discussions to a later stage.
What follows traces the causal chain from that single geopolitical flashpoint through oil prices, inflation expectations, central bank positioning, and the simultaneous pressure on equities and gold, giving readers a unified picture of how one chokepoint is cascading across every major asset class simultaneously.
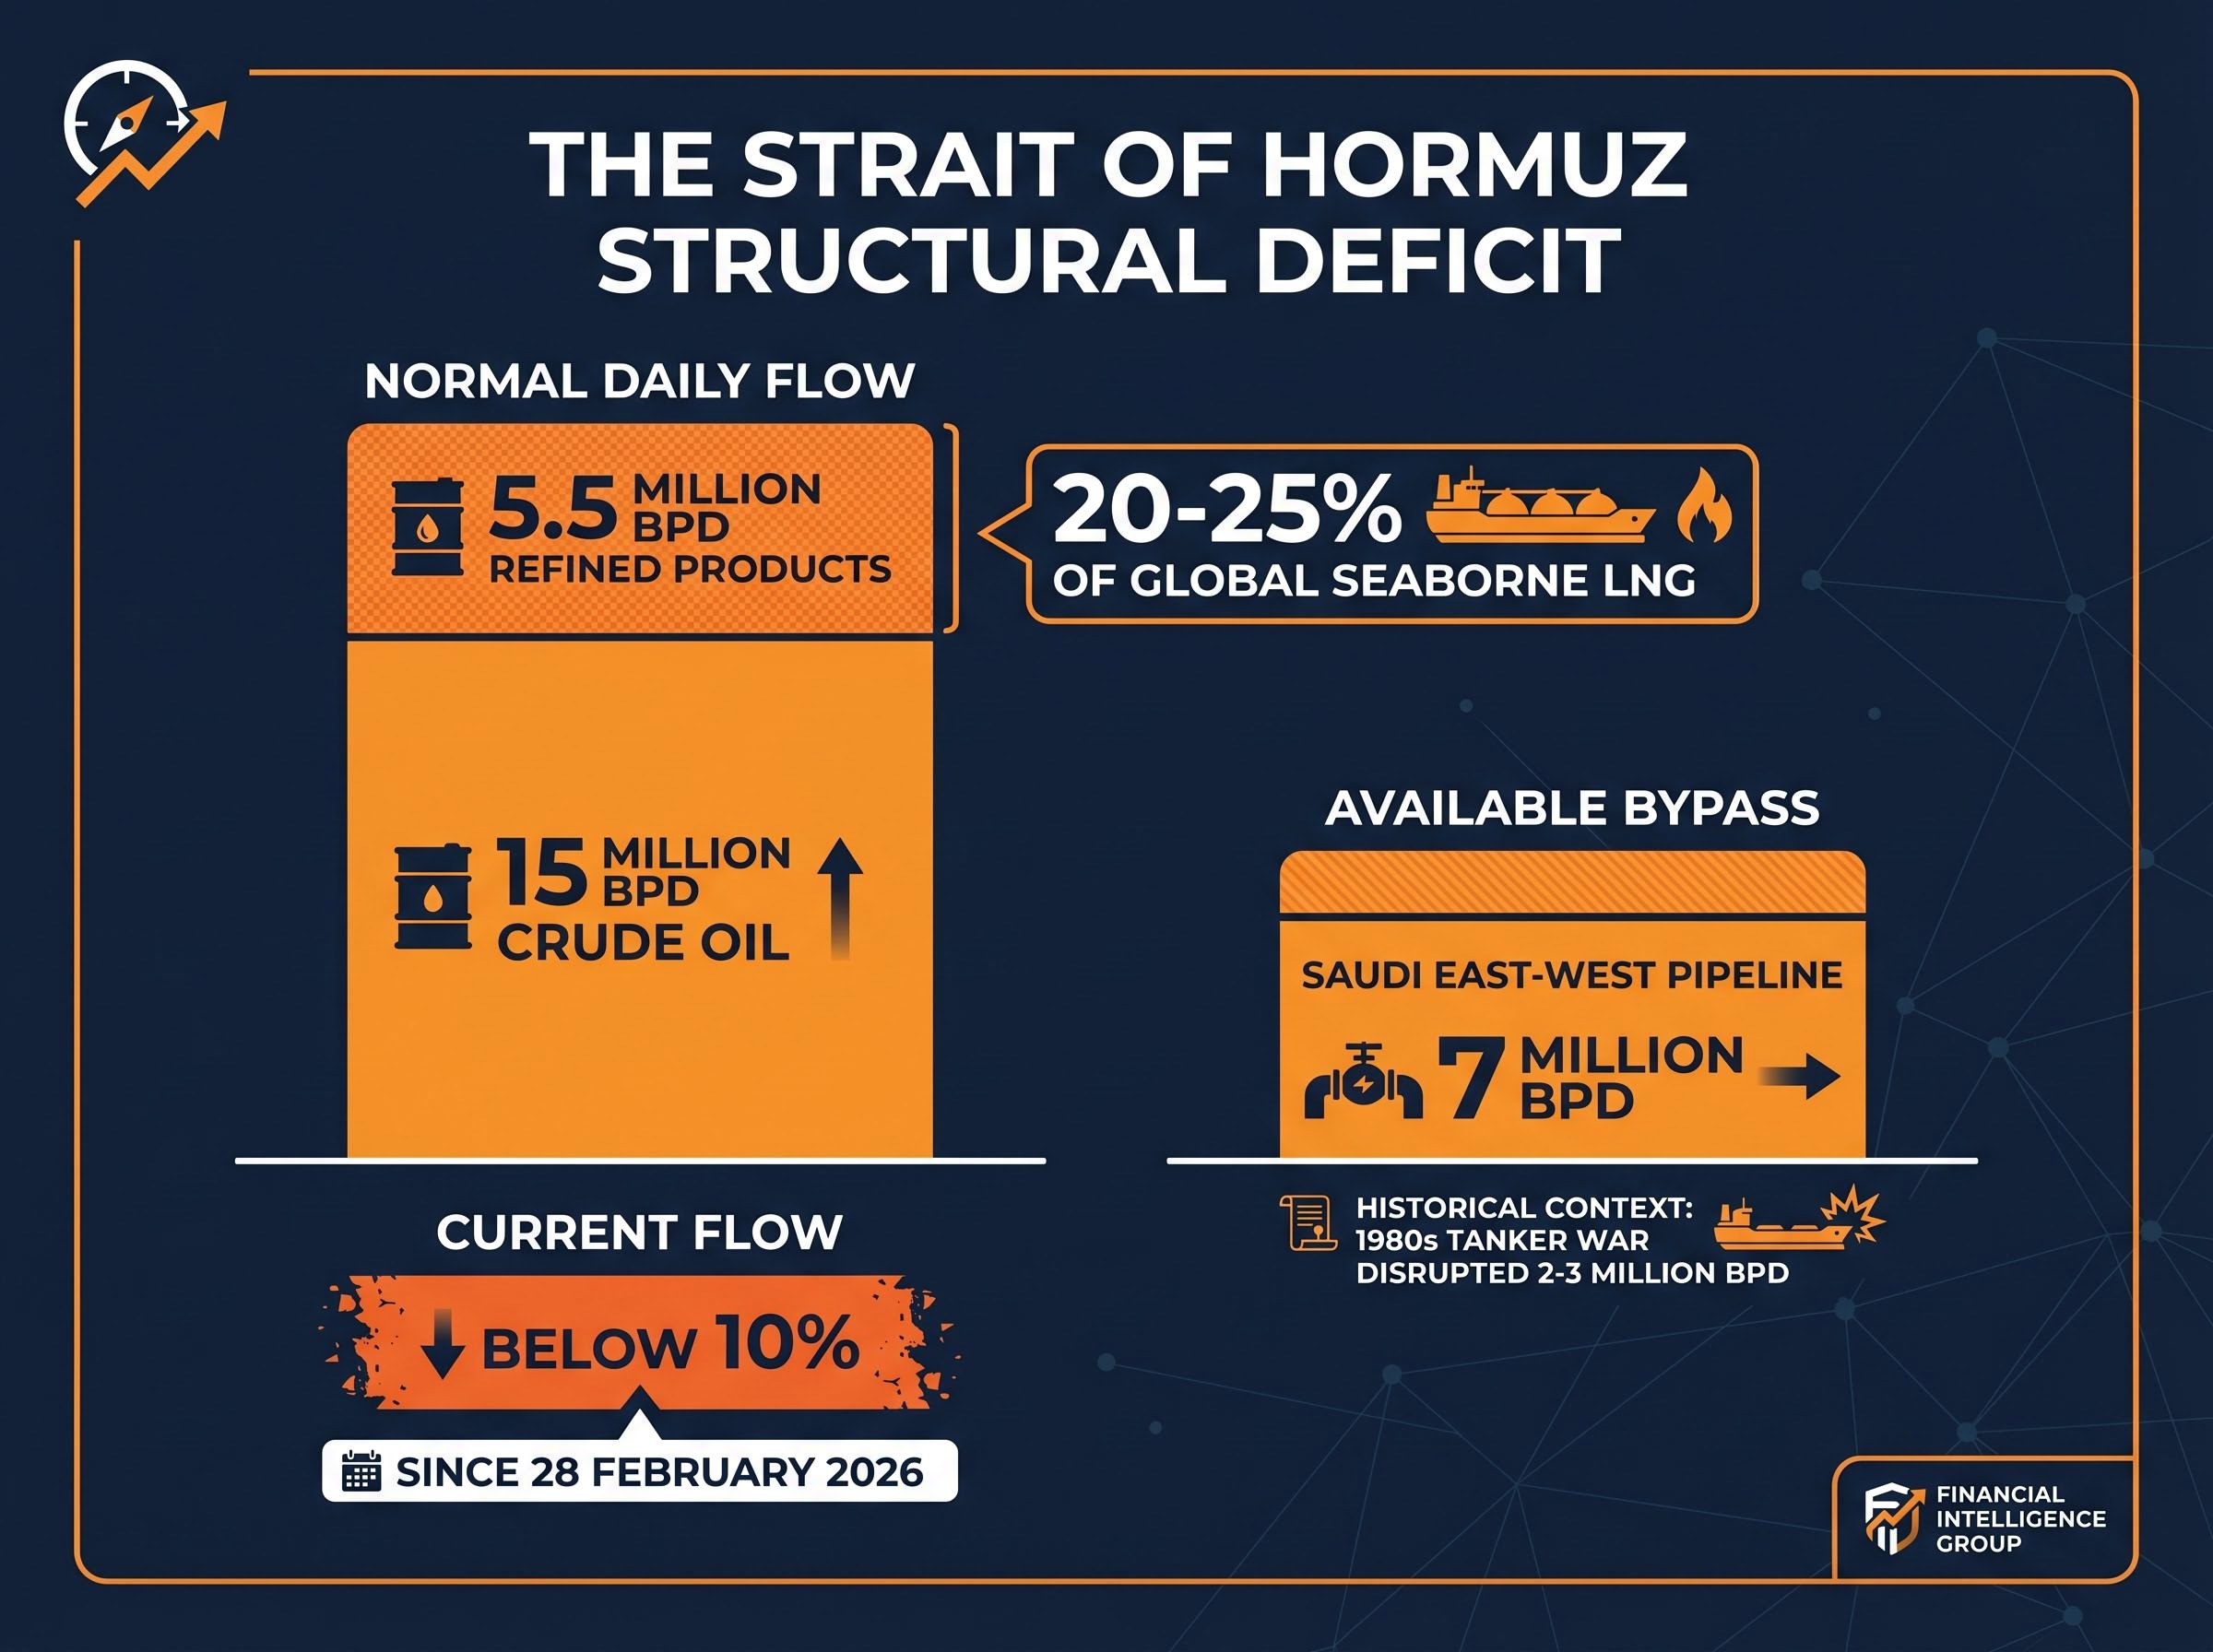
The arithmetic alone sets this crisis apart. The Strait of Hormuz normally carries:
All three categories are blocked simultaneously. Crossings have fallen to well below 10% of normal levels since the blockade began on 28 February 2026. A brief reopening on 17-18 April allowed a handful of tankers through before Tehran reimposed restrictions, citing the ongoing U.S. naval blockade.
The EIA Hormuz chokepoint data confirms the Strait carried approximately 20 million barrels per day in 2024, representing around 20% of global petroleum liquids consumption, a baseline that makes the current sub-10% crossing level one of the most severe supply disruptions in the modern era of oil markets.
What energy modellers had previously classified as a tail-risk event is now an operational baseline, with shipping suspended and no confirmed timeline for resumption.
The most commonly cited historical parallel is the 1980s Tanker War, which disrupted approximately 2-3 million bpd of Gulf flows. That crisis produced oil price spikes but did not trigger a global recession, partly because the volume affected was a fraction of today’s figure. The current disruption blocks roughly seven to ten times that amount. Existing mental models from past oil shocks do not scale to this scenario.
Saudi Arabia’s East-West Pipeline has been restored to its full capacity of 7 million bpd, representing the primary land-based alternative. The arithmetic, however, is unforgiving: 7 million bpd of bypass capacity against approximately 20 million bpd of combined throughput blocked creates a structural deficit that no combination of alternatives can bridge. Floating storage buffers are being overwhelmed as the closure extends into its second month.
The closure is not an accident of geography. It is the predictable result of specific decisions made over the past 72 hours, layered onto a two-month military campaign.
The breakdown followed three stages:
The rejected proposal was specific: Iran offered to reopen Hormuz and end hostilities while deferring nuclear programme talks to a later stage. Trump refused. Eliminating Iran’s nuclear capability has been a stated objective of the joint U.S.-Israeli campaign since its launch in late February 2026.
Iran’s stated condition is straightforward: the U.S. lifts its naval blockade of Iranian ports in exchange for Hormuz reopening, with nuclear talks deferred to a subsequent negotiating round. The U.S. position treats nuclear capability elimination as non-negotiable; no confirmed willingness to accept a deferral framework has emerged. No third-party mediation by China, Russia, or the United Nations has been confirmed as of 28 April 2026.
Backchannel communications between U.S. envoy Steve Witkoff and Iranian Foreign Minister Araghchi have continued via direct text messages even as in-person talks remain suspended, a channel that has historically served as the first indicator of diplomatic thaw before any formal negotiating framework is announced.
The gap matters for pricing. A deal that defers nuclear talks is structurally more achievable than one that resolves them, meaning the market is pricing a solvable problem that political decisions are currently preventing.
The headline figures (millions of barrels per day blocked, bypass capacity shortfalls) describe the deficit in broad terms. Energy analysts calculate the effective shortfall more precisely by netting blocked throughput against bypass capacity and then subtracting available storage buffers. The result is a time-bound estimate of how long the current situation can persist before physical constraints force a resolution.
JPMorgan’s Iran storage estimate provides a worked example. The bank estimates Iran holds approximately 47 million barrels of usable onshore storage. At the pre-closure export run-rate of 1.8-2.1 million bpd, that storage offers roughly 22-25 days of export cover before Iran hits what analysts call its storage shut-in threshold, the point at which production must be curtailed because there is nowhere to put the oil.
At the pre-closure run-rate, JPMorgan estimates Iran’s onshore storage provides approximately 22-25 days of export cover before the shut-in threshold is reached.
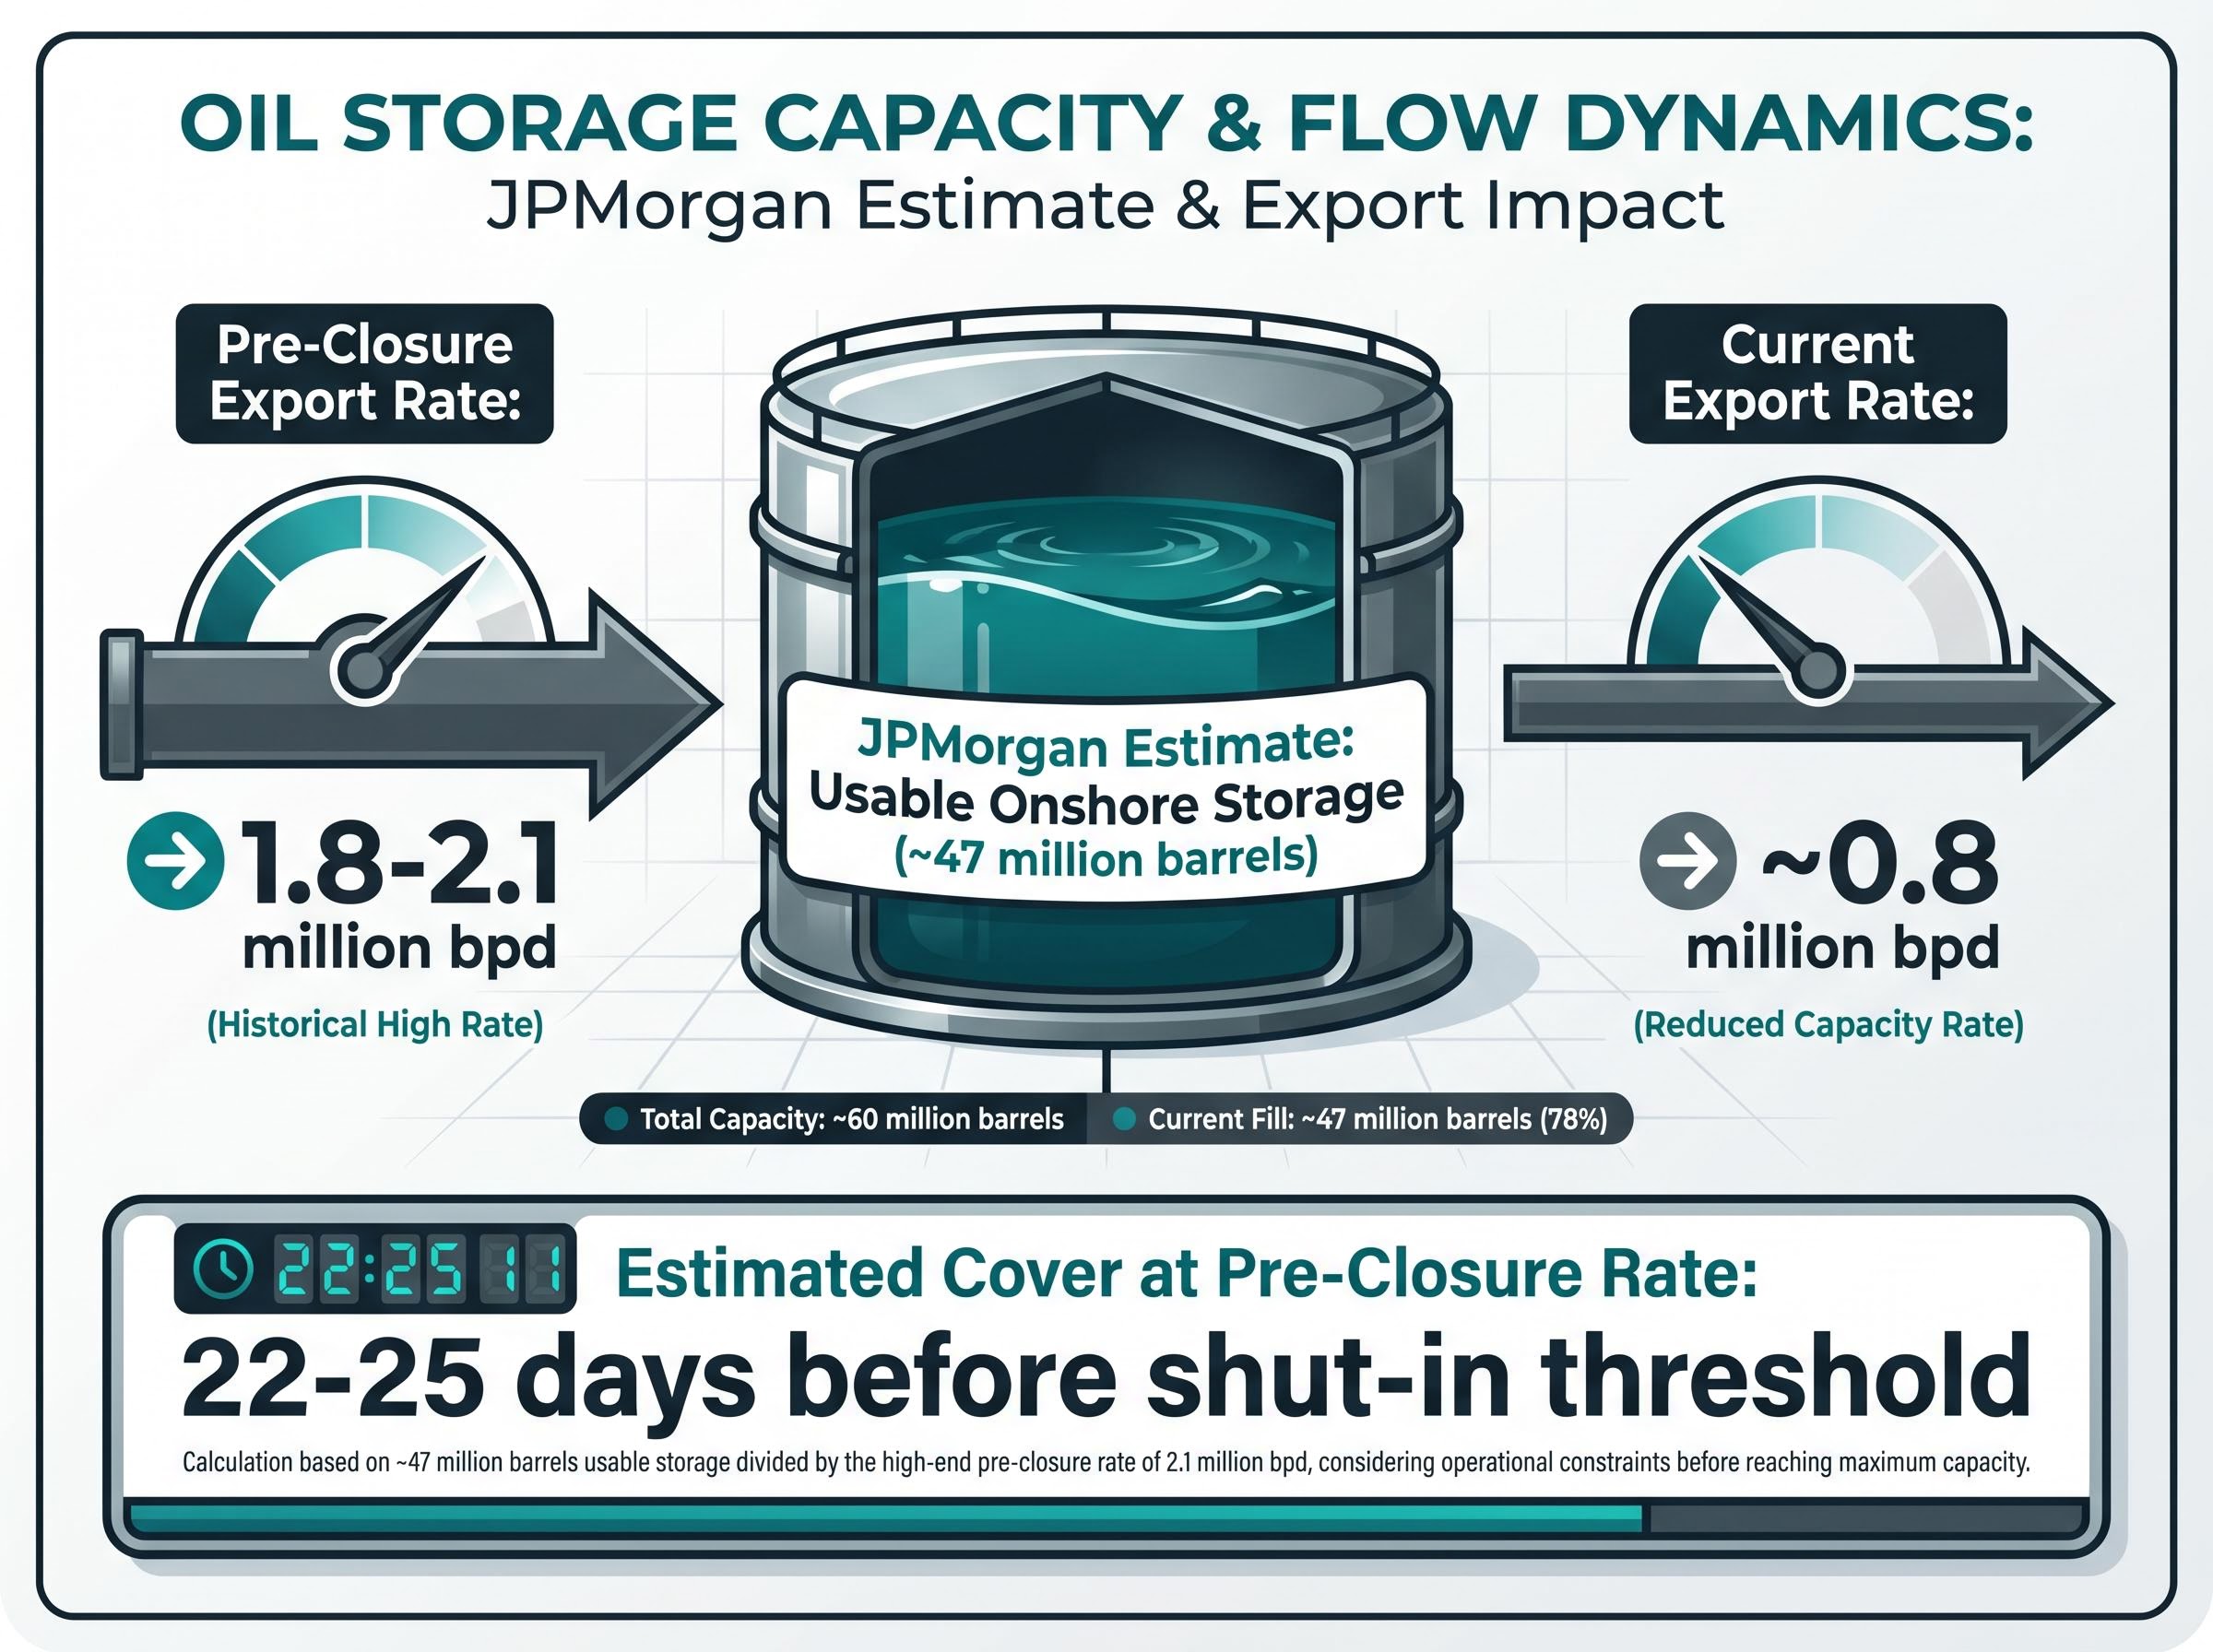
Iranian exports have already dropped to approximately 0.8 million bpd, with the shadow fleet providing limited offset but not altering the structural picture. The table below summarises the shift.
| Metric | Pre-Closure Level | Current Level |
|---|---|---|
| Iranian exports (bpd) | 1.8-2.1 million | ~0.8 million |
| Hormuz crossings (% of normal) | 100% | Below 10% |
| Saudi pipeline capacity utilisation | Partial | Full (7 million bpd) |
This storage-cover calculation is the single most important framework for assessing when a resolution becomes operationally necessary for Iran. It gives investors a data-driven way to interpret future developments rather than relying on diplomatic speculation alone.
The price level is the starting point. Brent settled at approximately $104.22, up $2.53 (+2.49%) on 28 April. West Texas Intermediate (WTI) reached approximately $99.64, up $3.27 (+3.39%). Both sit well above pre-conflict levels, and analyst forecasts project Brent sustaining above $100-$110 per barrel if the closure extends 30-60 days as floating storage buffers are exhausted.
The inflation transmission is the second step. Sustained $100+ oil feeds into consumer prices through three channels:
Dallas Fed modelling suggests a sustained $100+ oil environment would push headline inflation approximately 0.6-0.8 percentage points above baseline, forcing central banks in oil-importing economies to delay or reverse easing cycles.
The third step is the central bank bind. Inflation from an exogenous supply shock is not addressable with rate hikes without simultaneously damaging growth. Raising rates would cool demand but would not bring a single additional barrel through the Strait. This is the stagflationary scenario that analysts have begun pricing in: persistent inflation alongside weakening economic activity.
NBER research on oil shocks and monetary policy documents how exogenous supply-driven price surges create a policy bind in which rate hikes address the inflation symptom without resolving the underlying supply constraint, a dynamic that directly maps onto the stagflationary scenario analysts are now pricing into forward curves.
No updated statements from the Federal Reserve or Bank of Canada had been confirmed as of 28 April 2026, though both are scheduled to deliver decisions later in the week.
The selloff on 28 April was broad but not uniform. By 07:47 ET, S&P 500 futures had retreated approximately 42 points (-0.6%) to around 7,193-7,196. Nasdaq 100 futures fell approximately 310 points (-1.1%), reflecting heavy selling in the technology sector. Dow futures edged up approximately 112 points (+0.2%), a divergence driven by sector composition rather than broad optimism.
The S&P/TSX composite settled lower by 0.3% at 33,818.19, extending a losing streak from prior sessions despite the crude price rise that would normally support the commodities-weighted index. Vital Knowledge analysts characterised the prevailing market tone as “gloomy,” attributing the sentiment to climbing oil prices alongside an AI sector selloff that hit Oracle (-6%), CoreWeave (-7%), and SoftBank (-9.86%).
| Asset | Direction (28 April) | Move (approx.) | Driver |
|---|---|---|---|
| Brent crude | Up | +$2.53 (+2.49%) | Supply deficit deepening |
| WTI | Up | +$3.27 (+3.39%) | Supply deficit deepening |
| S&P 500 futures | Down | -42 pts (-0.6%) | Inflation, growth fears |
| Nasdaq 100 futures | Down | -310 pts (-1.1%) | AI selloff, rate sensitivity |
| TSX composite | Down | -0.3% to 33,818.19 | Broad risk-off sentiment |
| Gold futures | Down | -1.86 to -1.97% to ~$4,606.24 | Rate hike expectations, dollar strength |
| U.S. Dollar Index | Up | +0.23% to ~98.54 | Safe-haven flows, rate expectations |
Gold futures dropped approximately 1.86-1.97% to around $4,606.24, a three-week low. The mechanism is counterintuitive but structurally consistent. Gold is a non-yielding asset; when an inflationary shock increases the probability of rate hikes, the opportunity cost of holding gold rises, overwhelming the traditional safe-haven bid. A stronger U.S. dollar (DXY at approximately 98.54, up 0.23%) adds a second channel of downward pressure by increasing the effective purchase price for non-dollar buyers.
The simultaneous decline in equities and gold removes what many investors treat as a natural hedge. When the same macro shock pressures both asset classes, portfolio construction assumptions built around the standard risk-off playbook require revisiting.
A portfolio stress-testing framework for this environment requires mapping exposure across energy equities, inflation-sensitive instruments, and airline and transport margins simultaneously, since the same supply shock that lifts crude prices compresses margins across the entire goods distribution chain.
Two distinct scenarios frame the weeks ahead:
Iran’s onshore storage clock is the structural mechanism creating asymmetric pressure over time. At the current reduced export rate of approximately 0.8 million bpd, Iran’s operational runway is constrained but not immediately terminal. The next 2-4 weeks represent the window in which storage pressure intensifies toward the shut-in threshold.
Two concrete signals will clarify which scenario is materialising. The first is the Iran storage timeline itself: as inventories approach the JPMorgan-estimated shut-in threshold, Tehran’s negotiating calculus shifts. The second is the Bank of Canada and Federal Reserve decisions scheduled for the week of 28 April 2026, which will test whether central banks publicly acknowledge the oil-inflation linkage or continue to treat the disruption as transient.
The closure has no modern precedent. The diplomatic impasse has identifiable structure but no confirmed resolution path. What the data provides is not a prediction but a framework: storage clocks, inflation transmission channels, and central bank calendars that will determine how this crisis translates from geopolitical event into portfolio reality.
For investors tracking how the oil shock feeds into monetary policy across all major economies, our full explainer on this week’s central bank decisions covers the Fed, ECB, Bank of England, and Bank of Japan announcements simultaneously, including the Bank of Japan’s yen intervention calculus near the 160 threshold and the forward guidance language that will set yield differentials through mid-2026.
This article is for informational purposes only and should not be considered financial advice. Investors should conduct their own research and consult with financial professionals before making investment decisions. Past performance does not guarantee future results. Financial projections referenced in this analysis are subject to market conditions and various risk factors.
The Strait of Hormuz is a 54-kilometre waterway through which roughly 20% of global petroleum liquids and 20-25% of seaborne LNG normally flow. When crossings fall below 10% of normal levels, as they have since late February 2026, the resulting supply deficit pushes oil prices sharply higher, with Brent reaching $104 per barrel by 28 April 2026.
Iran reimposed restrictions after a brief reopening on 17-18 April, citing the ongoing U.S. naval blockade of Iranian ports as a violation of ceasefire terms. Diplomatic talks collapsed further when President Trump cancelled negotiator travel to Pakistan on 26-27 April after rejecting an Iranian proposal to reopen the Strait while deferring nuclear discussions.
JPMorgan estimates Iran holds approximately 47 million barrels of usable onshore storage, providing roughly 22-25 days of export cover at pre-closure run-rates before reaching the storage shut-in threshold where production must be curtailed. With exports already reduced to around 0.8 million bpd, the next 2-4 weeks represent the critical pressure window.
Gold is a non-yielding asset, and when an inflationary oil shock raises the probability of interest rate hikes, the opportunity cost of holding gold increases, overwhelming the usual safe-haven bid. A stronger U.S. dollar, with the DXY rising to approximately 98.54, adds further downward pressure by raising the effective cost for non-dollar buyers.
Investors should monitor Iran's onshore storage levels approaching the JPMorgan-estimated shut-in threshold, which shifts Tehran's negotiating calculus, and the Bank of Canada and Federal Reserve decisions scheduled for the week of 28 April 2026, which will signal whether central banks publicly acknowledge the oil-inflation link or continue treating the disruption as transient.


