
Why Cyber Maturity Is Now a Revenue Driver for ASX Tech Stocks
34 mins ago

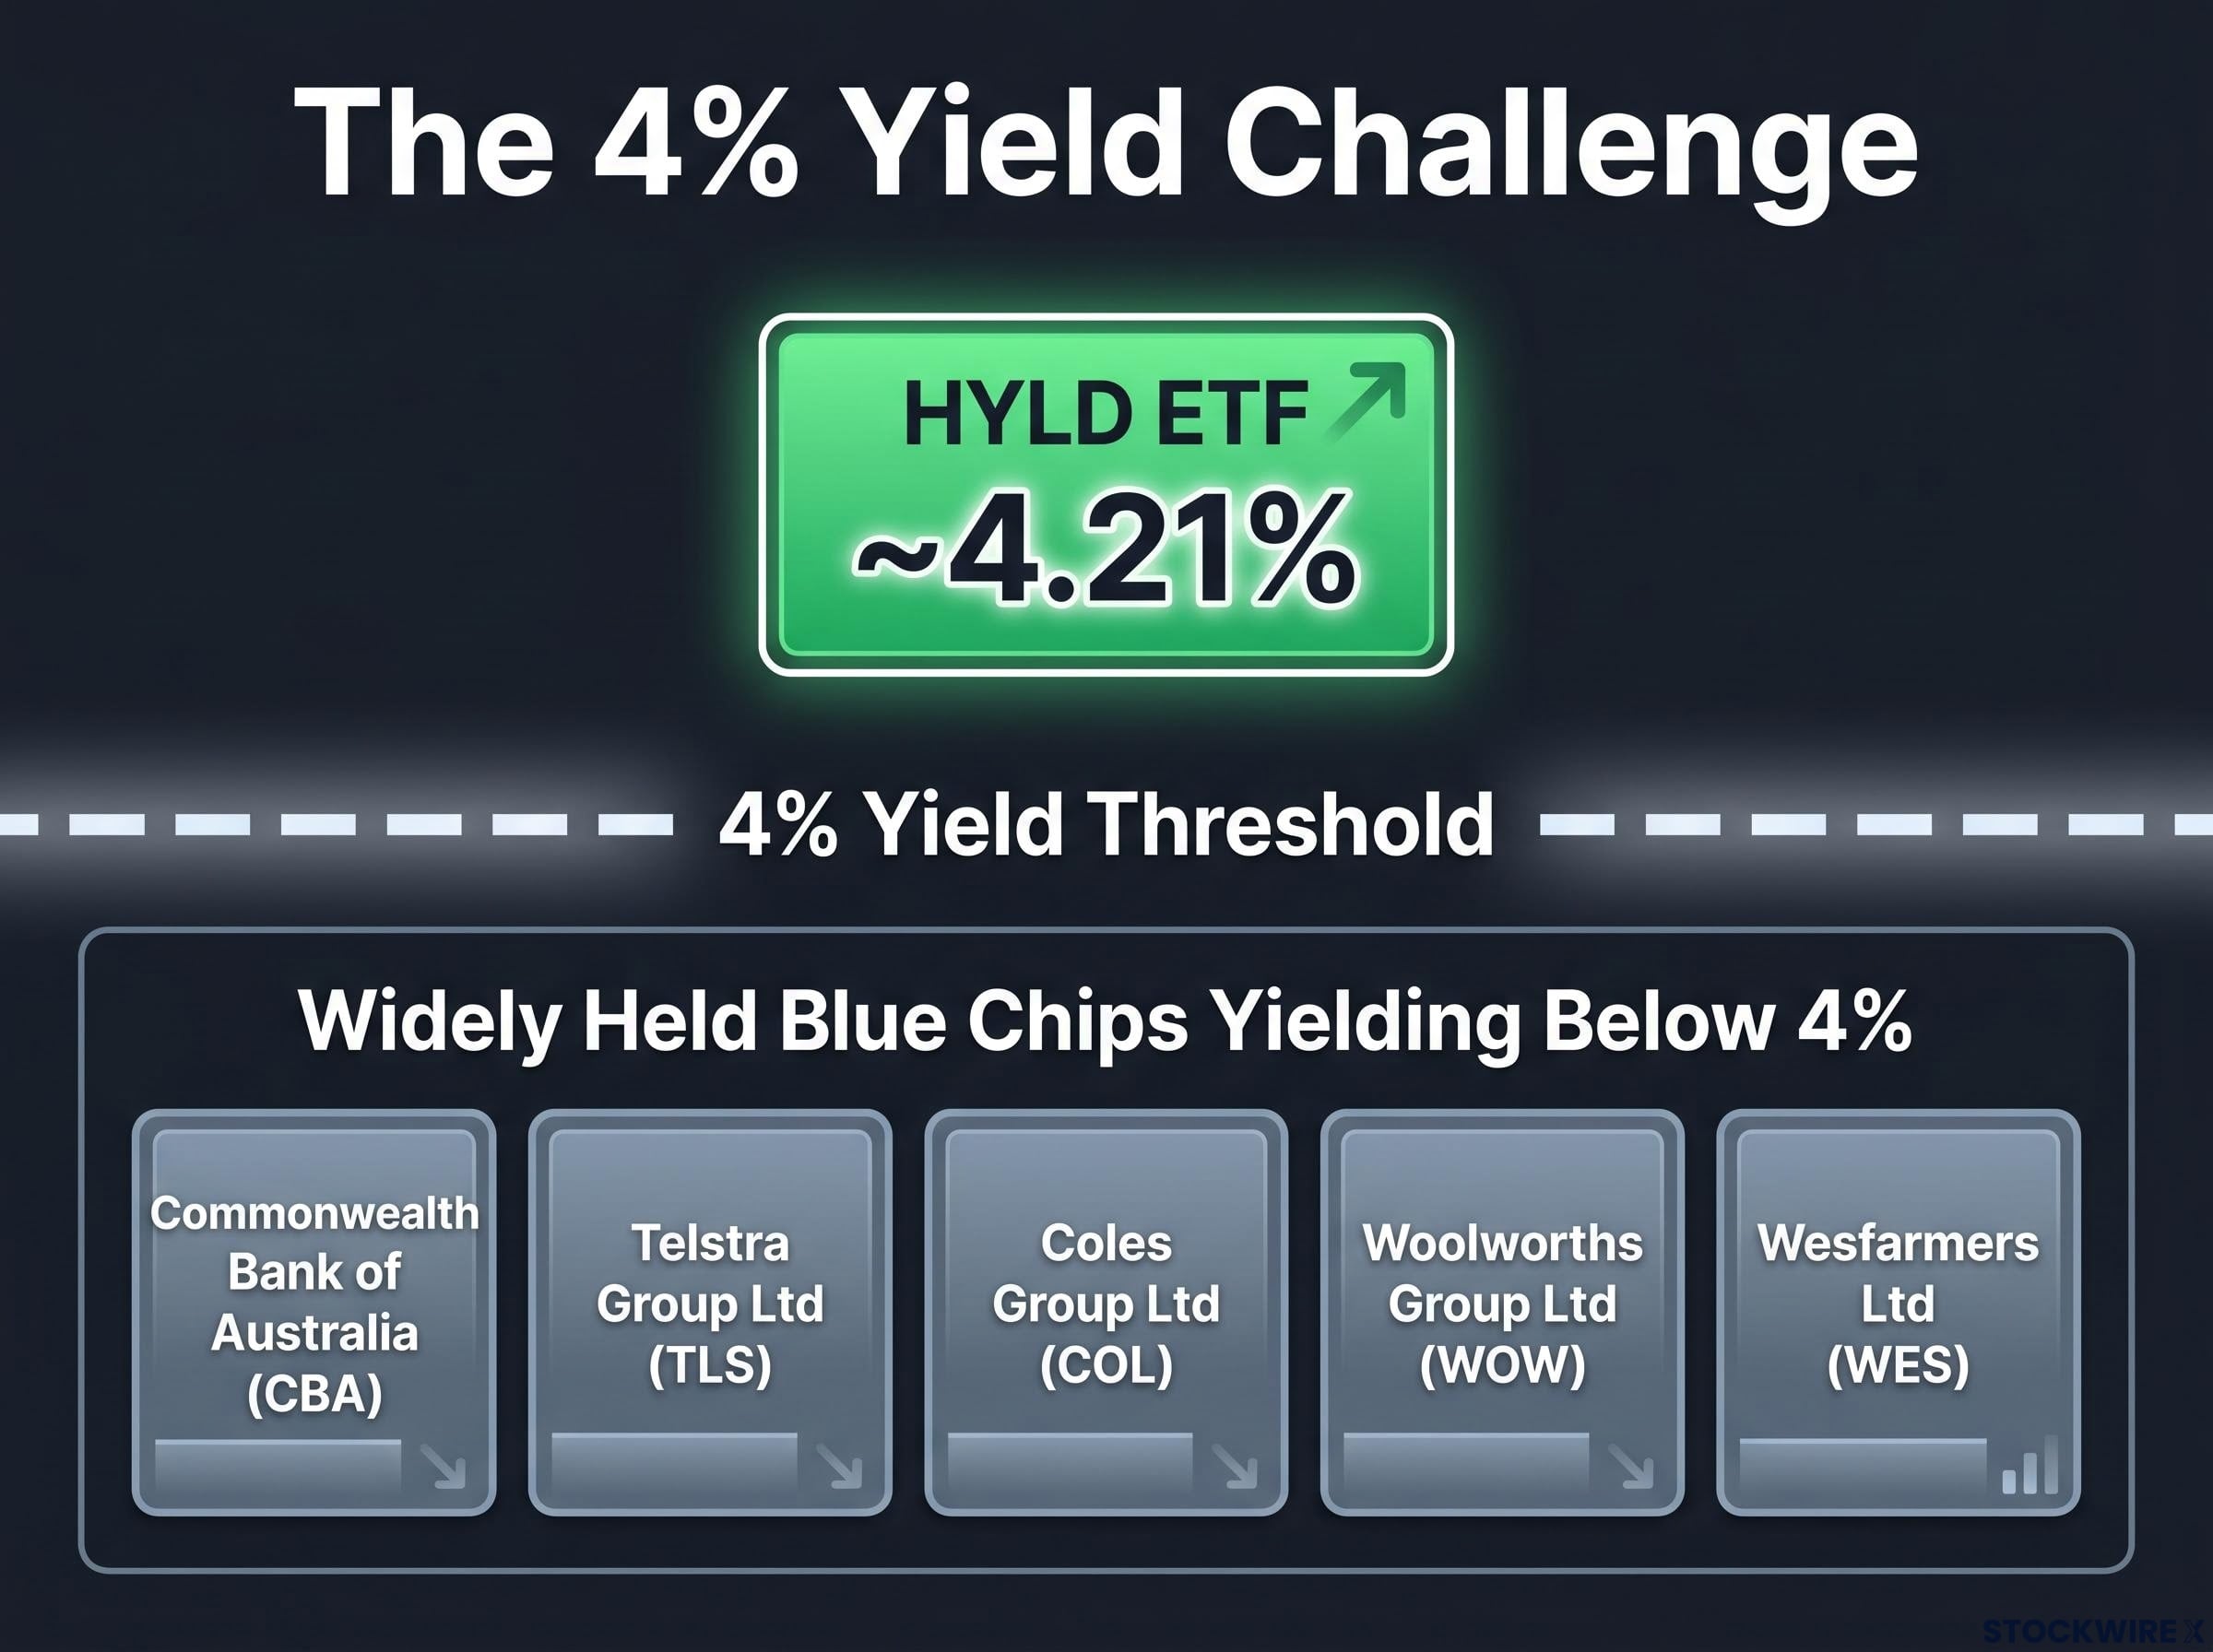
Monthly-paying ASX income funds that clear a 4% yield are genuinely scarce. The BetaShares S&P Australian Shares High Yield ETF (ASX: HYLD) is one of the few that attempts both, and as of June 2026, the case for examining it closely has sharpened. Several prominent large-cap ASX names, including Commonwealth Bank of Australia, Telstra, Coles, Woolworths, and Wesfarmers, are yielding below that 4% threshold. For income-focused retail investors searching for yield above it with regular cash flow, HYLD’s combination of a monthly distribution schedule and an annualised trailing yield of approximately 4.21% warrants a close look.
This analysis covers what the HYLD ETF is, how its portfolio is constructed, where the yield comes from, the genuine risks that accompany the income, and who this fund actually suits. By the end, readers should have a clear picture of whether it belongs in their portfolio as an income allocation.
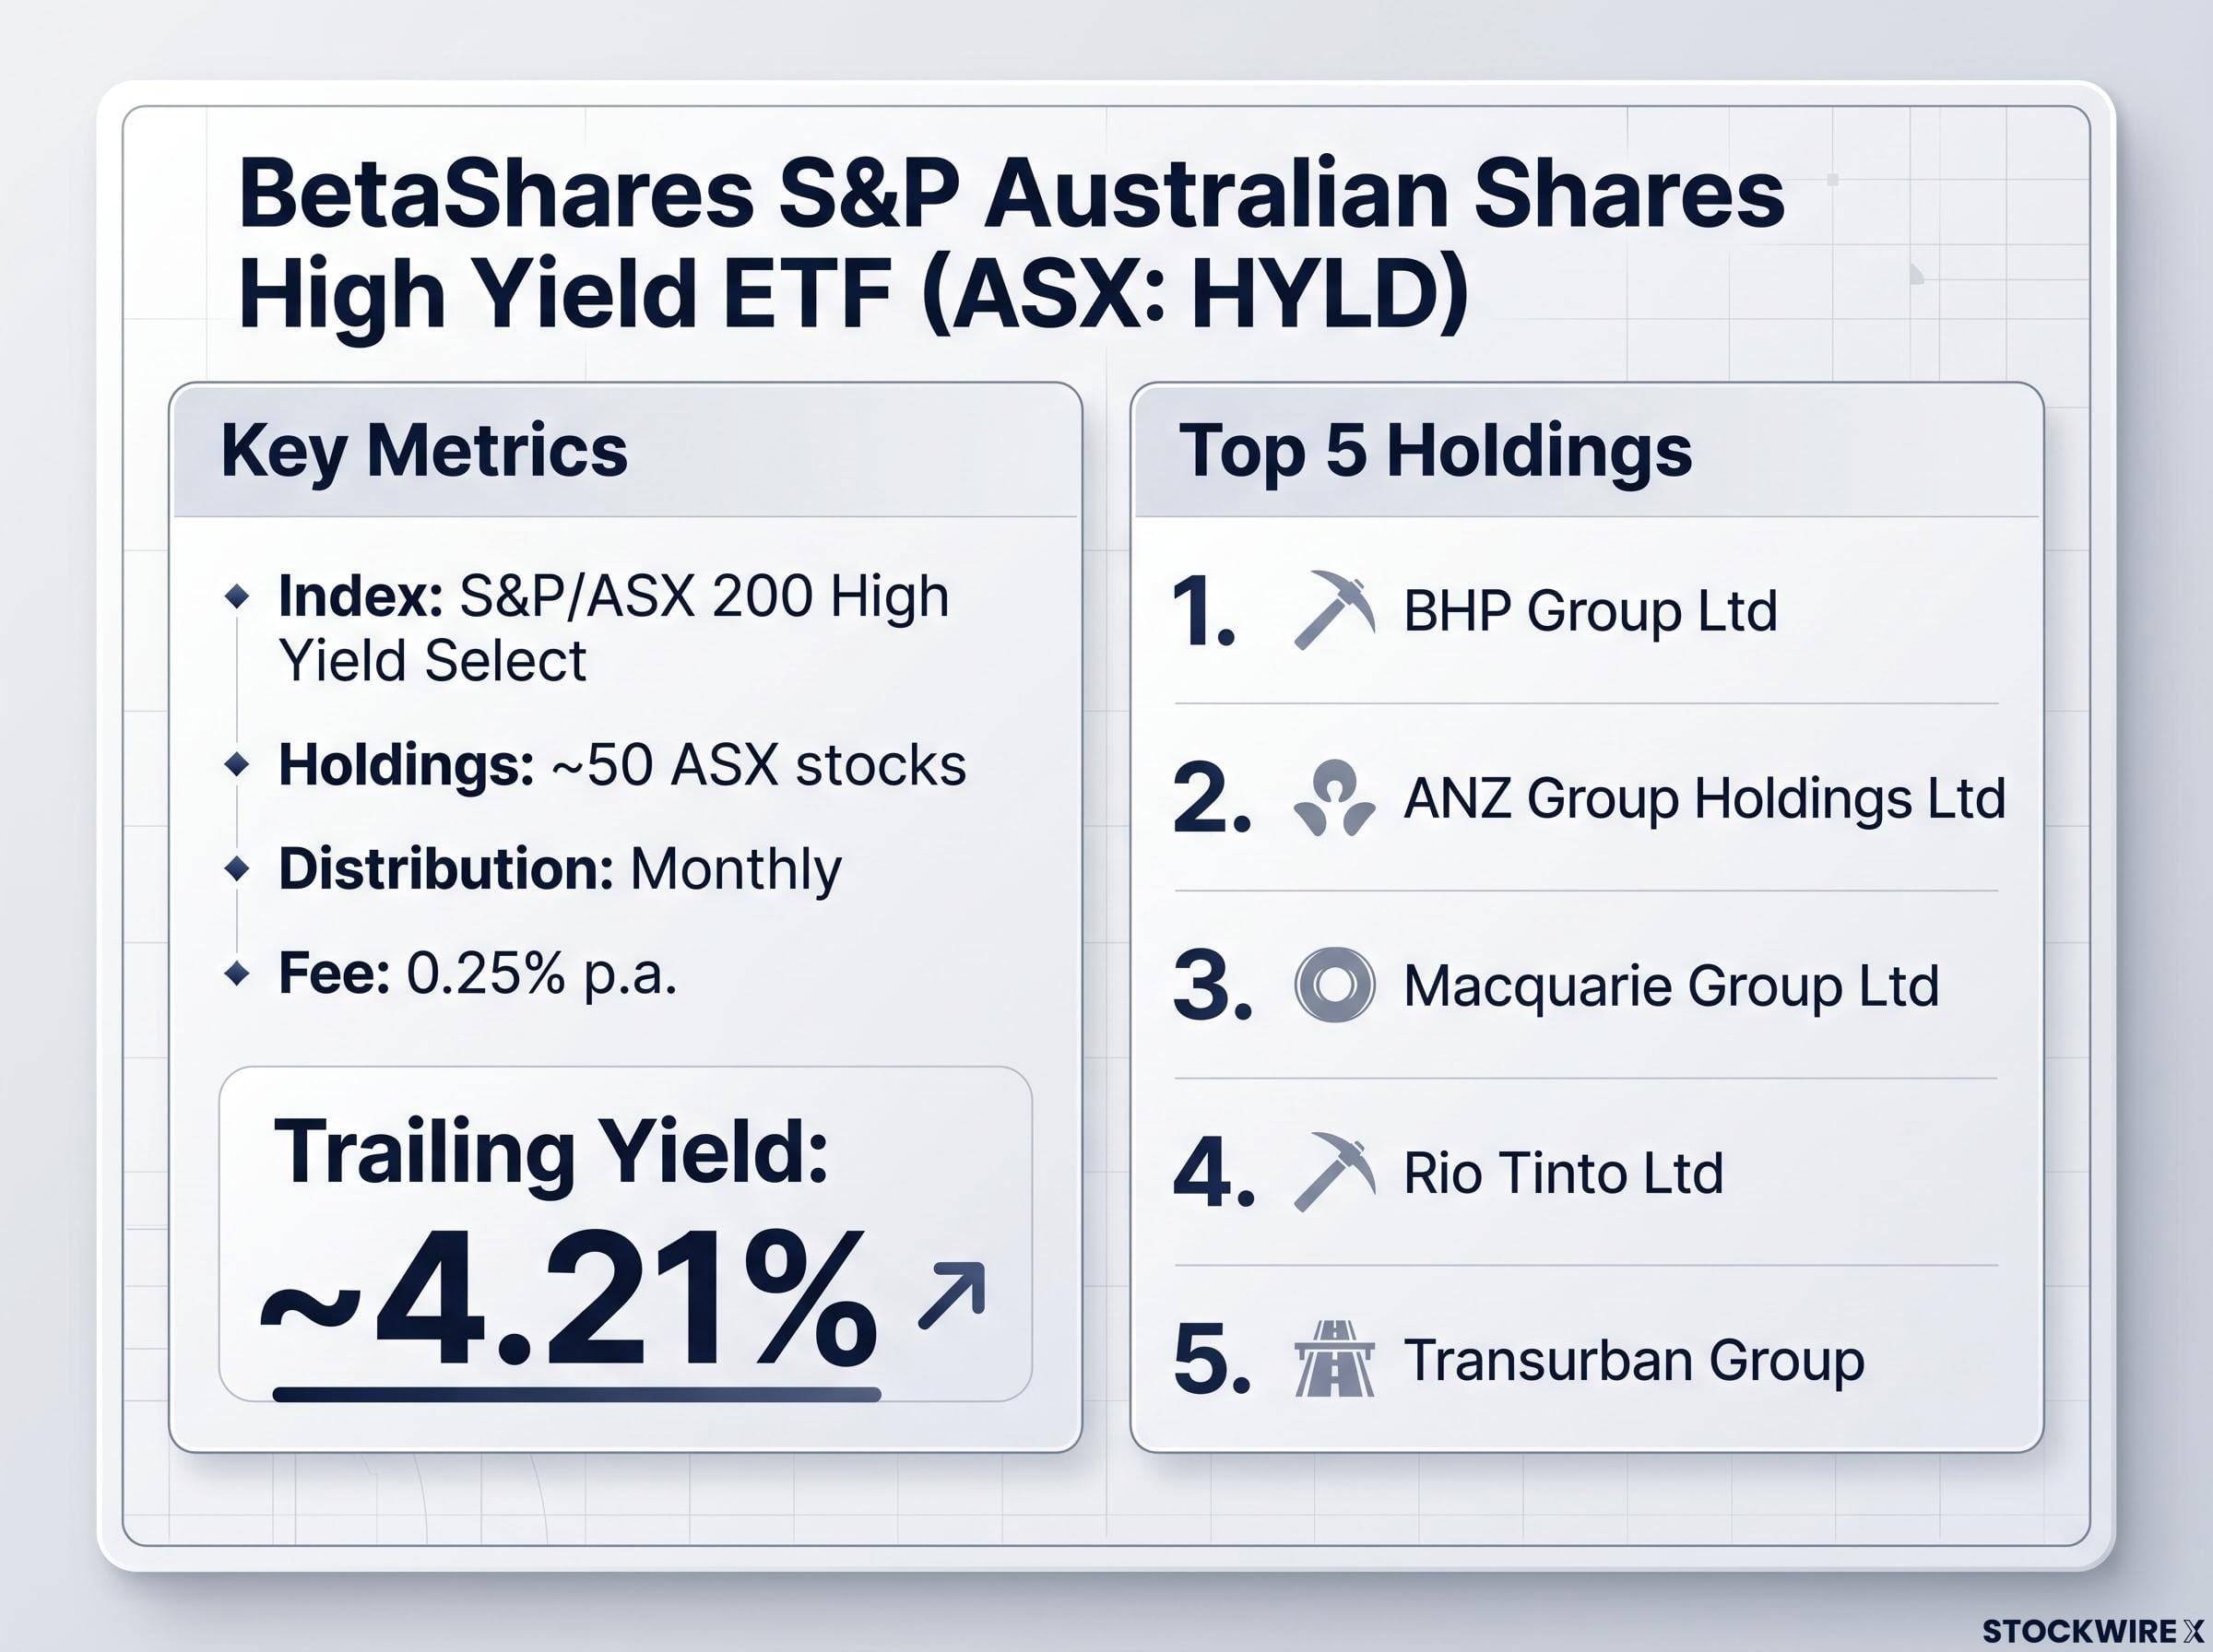
HYLD is a BetaShares exchange-traded fund listed on the ASX that tracks the S&P/ASX 200 High Yield Select Index. It is not a direct share investment and it is not actively managed. It follows a rules-based index methodology designed to select higher-yielding Australian equities from the ASX 200 universe.
The distinction between stocks vs ETFs shapes what an investor actually owns: a direct share position in a single company versus a rules-based claim on a basket of holdings, with different cost, tax, and concentration implications that are easy to overlook when comparing headline yields.
Three characteristics define the product:
The annualised trailing yield stands at approximately 4.21%, based on a conservative per-unit distribution figure of $1.40 annually.
Recent declared monthly distributions came in at 11.7 cents per unit for April, May, and June 2026, preceded by six months of 11.9 cents per unit. With the unit price sitting around $33.61-$33.67 as of mid-June 2026, the fund has paid roughly ten monthly distributions since its listing in approximately August 2025.
The sector weights tell the story before any analysis does. HYLD’s portfolio is deliberately tilted toward the corners of the ASX that have historically paid the highest dividends, and the concentration is immediately visible.
| Sector | Approximate Weight |
|---|---|
| Financials (predominantly banks) | 40.4% |
| Basic Materials | 19.9% |
| Energy | 8.4% |
| Consumer Staples, Utilities, Other | Remaining allocation |
More than two-thirds of the portfolio sits in just three sectors. The yield is not random; it flows directly from the dividend-paying behaviour of Australian banks, large miners, and energy producers.
The five largest individual positions reinforce that picture:
Owning HYLD means owning a concentrated bet on Australian bank dividends and commodity-sector cash flows, packaged as a diversified ETF. That composition is the engine behind the yield, and it is also where the concentration risk lives.
It might seem straightforward to assemble a portfolio of well-known ASX blue chips and collect a yield above 4%. In practice, the numbers tell a different story.
The following widely held large-cap names are all currently yielding below that threshold:
These are among the most popular holdings in Australian retail portfolios. Yet none of them individually clear 4% at current prices. HYLD’s annualised trailing yield of approximately 4.21% sits above the income delivered by each of these names.
Monthly-paying income instruments are especially uncommon on the ASX. Most direct shares pay half-yearly, and many ETFs distribute quarterly, meaning HYLD addresses two gaps simultaneously: yield level and payment frequency.
That combination makes it difficult for income investors to replicate HYLD’s role by simply buying a handful of blue-chip dividend stocks directly.
The broader universe of ASX income ETFs includes approximately 40 products marketed as high-yield vehicles, but most fail a basic minimum-hurdle test once grossed-up yield, AUM scale, holdings count, and capital return history are assessed sequentially, leaving a shortlist that is far shorter than the number of products available suggests.
The yield comes with strings attached, and income-focused investors should understand each one before allocating capital.
Dividend sustainability signals such as payout ratios above 100%, falling coverage ratios, and rising debt loads are the early warning indicators that income-focused investors should monitor across HYLD’s underlying holdings, particularly the bank and resource positions that collectively drive the bulk of the fund’s distribution capacity.
The mixed-sector composition means the overall franking profile is diluted compared with holding major Australian banks directly. Bank dividends are typically fully franked, but resource and energy dividends are often partially franked or unfranked.
The result is a blended franking outcome that shifts depending on the underlying holding composition at any given time. Investors who prioritise maximum franking credit capture may find a direct bank portfolio more tax-efficient than HYLD’s broader income approach. The 0.25% p.a. management fee adds a further, modest drag on net yield that a direct portfolio would avoid.
The analysis points to a specific investor profile and a specific portfolio role. HYLD fits best as an income “satellite” allocation rather than a core broad-market Australian equities holding.
The best Australian dividend ETFs vary considerably in methodology: VHY screens for yield across a broad ASX universe, SYI applies a global quality screen to domestic stocks, and IHD uses a dividend-weighted approach, meaning each produces a materially different sector mix and franking profile compared with HYLD’s high-yield index construction.
Best suited for investors who want:
Less suitable for investors who need:
| Investor Profile | Verdict |
|---|---|
| Income-focused, comfortable with bank/cyclical concentration | Strong fit as an income satellite sleeve |
| Core allocation seeking broad diversification | Weaker fit; sector tilt too narrow for a core role |
| Franking-maximising strategy | Direct bank shares likely more efficient |
| Conservative investors needing a proven multi-year track record | Too early to assess; only one year of live history |
HYLD delivers on its stated purpose. It is a rules-based, low-cost income vehicle that addresses a genuine scarcity of high-yield, monthly-paying options on the ASX. The 4.21% annualised trailing yield sits above what most widely held ASX blue chips offer individually, and the monthly cadence is a structural differentiator that few competitors match.
The trade-off is equally clear. The elevated yield comes with concentrated exposure to banks and cyclical sectors, distributions that will vary with underlying company earnings, and a track record that spans roughly ten monthly payments rather than a full economic cycle. Those are real constraints, not footnotes.
Investors considering an allocation should read the latest Product Disclosure Statement, assess the fund against their own risk tolerance, tax position, and income needs, and treat HYLD as one component of an income strategy rather than the whole of it. The income is real. So are the conditions attached to it.
ASIC’s regulatory framework for exchange traded products requires ETF issuers to hold an Australian Financial Services licence and comply with managed investment scheme obligations, including continuous disclosure and the preparation of a Product Disclosure Statement that investors are encouraged to review before allocating capital.
This article is for informational purposes only and should not be considered financial advice. Investors should conduct their own research and consult with financial professionals before making investment decisions. Past performance does not guarantee future results, and distributions are subject to change based on underlying company earnings and market conditions.
HYLD is a BetaShares exchange-traded fund listed on the ASX that tracks the S&P/ASX 200 High Yield Select Index, holding approximately 50 higher-yielding Australian equities selected through a rules-based methodology.
HYLD pays distributions monthly, which is significantly more frequent than the half-yearly schedule typical of most ASX direct shares and the quarterly schedule of many other ETFs.
HYLD charges a management fee of 0.25% per annum, which represents a minor but real drag on net yield relative to the gross dividends paid by the underlying holdings.
The primary risks are concentration risk (over 40% in financials), distribution variability (payments fluctuate with underlying company earnings and commodity cycles), a diluted franking profile compared to a direct bank portfolio, and a limited track record of roughly one year of live history as at June 2026.
HYLD's annualised trailing yield of approximately 4.21% sits above what widely held names like Commonwealth Bank, Telstra, Coles, Woolworths, and Wesfarmers individually offer, but a direct portfolio of major bank shares would likely deliver higher franking credit capture and avoid the 0.25% management fee.