HYLD ETF: Monthly ASX Income Above 4% With Real Trade-Offs
1 hr ago

Abbott Laboratories borrowed $20 billion in a single bond offering, the largest debt raise in its history, to pay cash for Exact Sciences. For a company that has raised its dividend for 54 consecutive years, that is the kind of number that demands a second look.
The deal closed on 23 March 2026, transforming Abbott’s balance sheet almost overnight. The dividend itself is still being paid. The yield has drifted toward 3% as the stock has softened, and management has not signalled any intent to cut. But the financial architecture around that dividend has changed materially, and income investors who rely on Abbott as a steady compounder need to understand what shifted and what it means for their position.
This analysis walks through the acquisition’s precise balance sheet impact, evaluates what the dividend signals actually show, introduces the debt paydown yield concept that most retail investors overlook, and closes with a concrete monitoring framework for deciding whether Abbott still earns a place in an income portfolio.
This article is for informational purposes only and should not be considered financial advice. Investors should conduct their own research and consult with financial professionals before making investment decisions.
The numbers arrived fast. Abbott agreed on 20 November 2025 to acquire Exact Sciences for $105 per share in cash, implying an equity value of roughly $21 billion and an enterprise value near $23 billion once approximately $1.8 billion of Exact Sciences’ net debt was included. The transaction closed on 23 March 2026.
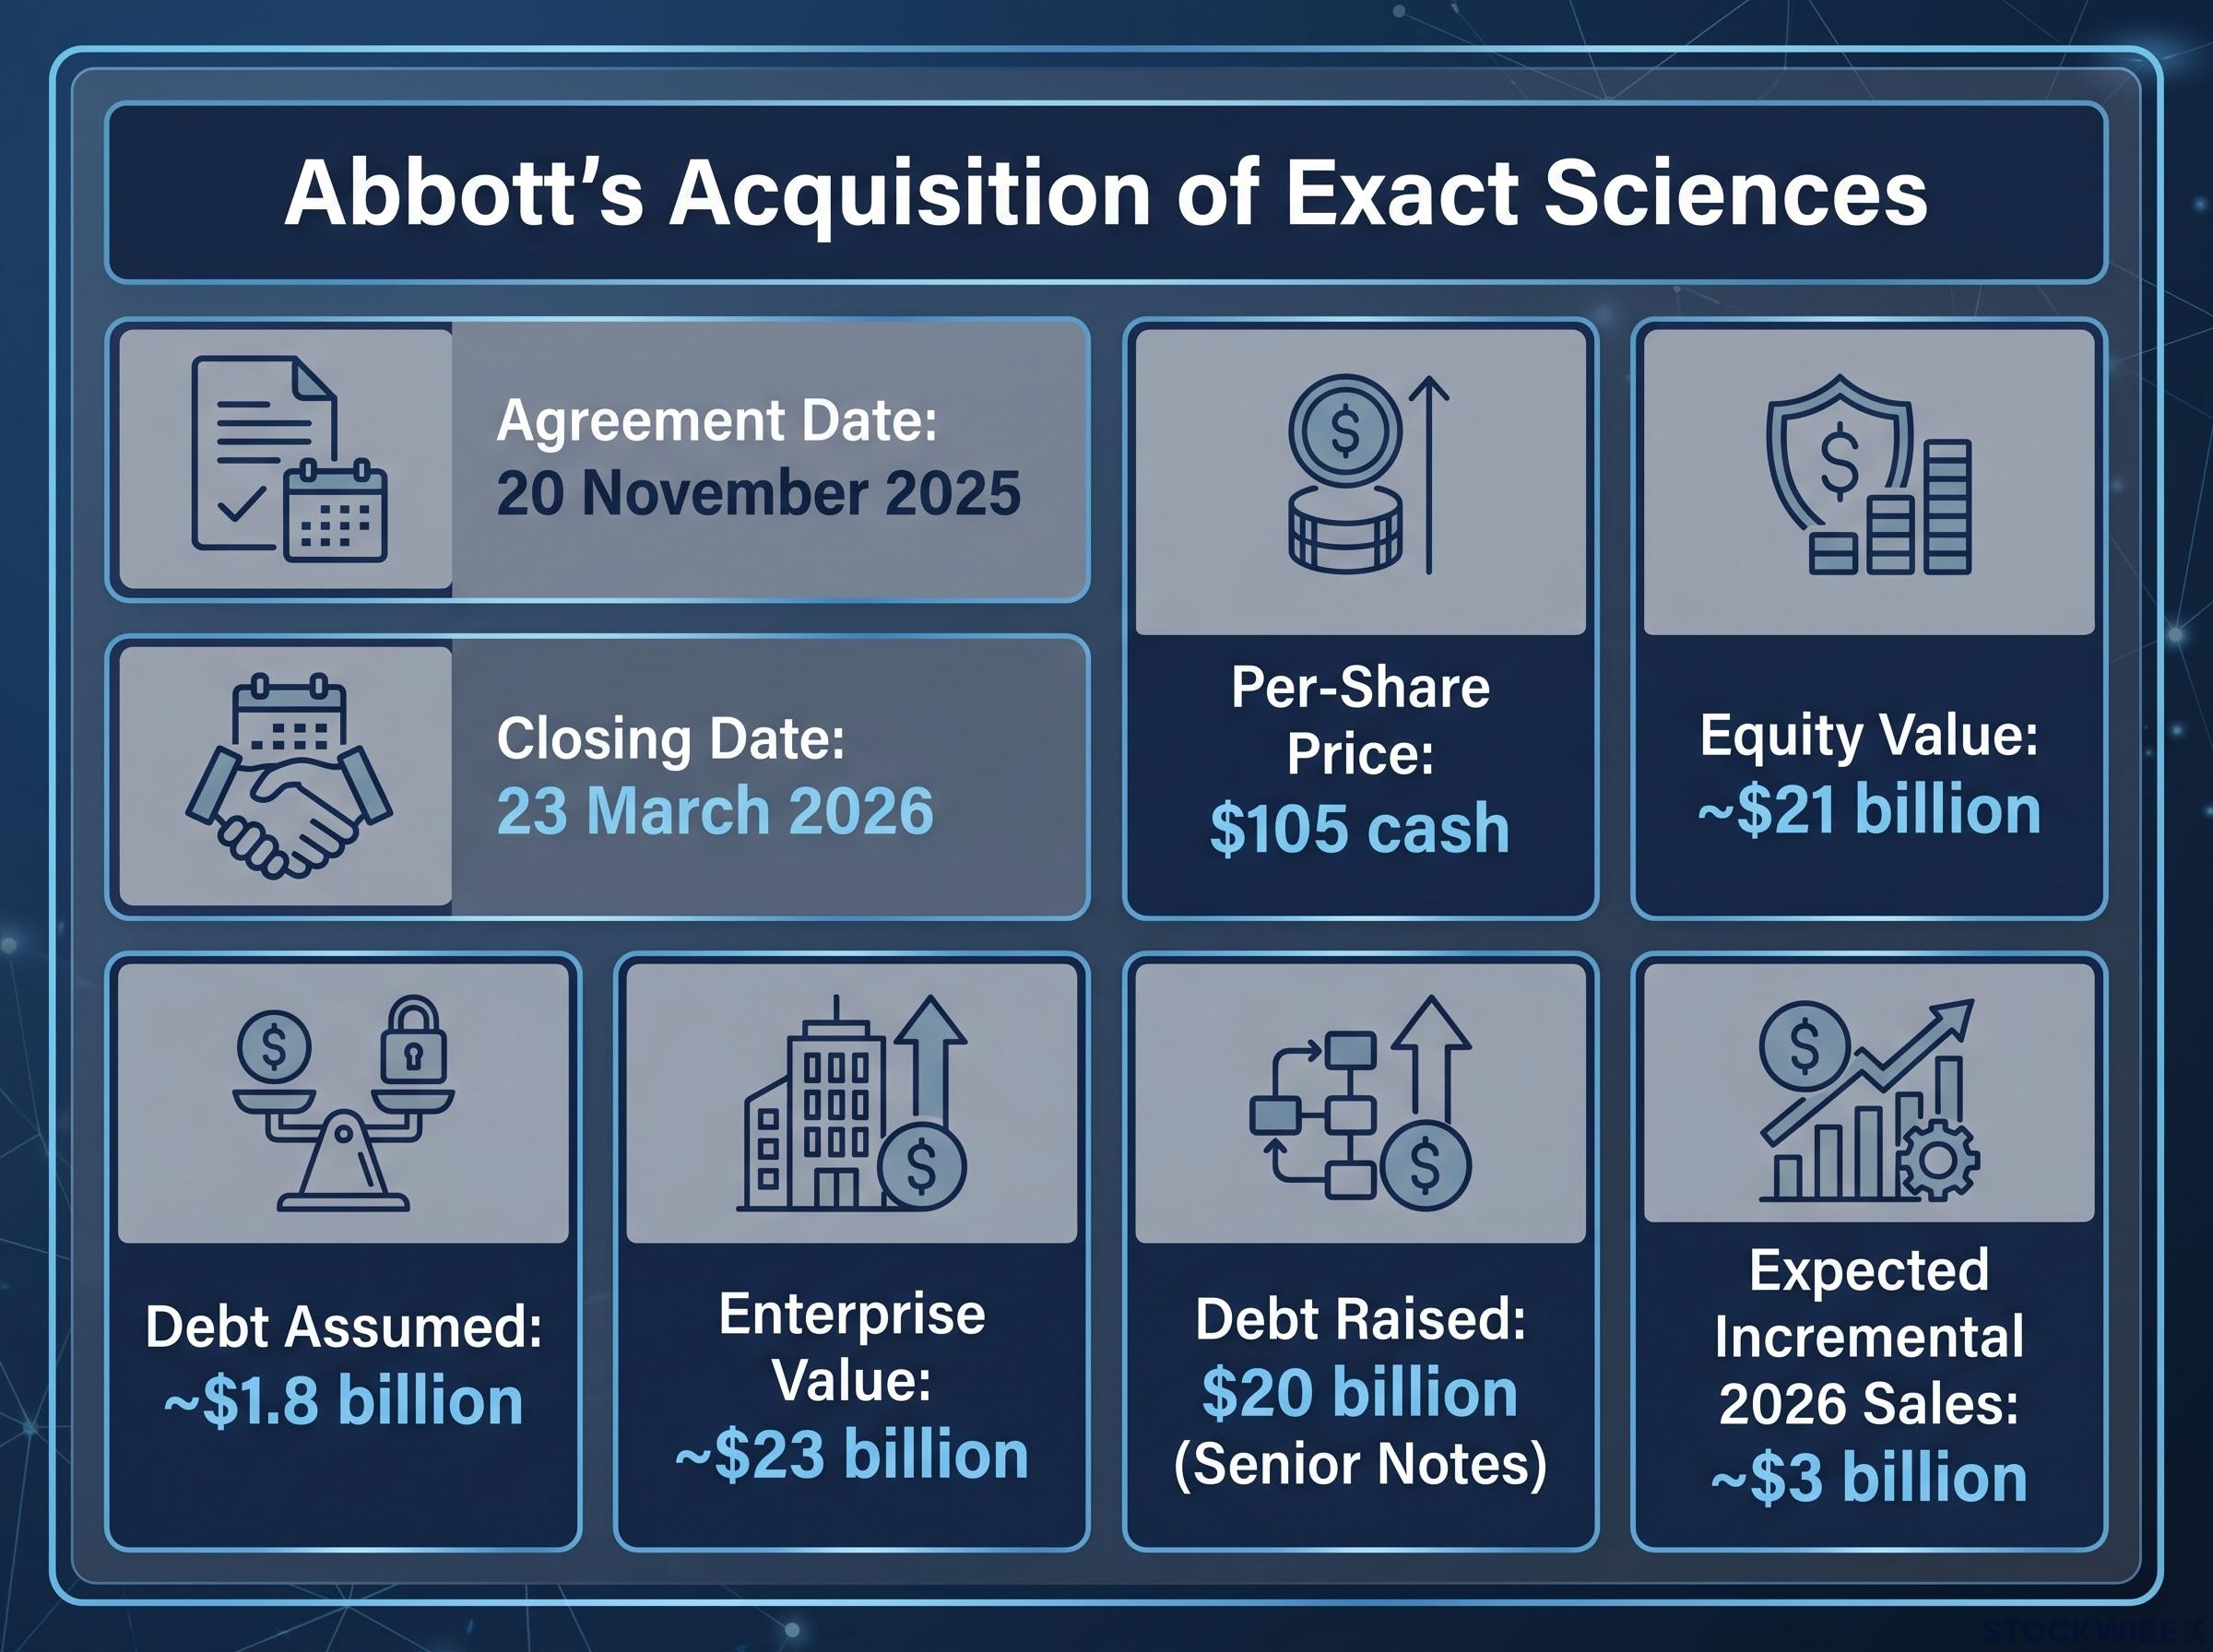
To fund the purchase, Abbott completed a $20 billion public offering of senior notes in March 2026, with net proceeds directed primarily toward the acquisition consideration alongside existing cash on hand. Abbott also assumed the $1.8 billion in net debt already sitting on Exact Sciences’ books.
| Metric | Detail |
|---|---|
| Per-share cash consideration | $105 |
| Equity value | Approximately $21 billion |
| Enterprise value (including assumed debt) | Approximately $23 billion |
| New senior notes issued (March 2026) | Approximately $20 billion |
| Exact Sciences net debt assumed | Approximately $1.8 billion |
| Expected incremental 2026 sales | Approximately $3 billion |
The result is a structurally more leveraged company. Debt now meaningfully exceeds available cash, and more of Abbott’s future cash flows are contractually committed to bondholders before anything reaches shareholders.
Management has publicly targeted a post-deal gross debt-to-EBITDA ratio of approximately 2.7x, and has stated its intention to maintain investment-grade credit status while managing toward lower leverage ratios over time.
On paper, Abbott’s income profile remains one of the strongest in American equities. The facts are straightforward:
The Dividend King classification requires 50 consecutive years of unbroken payout increases with no index-membership constraint, making it a structurally more demanding threshold than the Dividend Aristocrat designation, which requires S&P 500 membership and 25 years; as of mid-2026, only 56 to 58 companies hold King status globally.
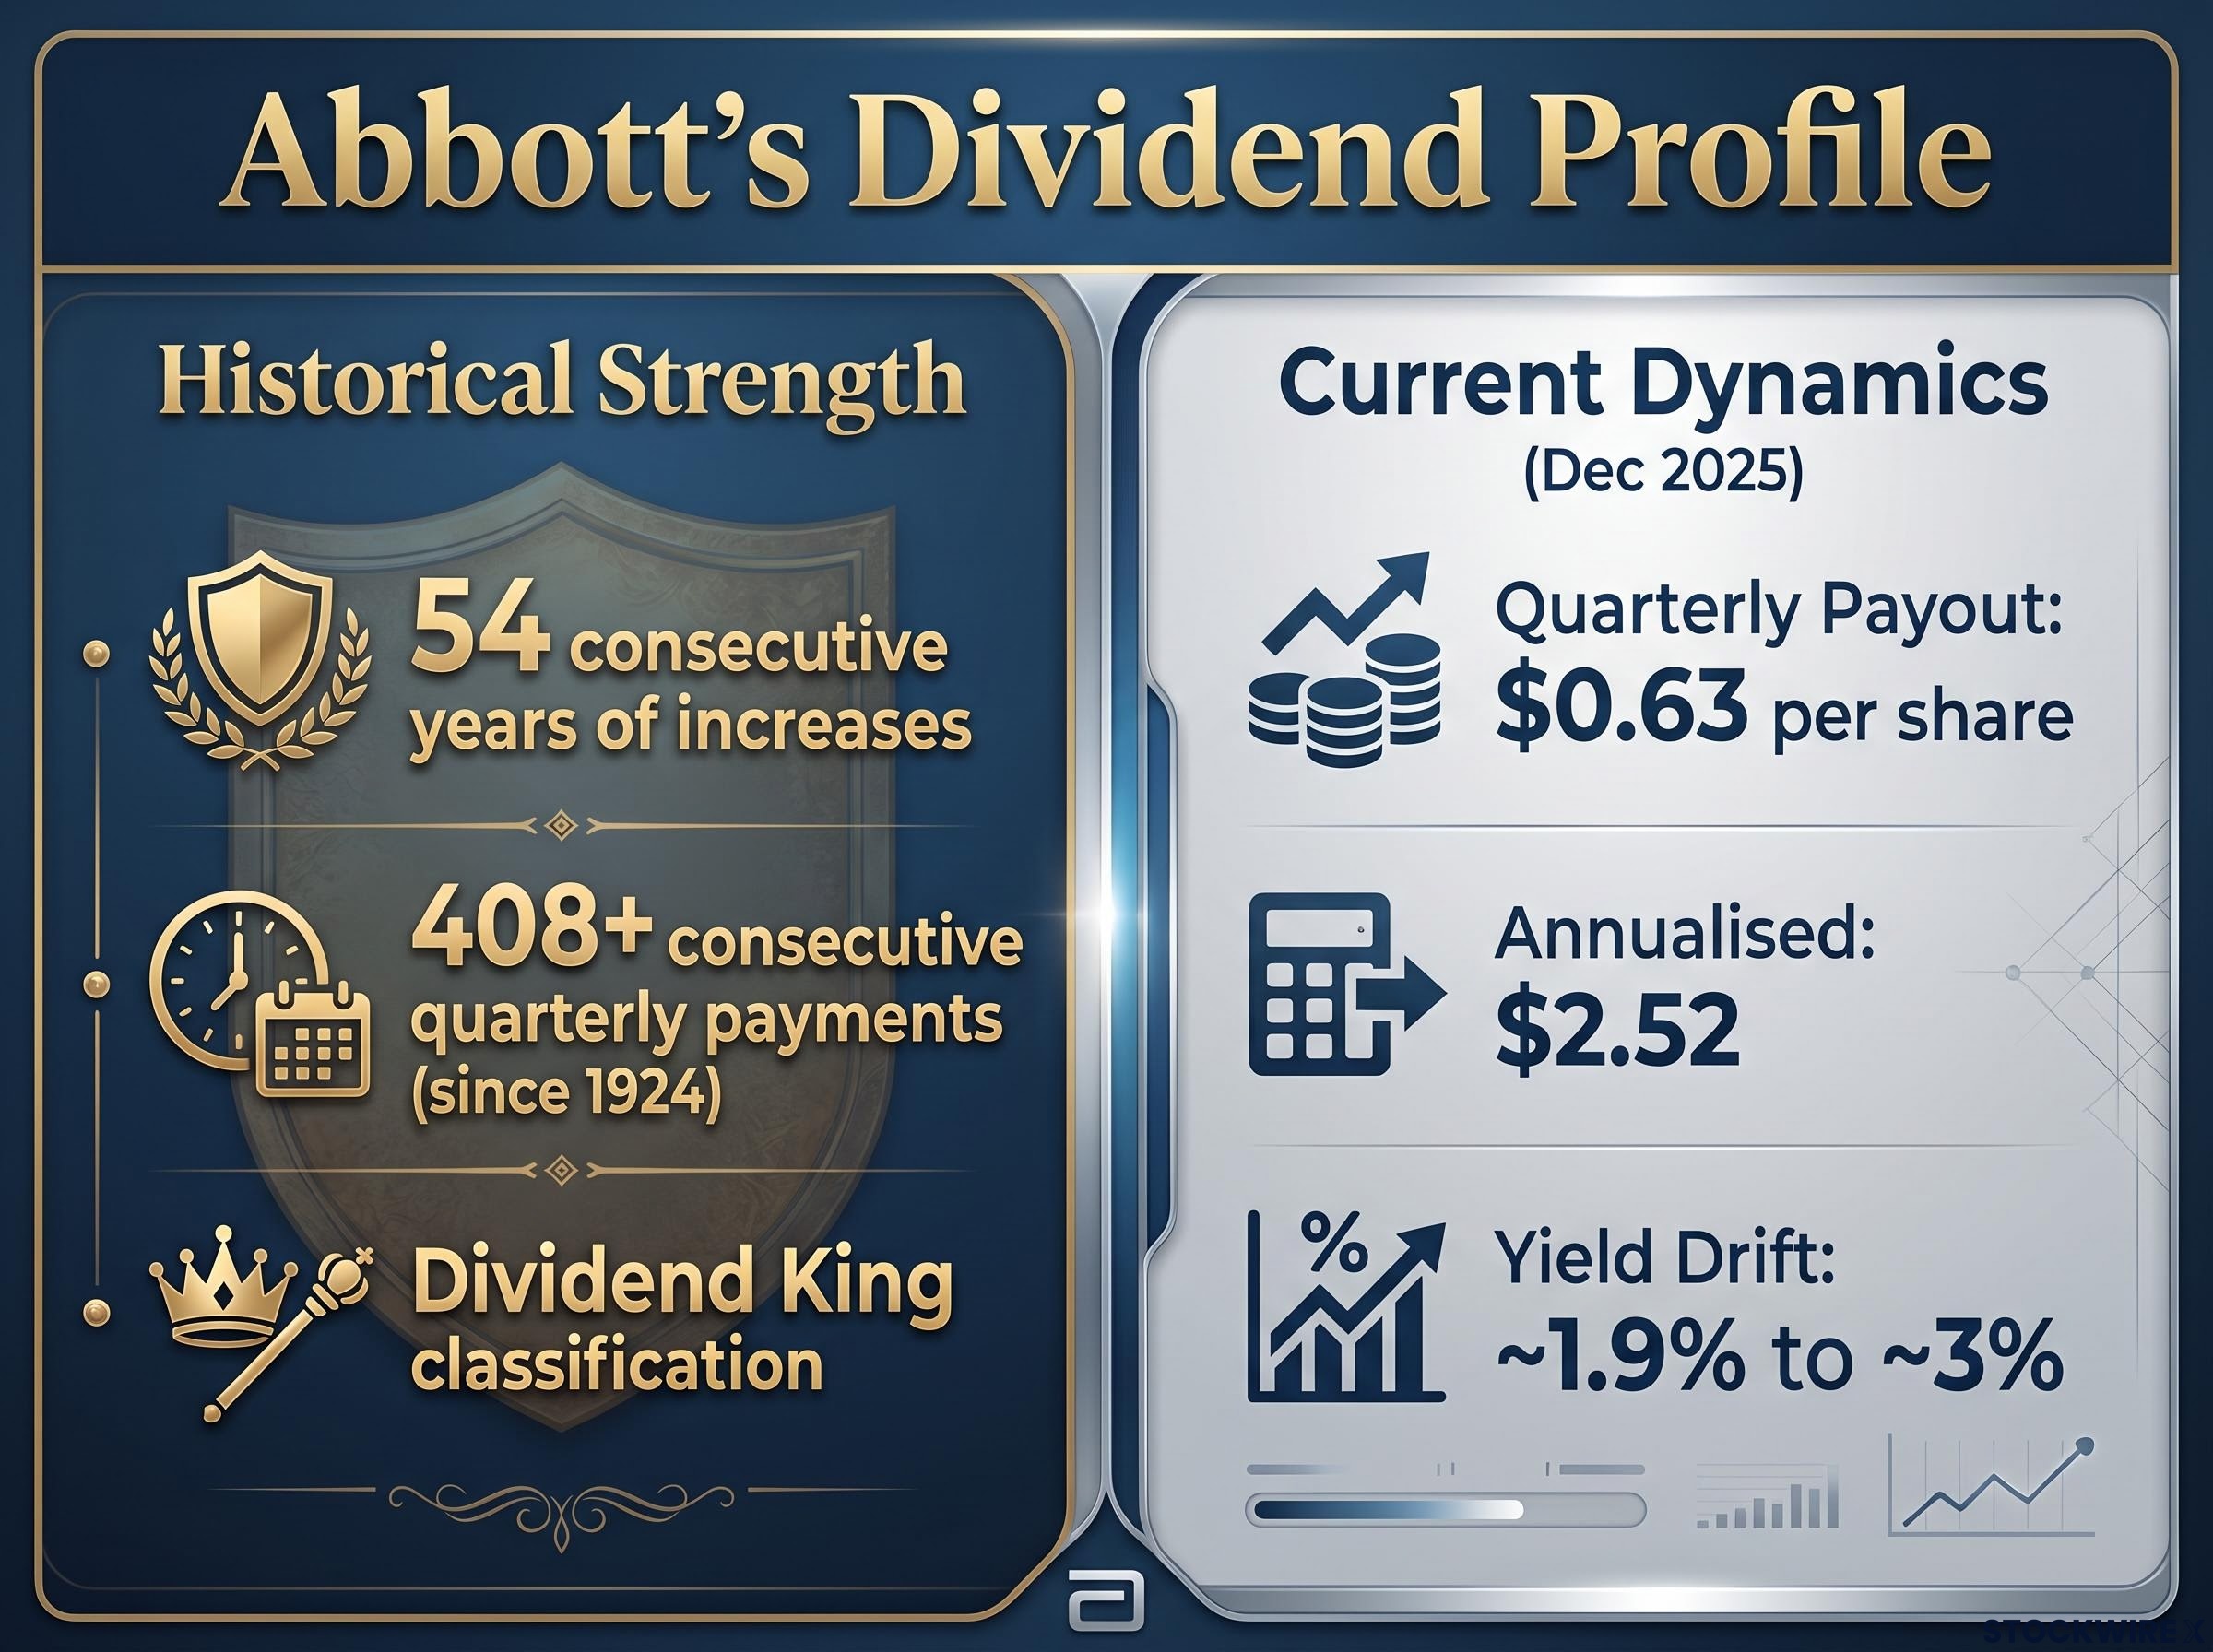
The board raised the quarterly dividend to $0.63 per share (annualised $2.52) in December 2025. At the share price prevailing at the time of that announcement, the yield sat at approximately 1.9%.
That yield has since moved closer to 3%. The question is why.
A rising yield can reflect two very different dynamics. It can signal dividend growth outpacing the share price, which is genuinely positive for income investors. Or it can signal a falling share price dragging the yield higher, which may reflect market concern rather than improved income value.
Abbott’s move from 1.9% to approximately 3% falls into the second category. The payout itself increased modestly. The stock softened. That distinction matters, because a yield approaching 3% from a Dividend King looks compelling at first glance but carries a different risk profile when it arrives via price weakness rather than accelerating distributions.
The stock’s forward price-to-earnings ratio now sits near the lower boundary of its five-year historical range. That is potentially attractive, but it must be weighed against the structurally changed leverage profile the deal has introduced.
Most retail dividend analysis stops at the headline yield. A more complete framework exists, and Abbott’s situation is the clearest possible illustration of why it matters.
Total shareholder yield = dividend yield + buyback yield + debt paydown yield
Total shareholder yield, the sum of dividend yield, buyback yield, and debt paydown yield, is the framework that makes Abbott’s real income picture visible: a headline dividend yield of 2-3% paired with a substantially negative debt paydown component from the $20 billion senior notes offering produces a composite return meaningfully below what most screens surface.
Debt paydown yield is the component most income investors never consider. It captures the value that flows to equity holders when a company uses free cash flow to reduce its net debt. Lower debt means lower future interest expense, reduced financial risk, and a stronger claim on residual cash flows for shareholders. The benefit is real even though it does not appear as cash in a brokerage account.
Abbott’s current situation is the inverse:
By issuing $20 billion in new debt rather than retiring obligations, Abbott has generated a strongly negative debt paydown yield that partially offsets the headline dividend yield. A 2-3% dividend yield paired with a substantially negative debt paydown yield produces a total shareholder yield meaningfully lower than the number most income investors are looking at. Until Abbott makes visible progress on deleveraging, the raw yield overstates the attractiveness of the total return case.
Past performance does not guarantee future results. Financial projections are subject to market conditions and various risk factors.
The reassuring headline comes first. Abbott’s free cash flow remains positive and sufficient to cover the dividend at current payout levels. In Q1 2026, free cash flow came in at approximately $916 million after capital expenditures, providing a concrete near-term reference point.
The coverage holds. The question is where it tightens.
| Metric | Prior 2026 Guidance | Updated 2026 Guidance |
|---|---|---|
| Adjusted diluted EPS | $5.55-$5.80 | $5.38-$5.58 |
| Midpoint EPS | $5.68 | $5.48 |
| EPS dilution from acquisition | N/A | Approximately $0.20 |
| Annualised dividend per share | $2.52 | $2.52 |
Management has already trimmed its 2026 profit forecast, citing the acquisition’s impact on earnings even as top-line sales remain strong. The approximately $0.20 of EPS dilution compresses the margin between what Abbott earns and what it pays out. The dividend is covered; the buffer is thinner.
The deal is expected to become EPS accretive in 2028 and beyond, with management targeting at least $100 million in annual pre-tax synergies by that year. That creates a roughly two-year window in which dividend growth is likely to be more conservative and balance sheet repair will compete with shareholder returns for available free cash flow.
Management has maintained investment-grade credit status and has publicly committed to managing toward lower leverage ratios, providing a baseline of credibility for the deleveraging narrative. The constraint is not whether Abbott can pay its dividend; it is how aggressively it can grow that dividend while simultaneously servicing $20 billion in new debt.
These forward-looking statements regarding EPS accretion and synergy targets are subject to change based on market developments and company performance.
Abbott’s new profile warrants active monitoring rather than passive holding. The following four checkpoints, trackable on each quarterly earnings call, provide a concrete framework:
The original source analysis rated Abbott’s financial statement strength at 2/3, 3/3, and 2/3 across three evaluated categories, classifying the overall financial profile as “fair.”
Given elevated leverage, Abbott is better suited as a modest weighting in an income portfolio rather than a core anchor position until deleveraging is clearly underway. The forward P/E near the lower boundary of its five-year historical range suggests relative value, but that potential upside is conditional on management executing the deleveraging roadmap.
The Abbott case carries a broader lesson that applies the next time any Dividend King announces a major leveraged deal.
The safe-haven narrative that dividend stocks provide relative protection during broad market pullbacks carried empirical weight for decades, but early 2026 data complicates the picture: the MSCI World High-Dividend Yield Index fell approximately 7.6% peak to trough while the broader index fell 8.9% and subsequently recovered to all-time highs faster, leaving high-dividend holders behind.
The dividend is likely to remain intact. Growth is likely to be more conservative for approximately two years while integration and deleveraging compete for free cash flow. Balance sheet risk is real but not existential, given Abbott’s diversified revenue base across medical devices, diagnostics, established pharmaceuticals, and nutrition.
The original source analysis noted this as a stock worth researching in advance of a potential price pullback, a reasonable posture given the need to monitor deleveraging progress before committing meaningful capital. Position sizing and monitoring cadence are the two adjustable variables that allow Abbott to remain a reasonable holding without requiring certainty about the outcome.
For income investors who want to stress-test how a position like Abbott fits within a broader income plan, our dedicated guide to dividend portfolio modeling walks through weighted average yield and dividend growth rate calculations with worked examples, including how a two-year period of conservative dividend growth from a core holding affects the trajectory toward a specific retirement income target.
Exact Sciences adds long-term strategic value in oncology diagnostics, but the $20 billion debt raise has compressed the financial flexibility that made Abbott’s dividend feel almost unconditional. The safety buffer is thinner, and the total shareholder yield is lower than the headline number suggests.
The framework for income investors comes down to two variables: right-size the position and commit to monitoring the deleveraging metrics, rather than treating Abbott as a passive compounder for the next 24 months. If management delivers on the 2028 EPS accretion timeline and visibly reduces leverage over the next several quarters, the current valuation near the lower boundary of Abbott’s five-year forward P/E range could represent a compelling entry point for patient income investors. The dividend streak is real. The question is whether the balance sheet behind it earns the same confidence it did six months ago.
The dividend remains intact and covered by free cash flow, which came in at approximately $916 million in Q1 2026, but the buffer is thinner than before because $20 billion in new debt has increased interest obligations and compressed earnings guidance by roughly $0.20 per share in 2026.
Total shareholder yield combines dividend yield, buyback yield, and debt paydown yield into a single return metric; for Abbott, the $20 billion senior notes offering generates a substantially negative debt paydown component that reduces the composite return well below the headline 2-3% dividend yield most screens display.
A Dividend King is a company that has raised its dividend for at least 50 consecutive years, and Abbott still qualifies with 54 consecutive years of increases and over 400 consecutive quarterly payments dating back to 1924.
Management has guided for the acquisition to become EPS accretive in 2028 and beyond, with at least $100 million in annual pre-tax synergies targeted by that year, creating roughly a two-year window of more conservative dividend growth and active deleveraging.
Investors should track four key checkpoints each quarter: the net debt-to-EBITDA trajectory toward the 2.7x post-deal target, free cash flow coverage of the $2.52 annualised dividend, EPS guidance revisions reflecting integration progress, and any changes to Abbott's investment-grade credit rating.