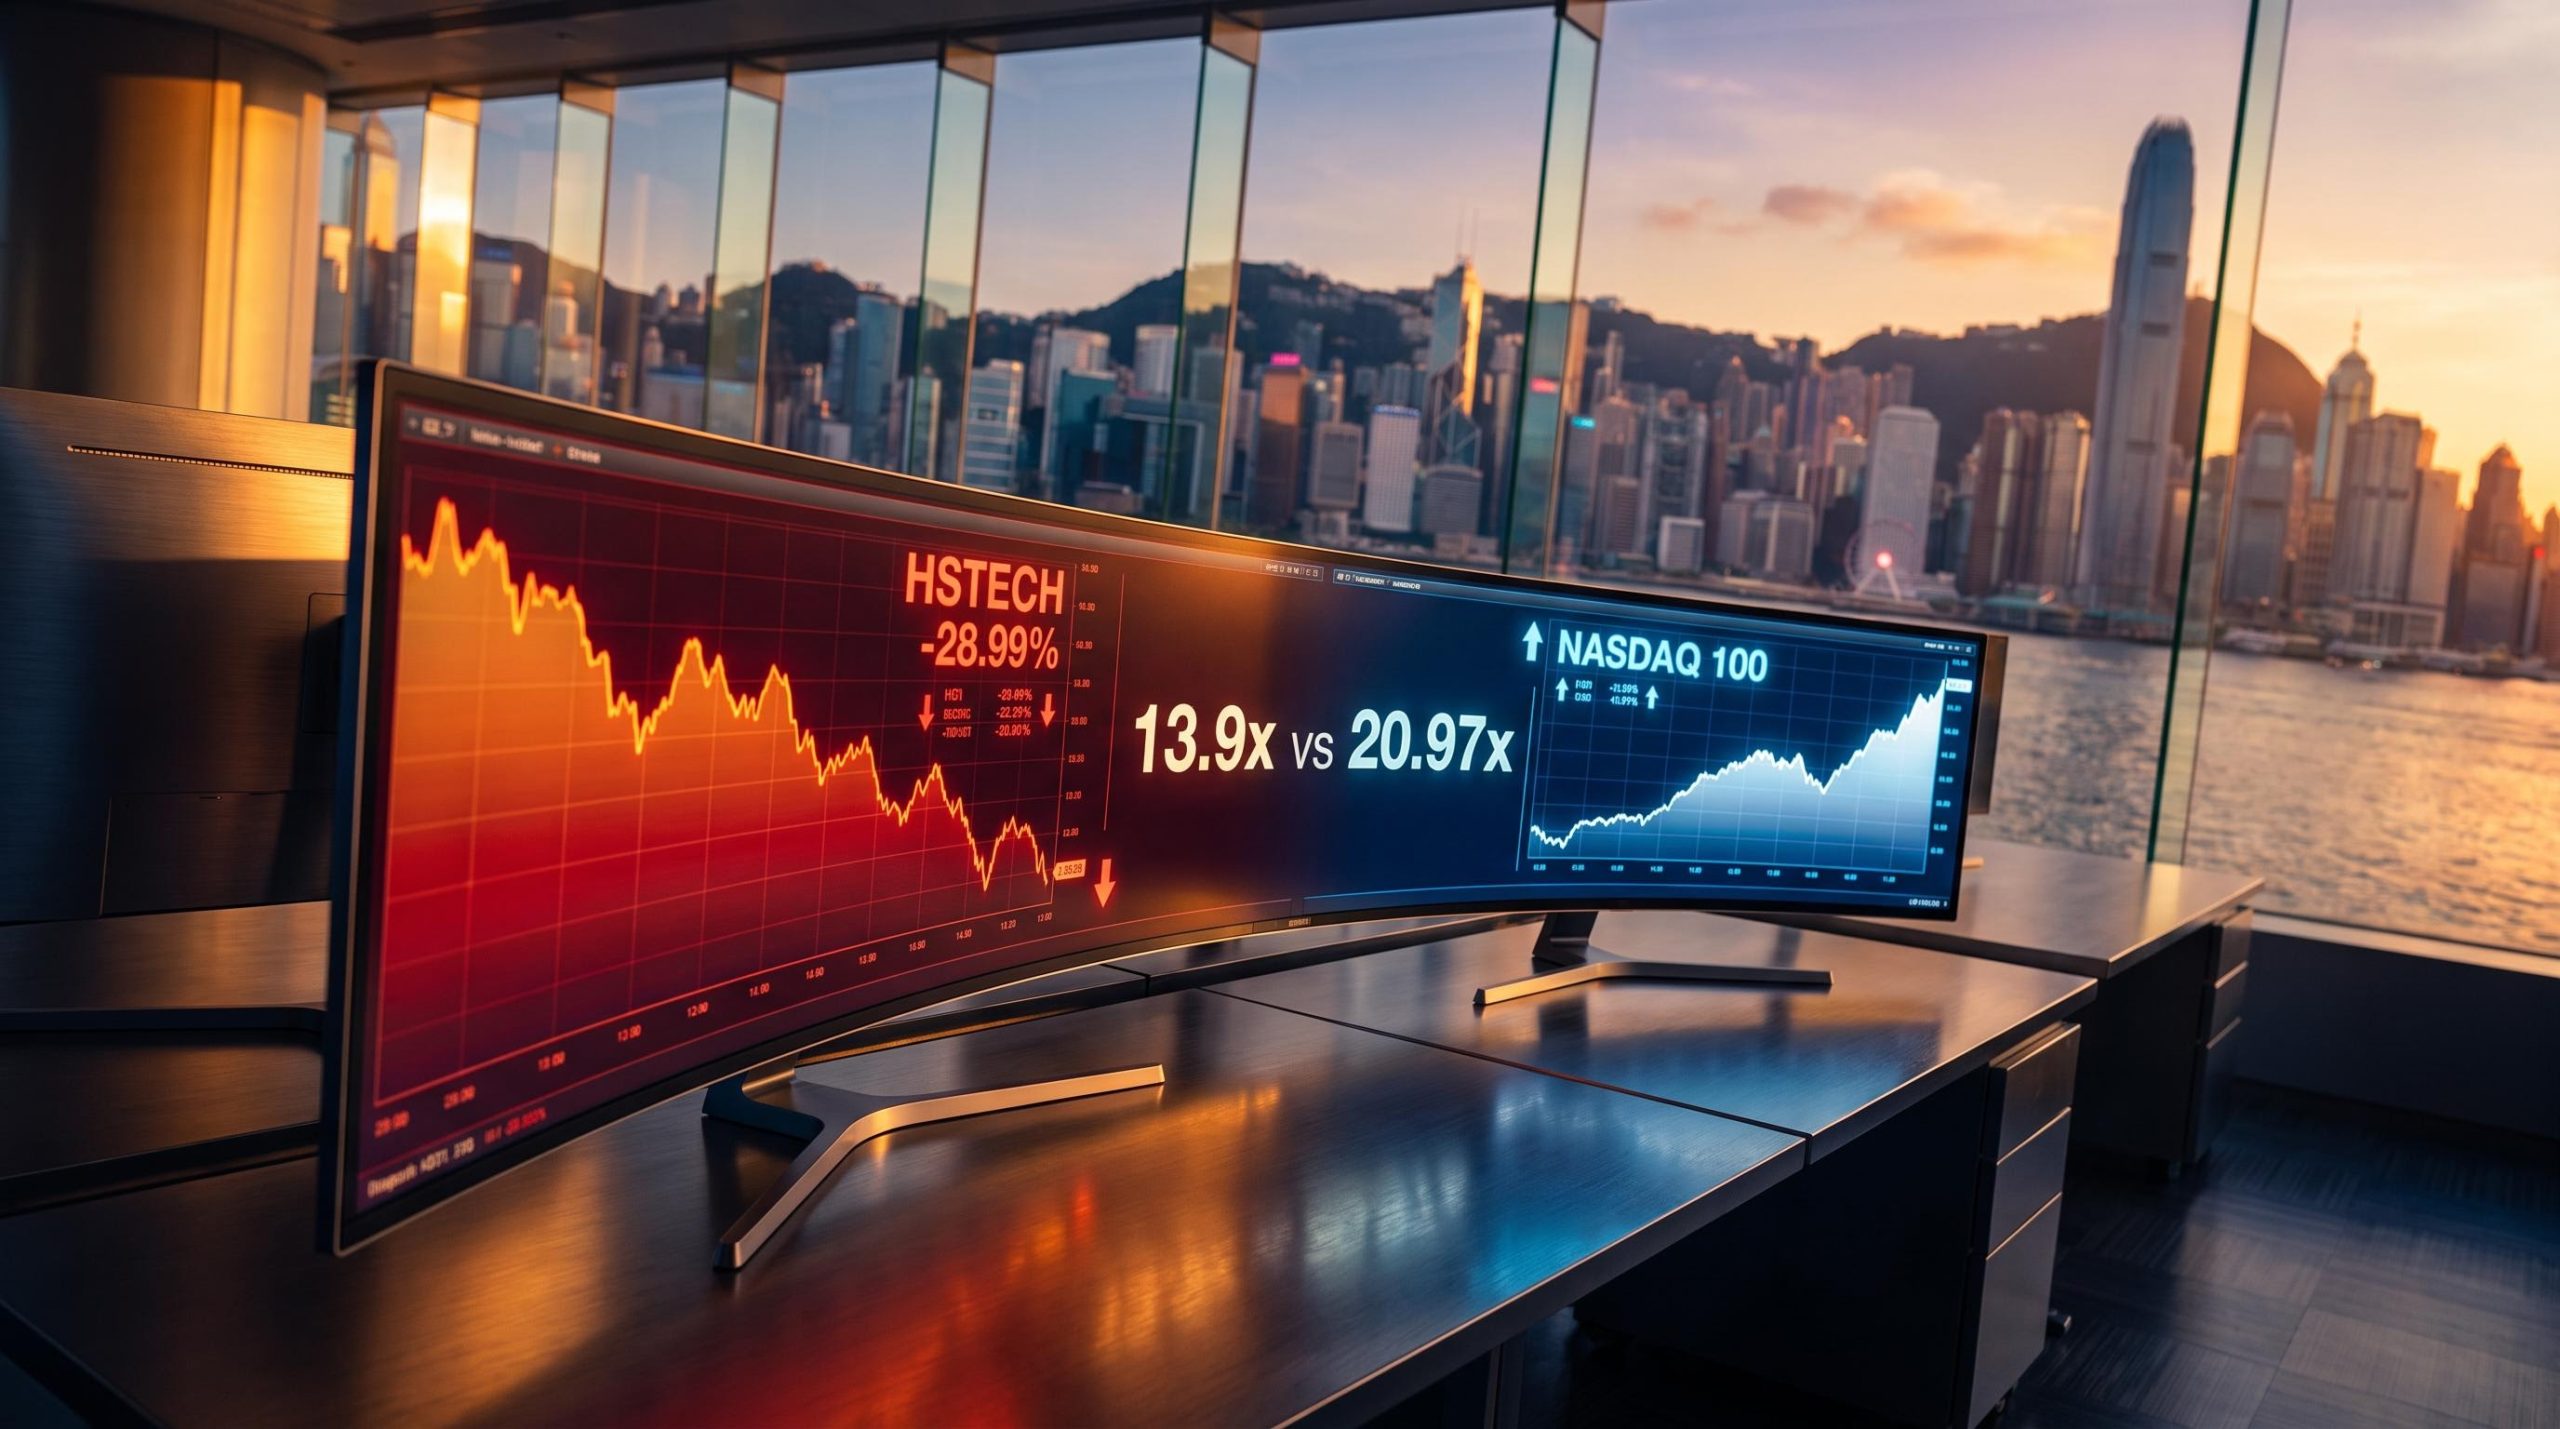
The Hang Seng Tech Index trades at a forward earnings multiple that sits at roughly half the level of the NASDAQ 100, and both indices are supposed to give you exposure to the same broad thing: high-growth technology. If you hold US tech and have watched your allocation quietly balloon on price appreciation alone, that gap is worth sitting with for a moment.
The divergence is not subtle. The Hang Seng Tech Index (HSTECH) has fallen roughly 30% over the past year, while the NASDAQ 100 has kept compounding. Yet the two indices were trading at broadly comparable levels of around 11,000 points back in 2021 before their paths split apart.
That split is the entire argument. This piece works through whether the discount is genuine mispricing worth acting on, or a risk premium that belongs exactly where it is. By the time you finish, you will have a specific framework for deciding which of those two things it actually is for your portfolio.
How wide is the valuation gap, and what is driving it?
Start with the headline: on a forward earnings basis, HSTECH trades at a meaningful discount to the NASDAQ 100. Sources disagree on the precise multiples, so the honest read is a range rather than a false single number.
For HSTECH, forward P/E has been cited at 13.9x in June 2026 and around 20x in January 2026, with a trailing P/E near 30.78x in late August 2026. The NASDAQ 100, by comparison, carried a blended forward P/E of roughly 20.97x in September 2026, with trailing multiples reported anywhere from 27.5x to 35.24x (the higher trailing figures flagged as unverified).
The gap is real even at the conservative end of those ranges. What it tells you is that the market is pricing persistent risk into HSTECH, not merely a passing bout of poor sentiment, and you need to decide whether you agree with that assessment before you rotate a single dollar.
| Metric | HSTECH | NASDAQ 100 |
|---|---|---|
| Forward P/E (range) | ~13.9x to ~20x | ~20.97x (blended) |
| Trailing P/E | ~30.78x | 27.5x to 35.24x* |
| Dividend yield | Exceeds 1% | ~0.56% |
| 1-year return | -28.99% | Positive compounding |
| Constituents | 30 | 100 |
*Higher trailing figures flagged as unverified across sources.
There is a secondary point buried in that table. HSTECH offers a dividend yield exceeding 1%, roughly double the NASDAQ 100’s 0.56%, which adds a modest income cushion to the valuation case.
The current drawdown also has to be read against a genuinely strong recent year.
Context: HSTECH in 2025 The index rose 23.5% over calendar 2025 to close at 5,516 points, finishing the year on a P/E of 24.9x. By mid-September 2026 it stood near 4,291 points with a year-to-date return of -22.20%. The re-rating happened, then reversed.
Composition differences that widen the multiple gap
The structural driver of the gap sits in what each index actually holds. HSTECH carries only 30 constituents against the NASDAQ 100’s 100, and its weighting leans heavily toward consumer internet platforms rather than the AI infrastructure and semiconductor names dominating US benchmarks.
That composition matters because the current market re-rating has concentrated in AI capex beneficiaries. In the NASDAQ 100, semiconductor and hyperscaler exposure carries disproportionate index weight, which lifts the blended multiple. HSTECH’s lower direct exposure to that theme structurally depresses its multiple, meaning part of the discount is not sentiment at all. It is a reflection of what the index is built from.
AI infrastructure stocks positioned at the buildout’s binding constraints, including power availability and cooling density, have commanded the re-rating that HSTECH’s consumer internet-heavy composition has largely missed, which is a key reason the multiple gap between the two indices reflects composition as much as it reflects sentiment.
When big ASX news breaks, our subscribers know first
Lenovo as a case study in cross-market valuation arbitrage
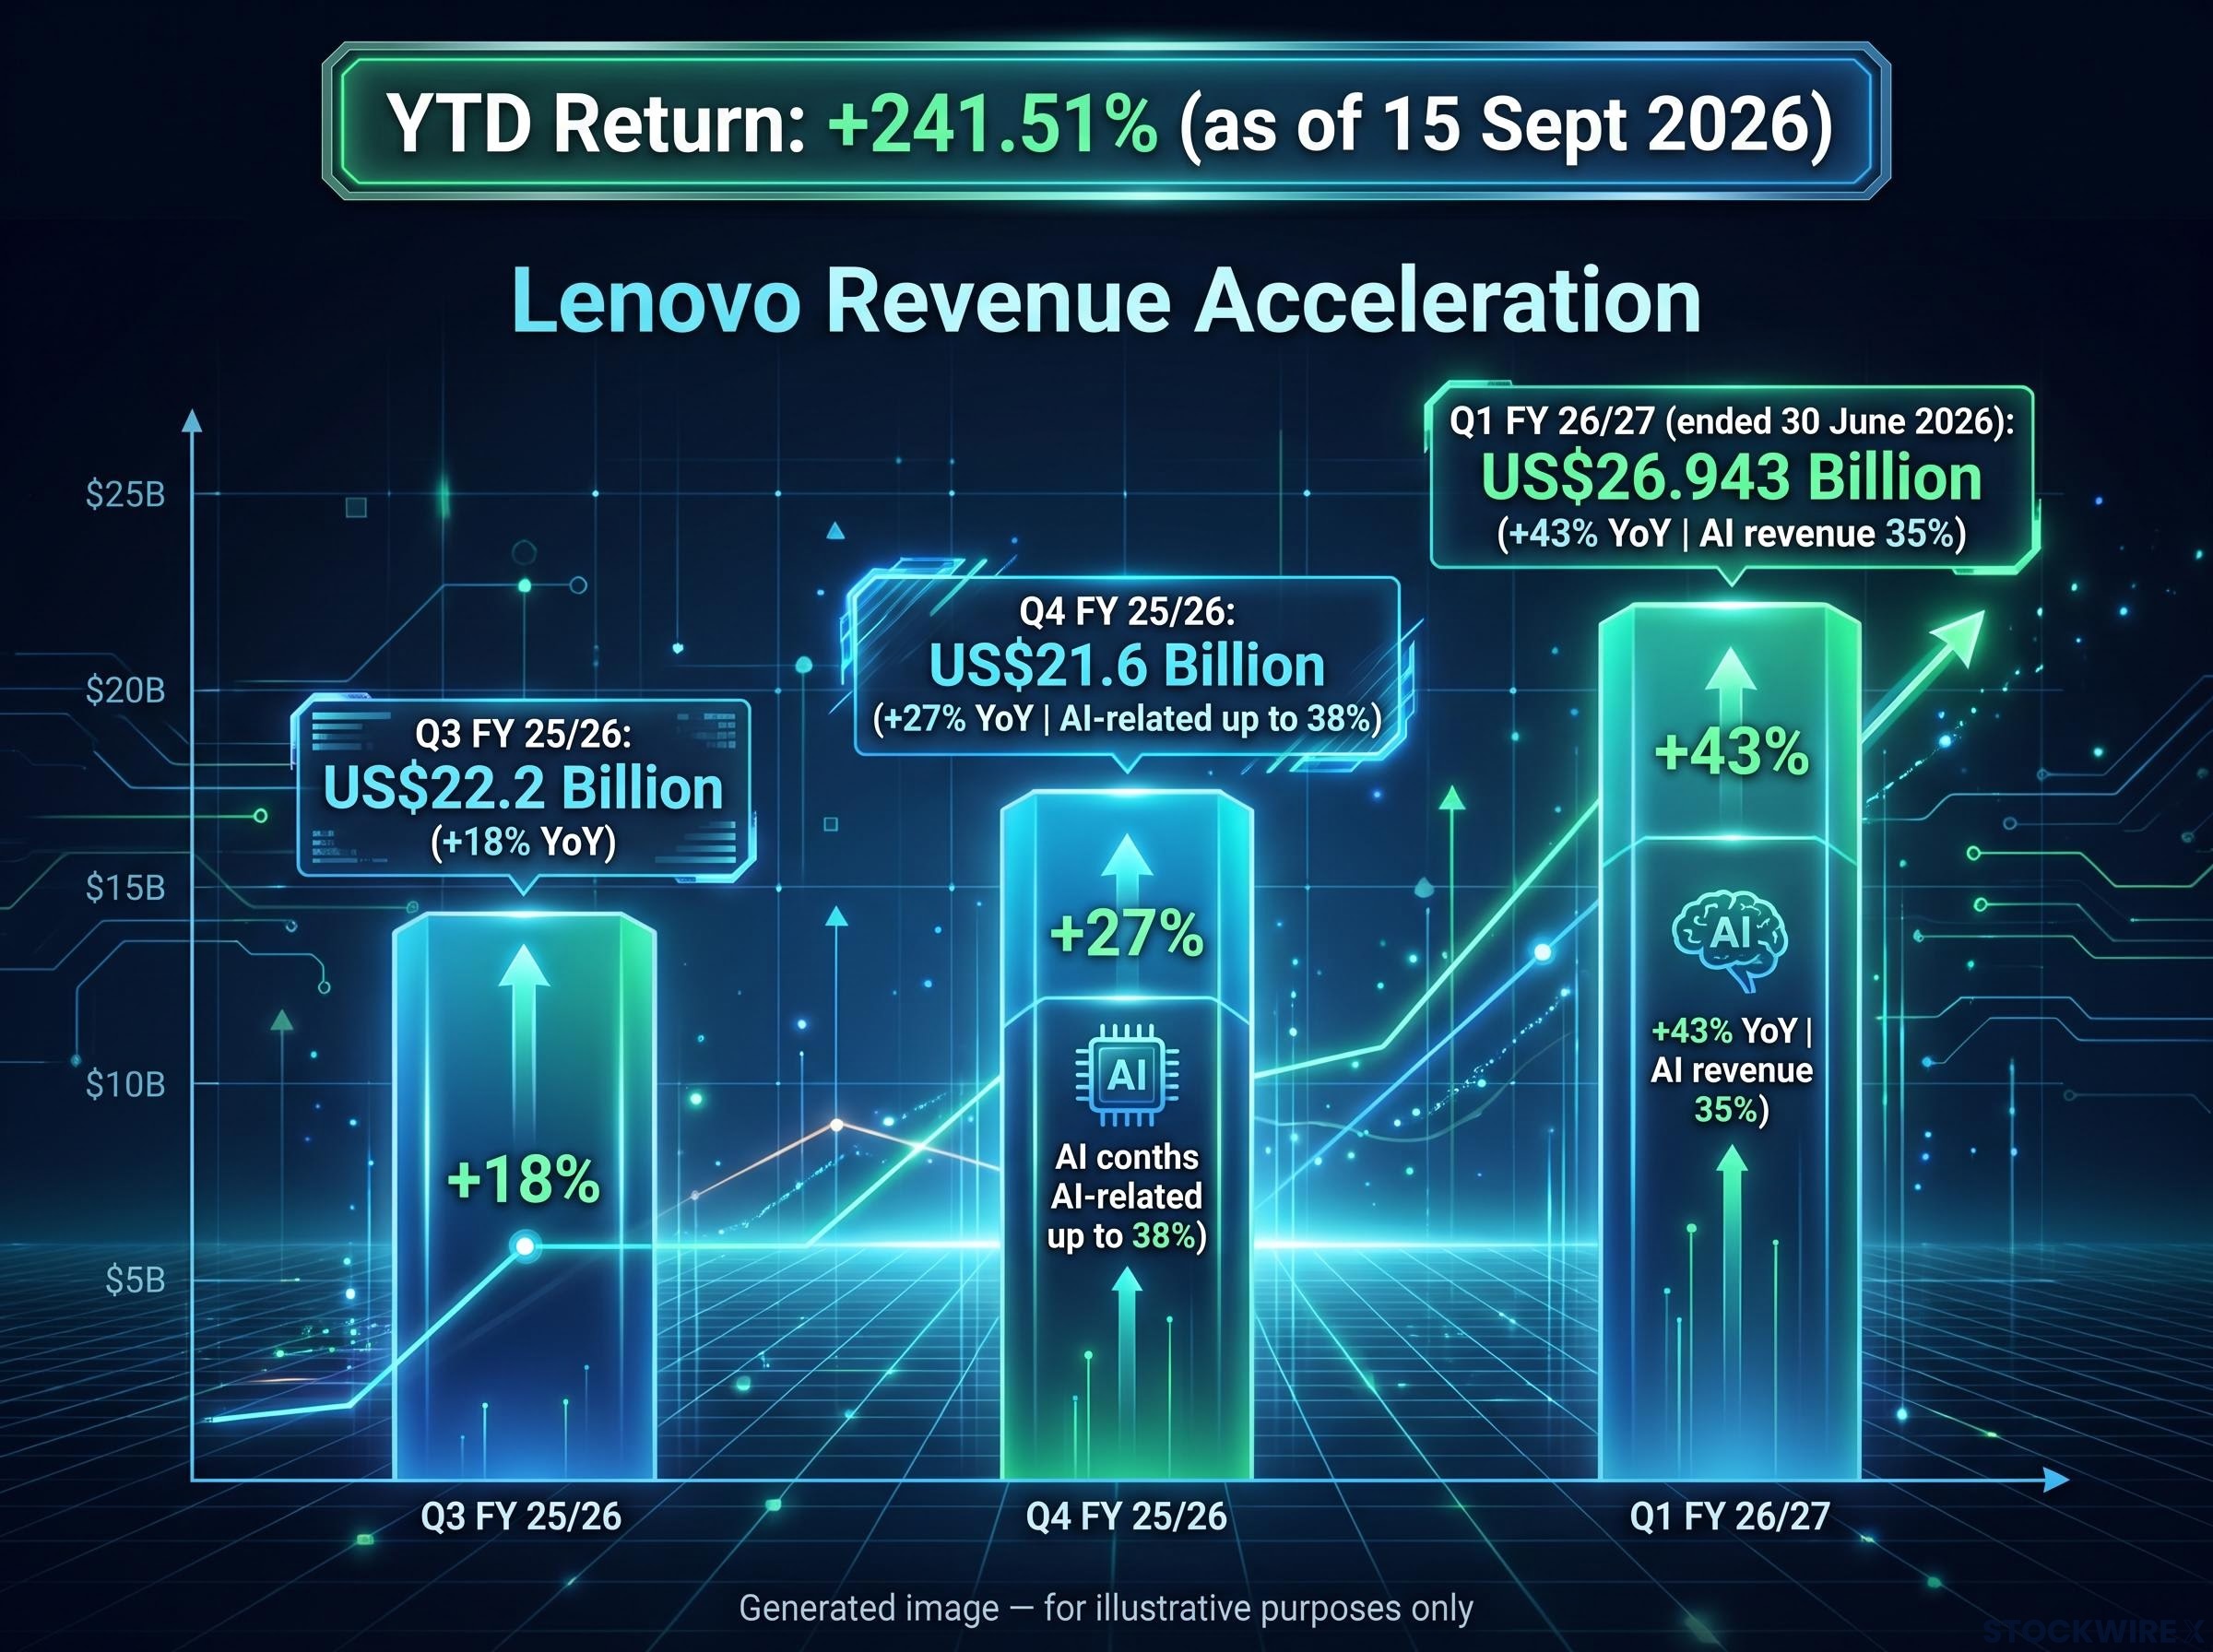
The abstract gap becomes concrete when you look at a single stock. Lenovo, the tenth-largest HSTECH holding, posted a year-to-date return of 241.51% as of 15 September 2026. That is a NASDAQ-scale run inside an index that has fallen nearly 29% over the same rough window.
Here is the part that makes the arbitrage argument interesting: even after tripling, Lenovo trades at a forward P/E materially below its closest US-listed peer, Dell Technologies. The original comparison put Lenovo near 11x against Dell at roughly 21x in mid-2026, though more recent September 2026 data suggests Dell has since compressed toward 13x (flagged as unverified). The gap has narrowed, but it has not closed.
The earnings growth underpinning Lenovo’s run is not speculative.
- Q3 FY 25/26: Group revenue of US$22.2 billion, up 18% year-on-year.
- Q4 FY 25/26: Revenue of US$21.6 billion, up 27% year-on-year, with AI-related revenue contributing up to 38% of the group total.
- Q1 FY 26/27 (ended 30 June 2026): Record revenue of US$26.943 billion, up 43% year-on-year, with AI revenue up 60% and accounting for 35% of the group.
That trajectory is the evidence behind the bull case. Lenovo is repositioning as an AI infrastructure supplier, and its Infrastructure Solutions Group has become a multi-year growth engine as AI server demand spreads beyond hyperscalers into enterprise buyers.
| Metric | Lenovo | Dell Technologies |
|---|---|---|
| Forward P/E | ~11x | ~21x (mid-2026)* |
| Recent revenue growth | +43% YoY (Q1 FY 26/27) | Established scale |
| AI server presence | Expanding ISG pipeline | Market leader by share |
| Listing exchange | Hong Kong | New York |
*September 2026 data suggests Dell may have compressed toward 13x (flagged unverified).
The scale of the identified opportunity is large. Lenovo’s AI server order pipeline started at US$15.5 billion and, in some analyst updates, expanded toward US$54 billion (flagged as unverified, reportedly up 157% quarter-on-quarter across more than 5,800 customer sites), against a global AI server market projected at US$252 billion in 2025.
Analyst view Consensus implies roughly 36% additional upside on Lenovo’s share price beyond current levels.
The read for you is this. If the Lenovo-Dell valuation gap survives even after a 241% run, the market is likely still applying a structural geographic discount rather than pricing Lenovo purely on its business fundamentals. Whether that discount is justified is the exact question the next section forces you to answer.
Why the discount exists, and whether it is rational
Skeptics argue the gap is not mispricing at all, but an accurate price for real risk. Three structural factors sit behind it, and none of them resolves with a single diplomatic headline.
- VIE legal vulnerability: Most major Chinese tech firms listed offshore use a Variable Interest Entity structure, meaning offshore investors hold contractual claims through Cayman shell entities rather than direct equity in the onshore operating company. Chinese law does not explicitly endorse this arrangement.
- Regulatory and policy risk: The 2021-2022 crackdowns brought antitrust fines, online education bans, gig-economy labour laws, data-security investigations, and the cancelled Ant Group IPO, permanently altering foreign investor confidence.
- Geopolitical decoupling: Expanding US restrictions on cross-border investment, semiconductor export controls, and the threat of forced delisting for Chinese ADRs embed a structural rather than cyclical discount.
Geopolitical fragmentation has reshaped how institutional capital prices geographic exposure across every major technology market, with regional equity returns diverging sharply enough in 2025-2026 that the cost of ignoring jurisdictional risk has become measurable rather than theoretical.
The VIE point is the most legally fundamental. Because regulators theoretically retain the power to invalidate VIE contracts, the mechanism that connects your money to the actual business could, in a worst case, be severed. That single feature is frequently cited as the barrier to assigning US-equivalent multiples to Chinese equities.
The US semiconductor export controls on China, formalised through Commerce Department restrictions on advanced computing chips, represent a structural rather than cyclical constraint, meaning the geopolitical discount embedded in HSTECH multiples reflects enforceable policy rather than sentiment alone.
The regulatory overhang compounds it. The crackdowns did not just fine companies; they rewrote business models and reset foreign investor expectations. At one point in 2022, JPMorgan reportedly labelled a group of 28 Chinese internet stocks “uninvestable” (flagged as unverified), a sentiment shift that lingers regardless of near-term earnings improvement.
Macro, liquidity, and operational frictions for ETF investors
If you access HSTECH through an index product rather than individual shares, a further layer of friction applies. ETF prospectuses for these products warn of tracking error, trading at premiums or discounts to net asset value, and constraints tied to RMB convertibility and capital controls.
Broader China macro concerns feed the same suppression. Property sector weakness and a softer growth outlook have weighed on local liquidity, and while the original reporting notes these fears have not translated into significant economic disruption, they continue to hold back sentiment and multiple expansion. Periods of US dollar strength, driven by delayed rate cuts and geopolitical tension, have also drained offshore liquidity from Hong Kong.
The takeaway is uncomfortable by design. These are not headwinds that clear on a good news cycle; they are permanent features of the asset class, and a rotation requires you to decide, category by category, whether the return premium compensates for each one.
Building a rotation framework: what the data actually requires you to decide
Shift now from observation to decision. The valuation gap is real and the constituent-level growth is compelling, but neither fact answers the question of whether you should act. Three explicit choices do.
- VIE legal risk acceptance. Are you comfortable holding contractual claims through offshore shells rather than direct equity, knowing Chinese law does not explicitly endorse the structure?
- Policy unpredictability tolerance. Can you sit through the possibility of further regulatory intervention on data, AI rules, or internet service taxation without it breaking your thesis?
- Discount compression horizon. Do you actually believe the geographic discount will narrow within your holding period, or are you buying something that could stay cheap for years?
For many investors, the entry point is not speculation but rebalancing. If passive appreciation has left you overweight US tech, a partial HSTECH allocation is partly a portfolio construction decision rather than a pure directional bet, which changes the risk calculus.
Portfolio rebalancing after multi-year equity appreciation is the lens through which many investors in 2026 are approaching HSTECH exposure, with passive US tech gains having silently pushed many portfolios well beyond their intended geographic and sector weightings before a single deliberate trade was placed.
The single-name case carries its own execution risk. Lenovo’s pipeline, whether the initial US$15.5 billion or the reported US$54 billion figure, represents identified opportunity, not booked revenue. Converting it depends heavily on securing GPU allocations, particularly Nvidia Blackwell supply, so the timing of earnings realisation is not fully in Lenovo’s hands.
Concentration already exists in the market An April 2025 factsheet for the eUnittrust Hong Kong Tech Index Fund showed 94.85% of its assets in a single CSOP Hang Seng TECH Index ETF, a reminder of how concentrated thematic HSTECH exposure already is.
Holding-period context matters too. HSTECH’s five-year return has been cited at -6.91% (flagged as unverified) against the NASDAQ 100’s long-run compounding, and with just 30 constituents versus 100, concentration cuts both ways.
The framework’s honest conclusion is that the rotation is ultimately a bet on policy normalisation and VIE legal continuity. No amount of Lenovo revenue growth fully de-risks that bet.
What a disciplined rotation position actually looks like in 2026
The tension does not resolve neatly, and pretending otherwise would not help you. What helps is knowing which type of investor you are and which conditions would validate the trade.
Two archetypes, two different bars
The first archetype is the investor correcting inadvertent US tech concentration. For them, a partial HSTECH allocation is a construction decision, and the bar is lower because the rotation reduces a specific portfolio risk they already carry.
The second is the investor making a directional valuation call, betting the discount closes. For them the bar is far higher, because the entire return depends on the risk stack resolving favourably rather than on rebalancing logic.
The discount would rationally compress if:
- Policy signals bring clarity on VIE enforcement.
- US-China geopolitical tension de-escalates.
- HSTECH constituents convert AI pipelines into booked revenue and margin expansion.
When the discount is still rational
The discount would rationally persist or widen if:
- No clarity emerges on VIE enforcement.
- Geopolitical escalation continues.
- Pipeline-to-revenue conversion stalls on GPU supply constraints.
- Sustained US dollar strength keeps draining offshore liquidity.
Two facts should anchor your judgement either way. HSTECH’s 24.9x year-end 2025 P/E shows re-rating has happened before and can happen again when sentiment shifts, while Lenovo’s 241.51% run and consensus 36% further upside show individual constituents can deliver NASDAQ-scale returns even inside a weak index.
The lower AI infrastructure weighting is both the risk and the asymmetry. It means less participation in the current capex cycle, but if a re-rating arrives, HSTECH has further to travel than an index already priced for the theme.
The AI capex cycle driving NASDAQ 100 multiple expansion is now operating at a scale that surpasses every prior US technology investment peak, with combined hyperscaler commitments for 2026 sitting in the $600-$805 billion range, making HSTECH’s lower participation in that buildout a structural drag on relative valuation rather than a temporary divergence.
This article is for informational purposes only and should not be considered financial advice. Investors should conduct their own research and consult with financial professionals before making investment decisions. Past performance does not guarantee future results, and financial projections are subject to market conditions and various risk factors. Forward-looking statements are speculative and subject to change based on market developments.