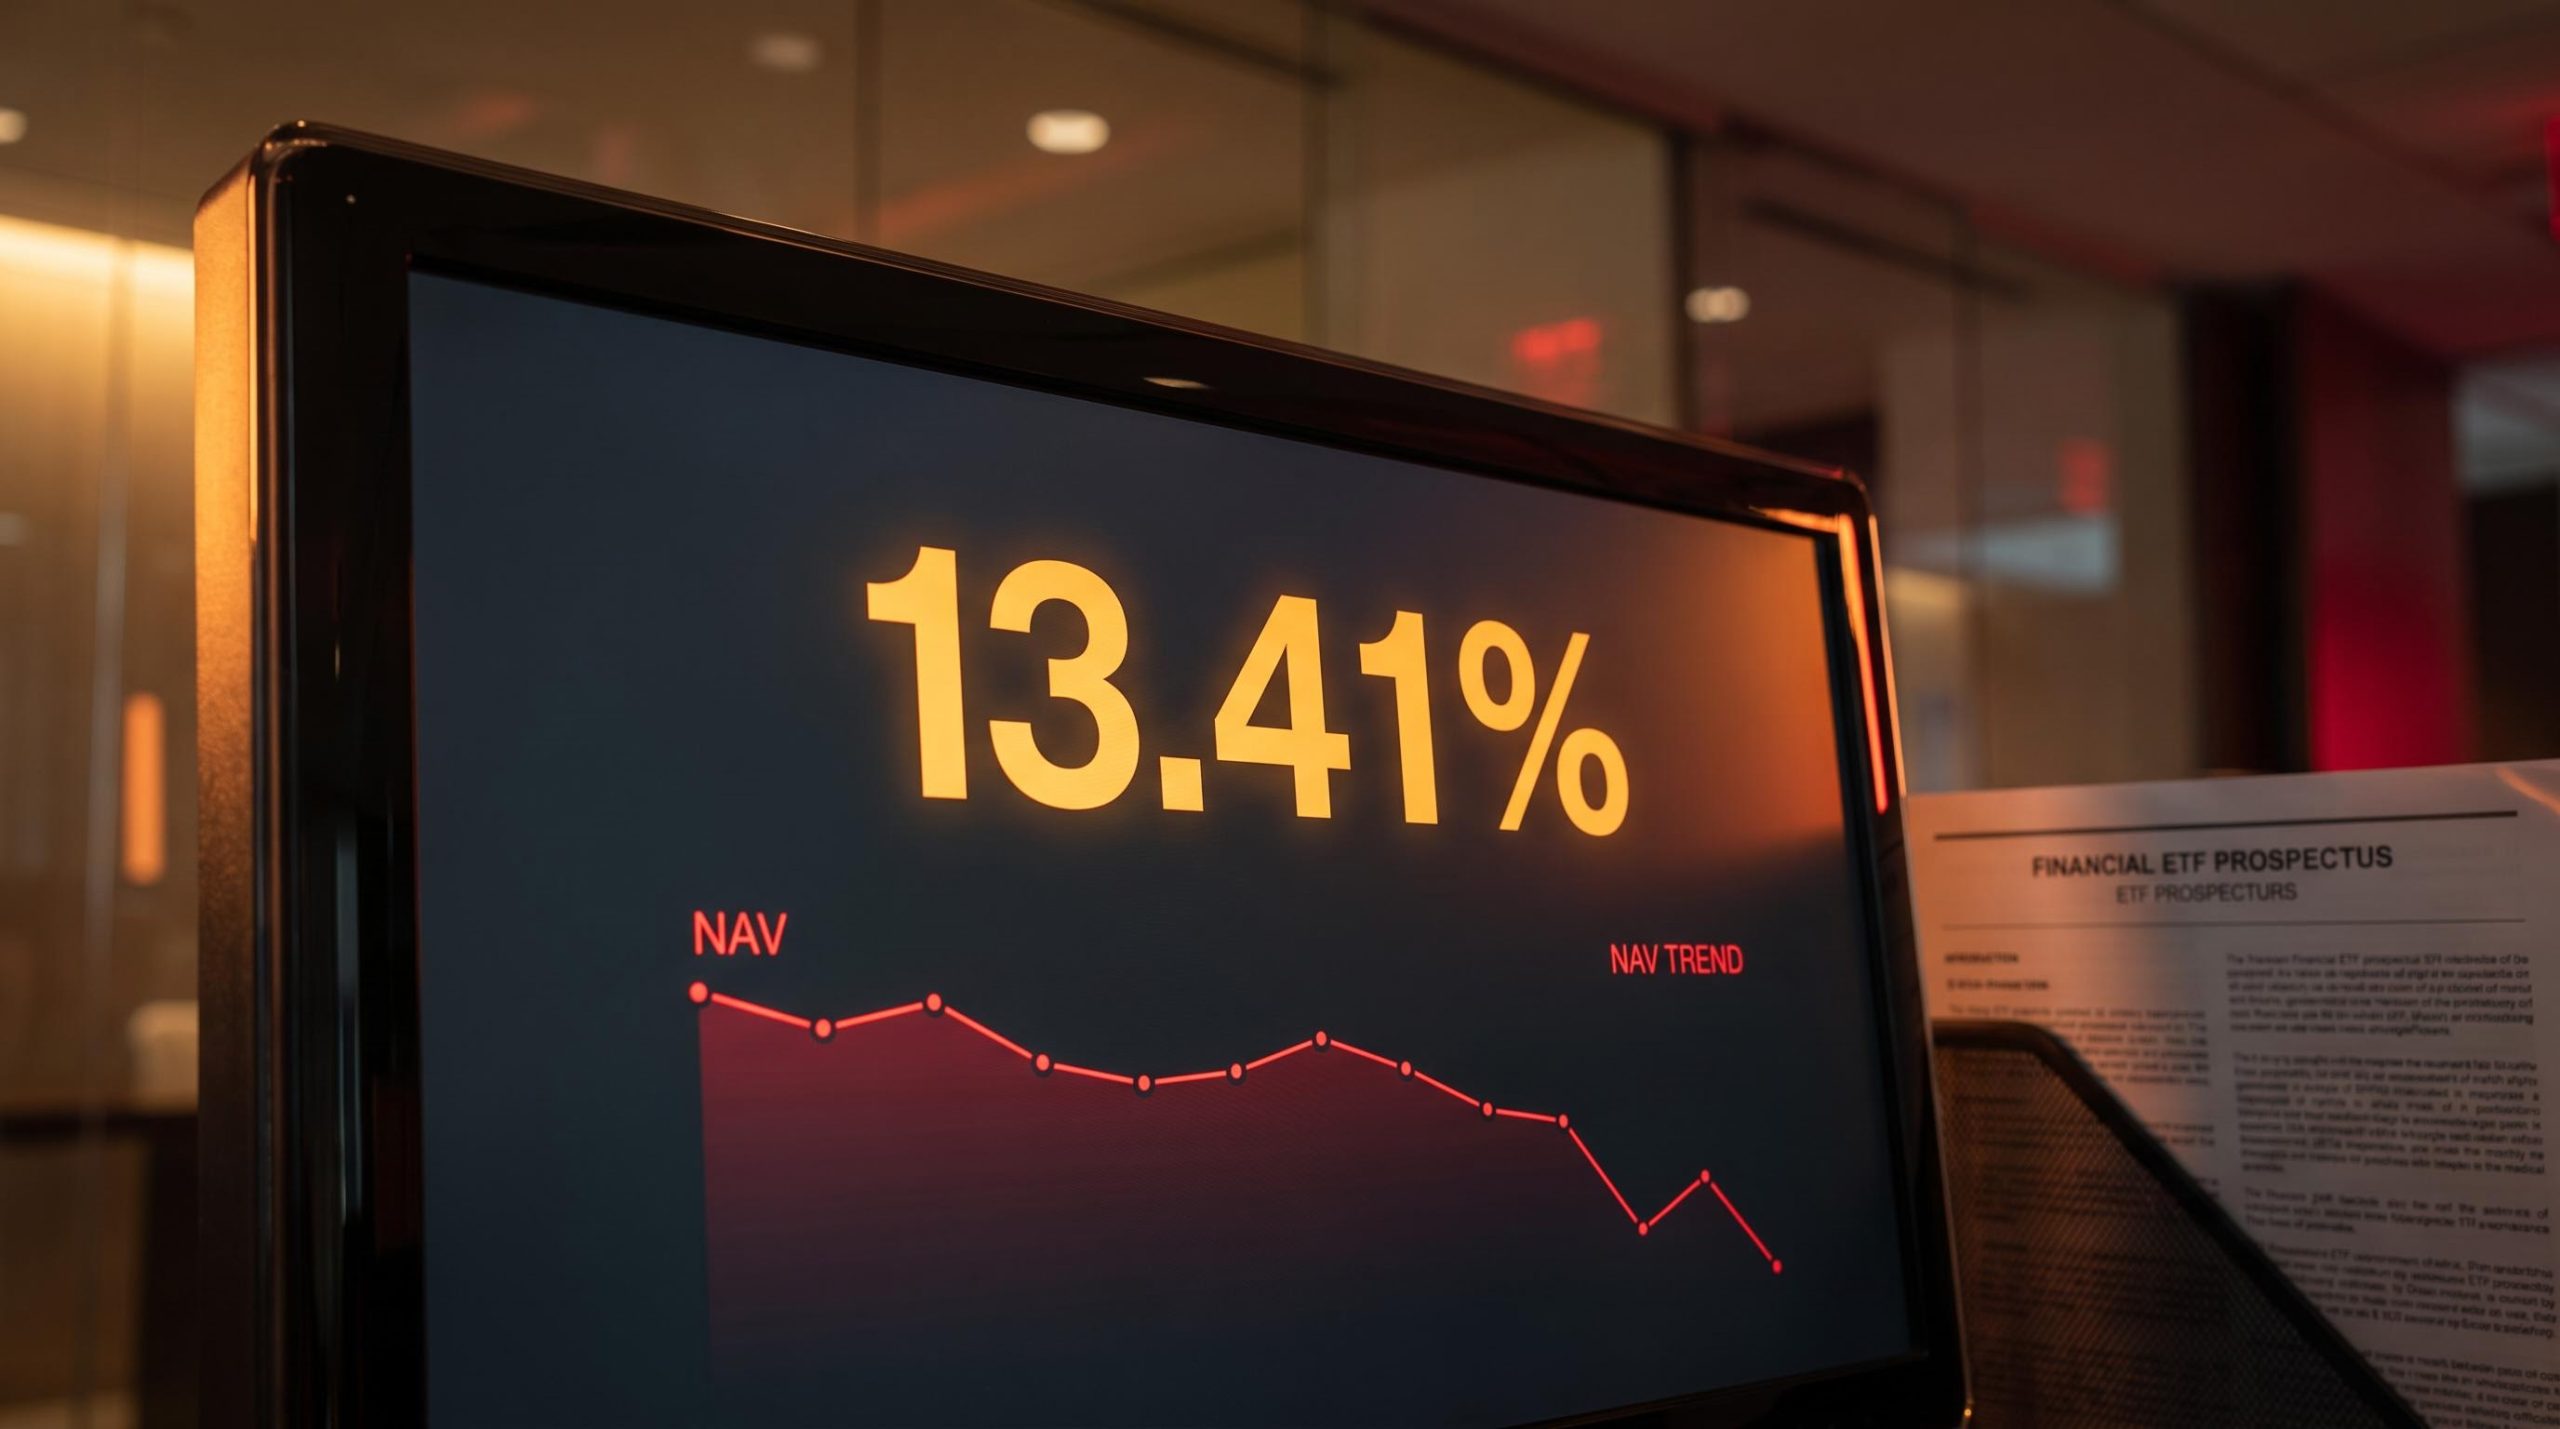
Some Canadian utility-focused exchange-traded funds are advertising distribution yields north of 13%, and a few push past 18%. On paper, that looks like one of the most generous income streams available to a self-directed investor. The reality since late February 2026 has been colder: capital eroding steadily, month after month, while the headline yield keeps flashing.
That gap between the yield number and the total return is where this story lives. Three separate pressures arrived at roughly the same time: a domestic bond yield surge of around 70 basis points since late June that compressed valuations across the sector, a 55% dividend cut at a major ETF holding that exposed balance-sheet stress hiding beneath the yield surface, and a pipeline incident that layered fresh idiosyncratic risk onto an already stressed group of stocks.
Understanding why Canadian utility ETFs are struggling means separating what is structural from what is temporary. Here is the framework for telling macro-driven sector weakness apart from company-specific impairment, and the forward indicators worth watching before reassessing any exposure.
The rate mechanism: how a 70-basis-point yield move became a sector headwind
Start with the number that anchors everything else. In late February 2026, Canada’s 10-year government bond yield sat at approximately 3.13%. That moment also marked the high-water mark for utility ETF performance in this period. The two facts are not a coincidence.
By mid-September 2026, that same 10-year yield had climbed to approximately 3.96%. The late-June baseline is where sources diverge slightly: the original data reports roughly 3.37%, while the Bank of Canada’s official benchmark puts it at 3.25% on 23 June 2026. Either way, the move from late June to mid-September lands at around 70 basis points. Yields went up. Utility prices went down.
The Bank of Canada benchmark bond yields tool provides the official historical 10-year rate series, sourced from CanDeal DNA, against which the late-February, late-June, and mid-September reference points in this analysis can be independently verified.
Why the tight inverse relationship? Utilities, pipelines, and infrastructure are capital-intensive and carry heavy debt, which makes them behave like long-duration bond proxies. A bond proxy is an equity whose steady, long-dated cash flows make it trade more like a fixed-income instrument than a growth stock. When bond yields rise, these assets get repriced through three channels:
The inverse relationship between prices and yields is not intuitive until you see the arithmetic: bond yield mechanics follow directly from the fixed-coupon structure, where a lower purchase price must produce a higher effective return, and that same logic drives the repricing of utility equities when government yields shift.
- Discount-rate compression: Higher long-term rates lift the required return investors demand, which shrinks the present value of cash flows stretching decades into the future. That squeezes price-to-earnings multiples across the sector.
- Cost-of-debt escalation: Leveraged balance sheets face higher borrowing costs as debt rolls over, and elevated yields also complicate planned asset sales. Analysts describe this as a double hit to earnings under a prolonged higher-for-longer regime.
- Investor rotation: When risk-free government bonds start yielding close to utility dividends, income-seeking investors move capital into fixed income, adding technical selling pressure on utility equities.
The scale of the valuation hit is not abstract. Research from Barclays quantifies exactly how sensitive these assets are.
Barclays estimates that every 10-basis-point change in the weighted average cost of capital reduces regulated utility valuations by approximately 1%, and renewable valuations by approximately 2.4%.
Run the arithmetic on the actual move. A 70-basis-point shift, applied at that sensitivity, implies roughly a 7% valuation drag on regulated utilities and closer to 17% on renewable-heavy holdings, before a single operational headline is factored in. That is what it means for your exposure: much of the price decline in these funds reflects rate mathematics, not the operational health of the companies inside them.
When big ASX news breaks, our subscribers know first
What these ETFs actually are: yield mechanics, leverage, and the return-of-capital problem
The rate move explains the sector. The fund structure explains why the damage lands harder than the sector average, and why the headline yield is not what it appears to be.
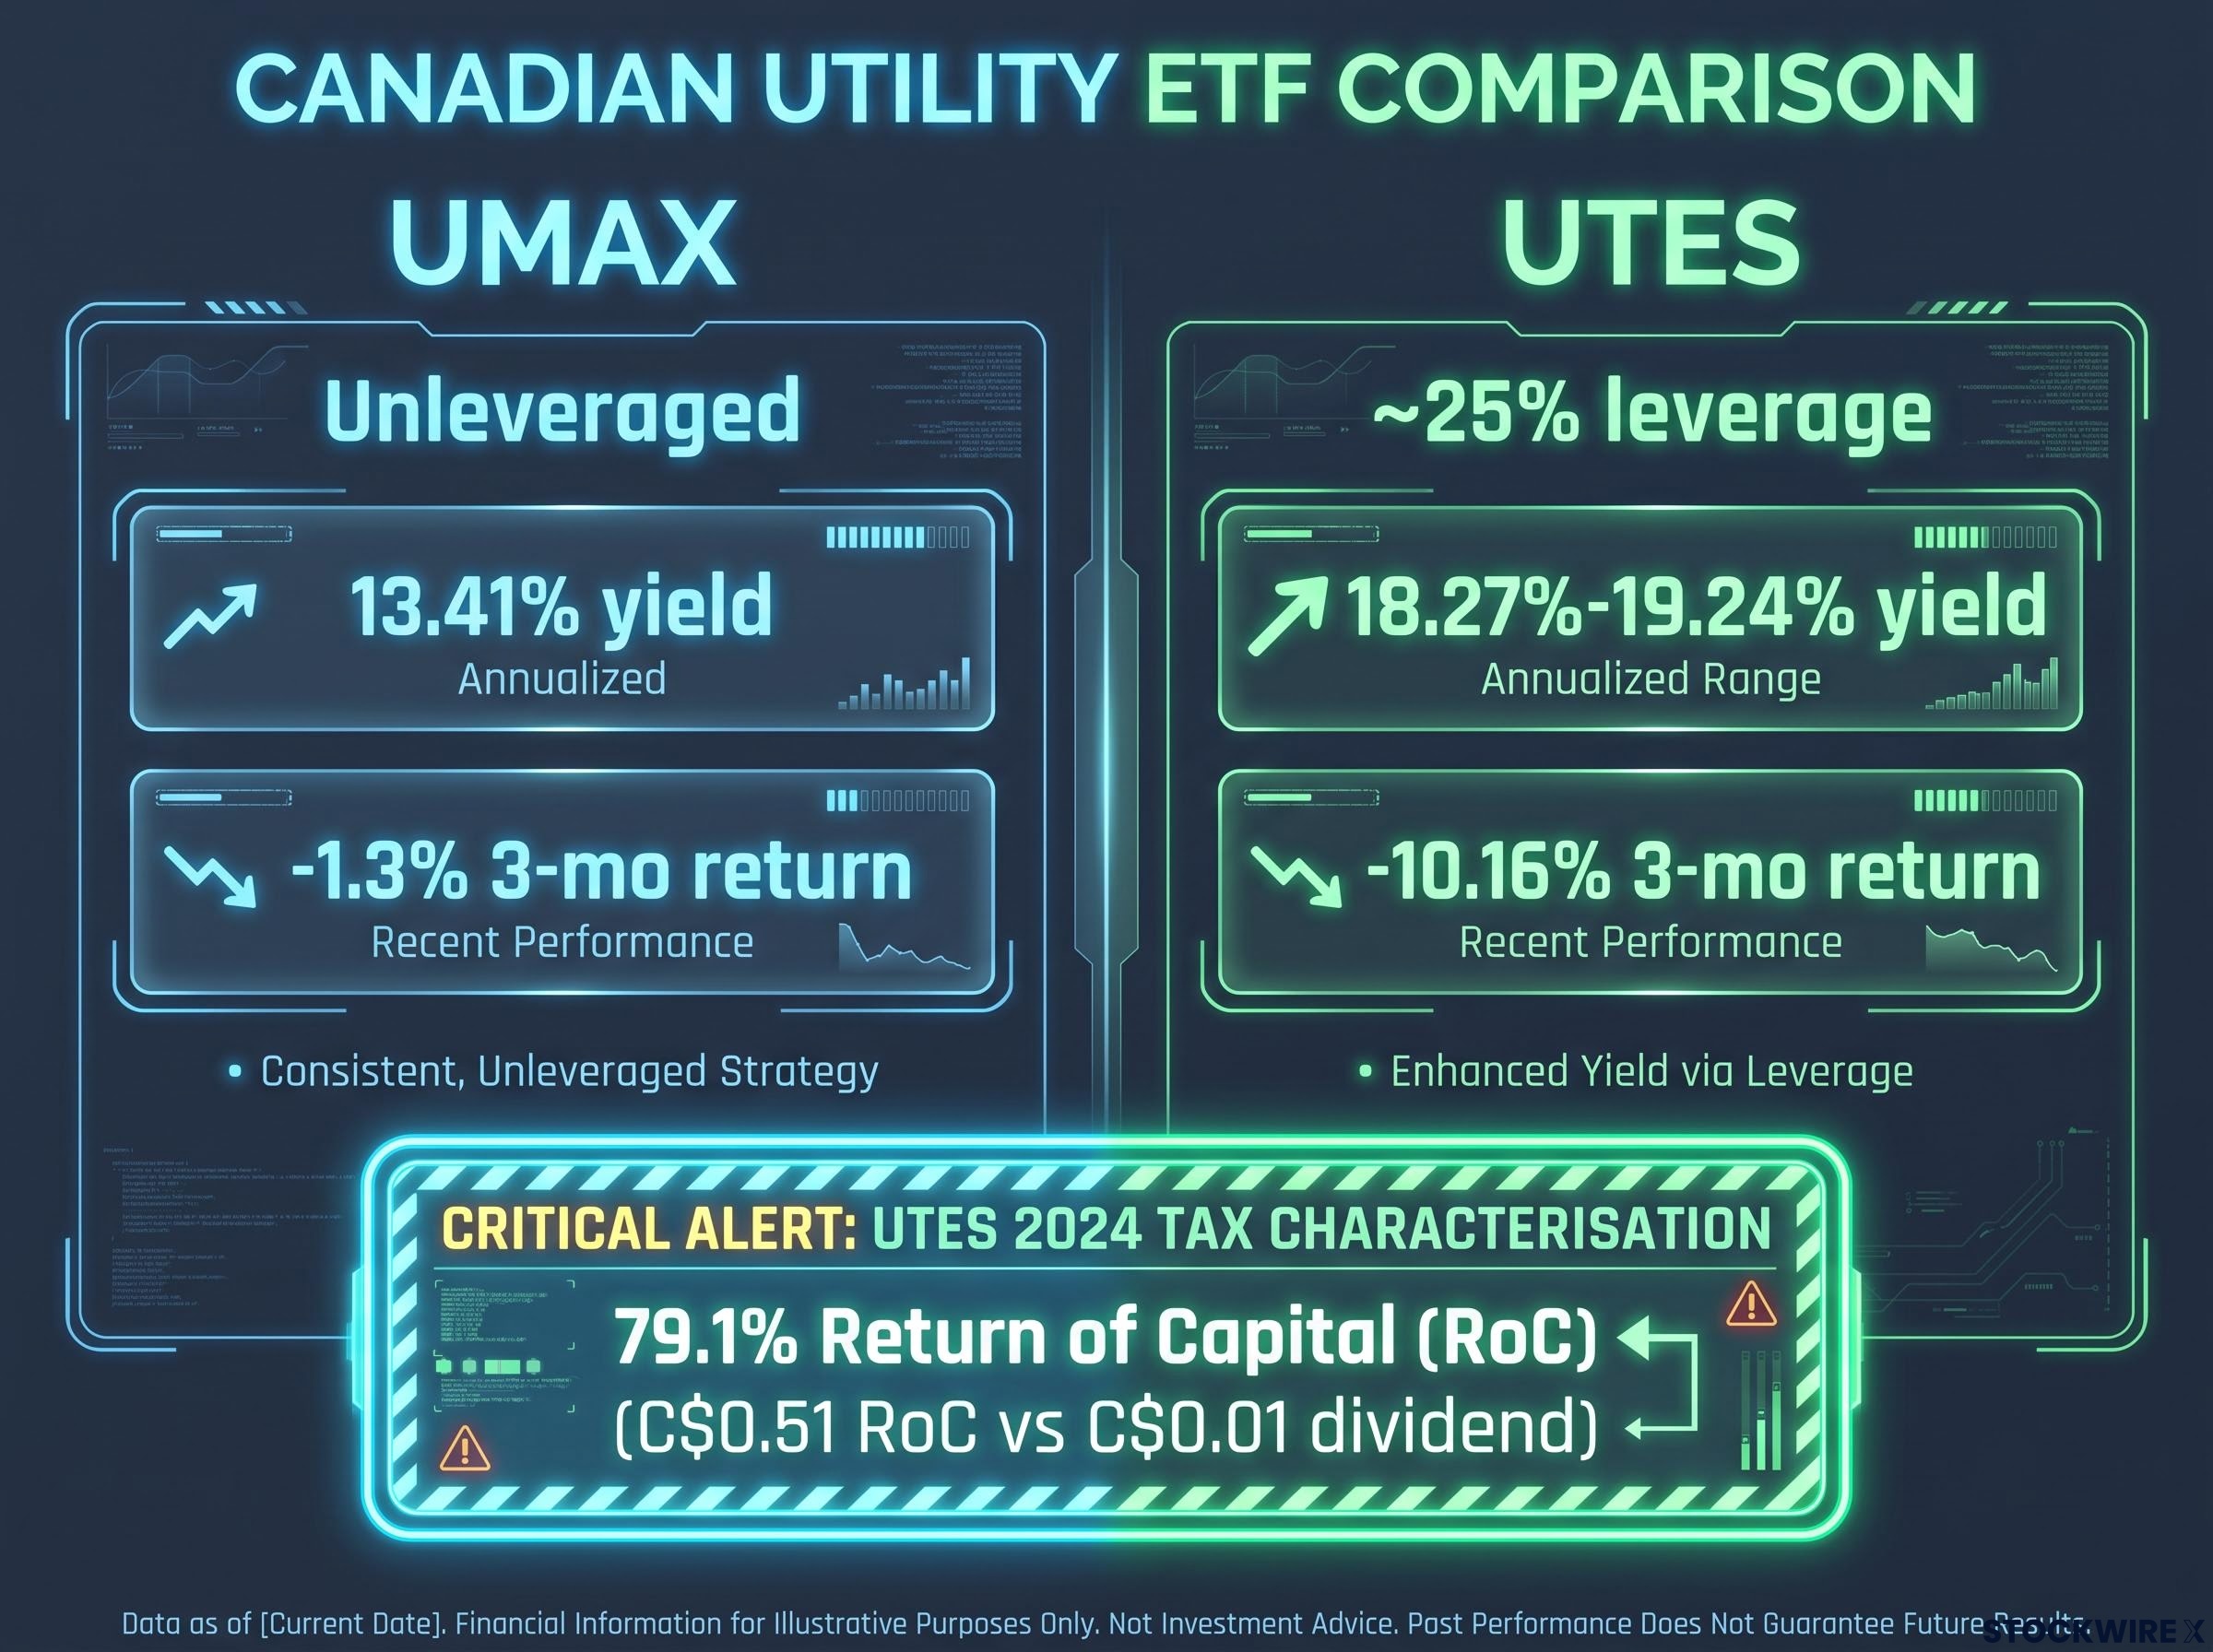
Consider two representative funds. The Hamilton Utilities YIELD MAXIMIZER ETF (UMAX) is unleveraged, paying a 13.41% annualised distribution yield monthly. The Evolve Canadian Utilities Enhanced Yield Index Fund (UTES) runs roughly 25% leverage alongside an active covered-call strategy, with a trailing 12-month yield of between 18.27% and 19.24%.
| Fund | Structure | Yield | 3-month return | Key structural risk |
|---|---|---|---|---|
| UMAX | Unleveraged, covered-call | 13.41% | -1.3% (6-month: -0.7%) | Upside capped by covered calls |
| UTES | ~25% leverage, covered-call | 18.27%-19.24% | -10.16% (1-month: -2.21%) | Leverage magnifies drawdowns |
The -10.16% three-month figure on UTES against UMAX’s -1.3% is the leverage story in a single line. Borrowing amplifies drawdowns, and because the leverage is rebalanced back to target within two business days of drifting, losses can be locked in during sharp sell-offs rather than recovered.
Now the part that should genuinely unsettle any income investor. A large share of these distributions is not funded by income at all. It is return of capital, meaning the fund hands you back your own money and reports it as yield.
In UTES tax characterisations for 2024, roughly 79.1% of the distribution was classified as return of capital: C$0.51 per unit of return of capital against just C$0.01 from actual dividends.
Read that ratio again. For every one cent of genuine dividend income, an investor received fifty-one cents of their own capital back, dressed up as yield. That is the structural definition of a distribution that cannot be sustained without steadily eroding the fund’s net asset value. The high yield that attracted you is, in large part, capital liquidation on a schedule.
Covered call ETF tax treatment in Canada adds another layer to this structural problem: a distribution classified as return of capital reduces the investor’s adjusted cost base rather than generating taxable income in the year received, which means the erosion is deferred and often invisible until units are eventually sold.
The covered-call overlay compounds the asymmetry. Selling call options caps how much the fund can gain in a recovery rally, while doing nothing to protect against rate-driven declines. You hold full exposure to the downside and a ceiling on the upside. In a falling market that structure works against you twice.
Company-specific damage: Telus’s dividend reset and the Enbridge pipeline incident
Two events hit these portfolios directly. They are different in nature but convergent in effect, and keeping them separate is essential to judging what is recoverable and what is not.
The first is a deliberate strategic choice. On 31 July 2026, alongside its second-quarter results, Telus announced a sharp dividend reset. (Note that an earlier source placed this in late June; the confirmed announcement date is 31 July 2026.) The move crystallised a balance-sheet problem that had been building across Canadian telecoms for years.
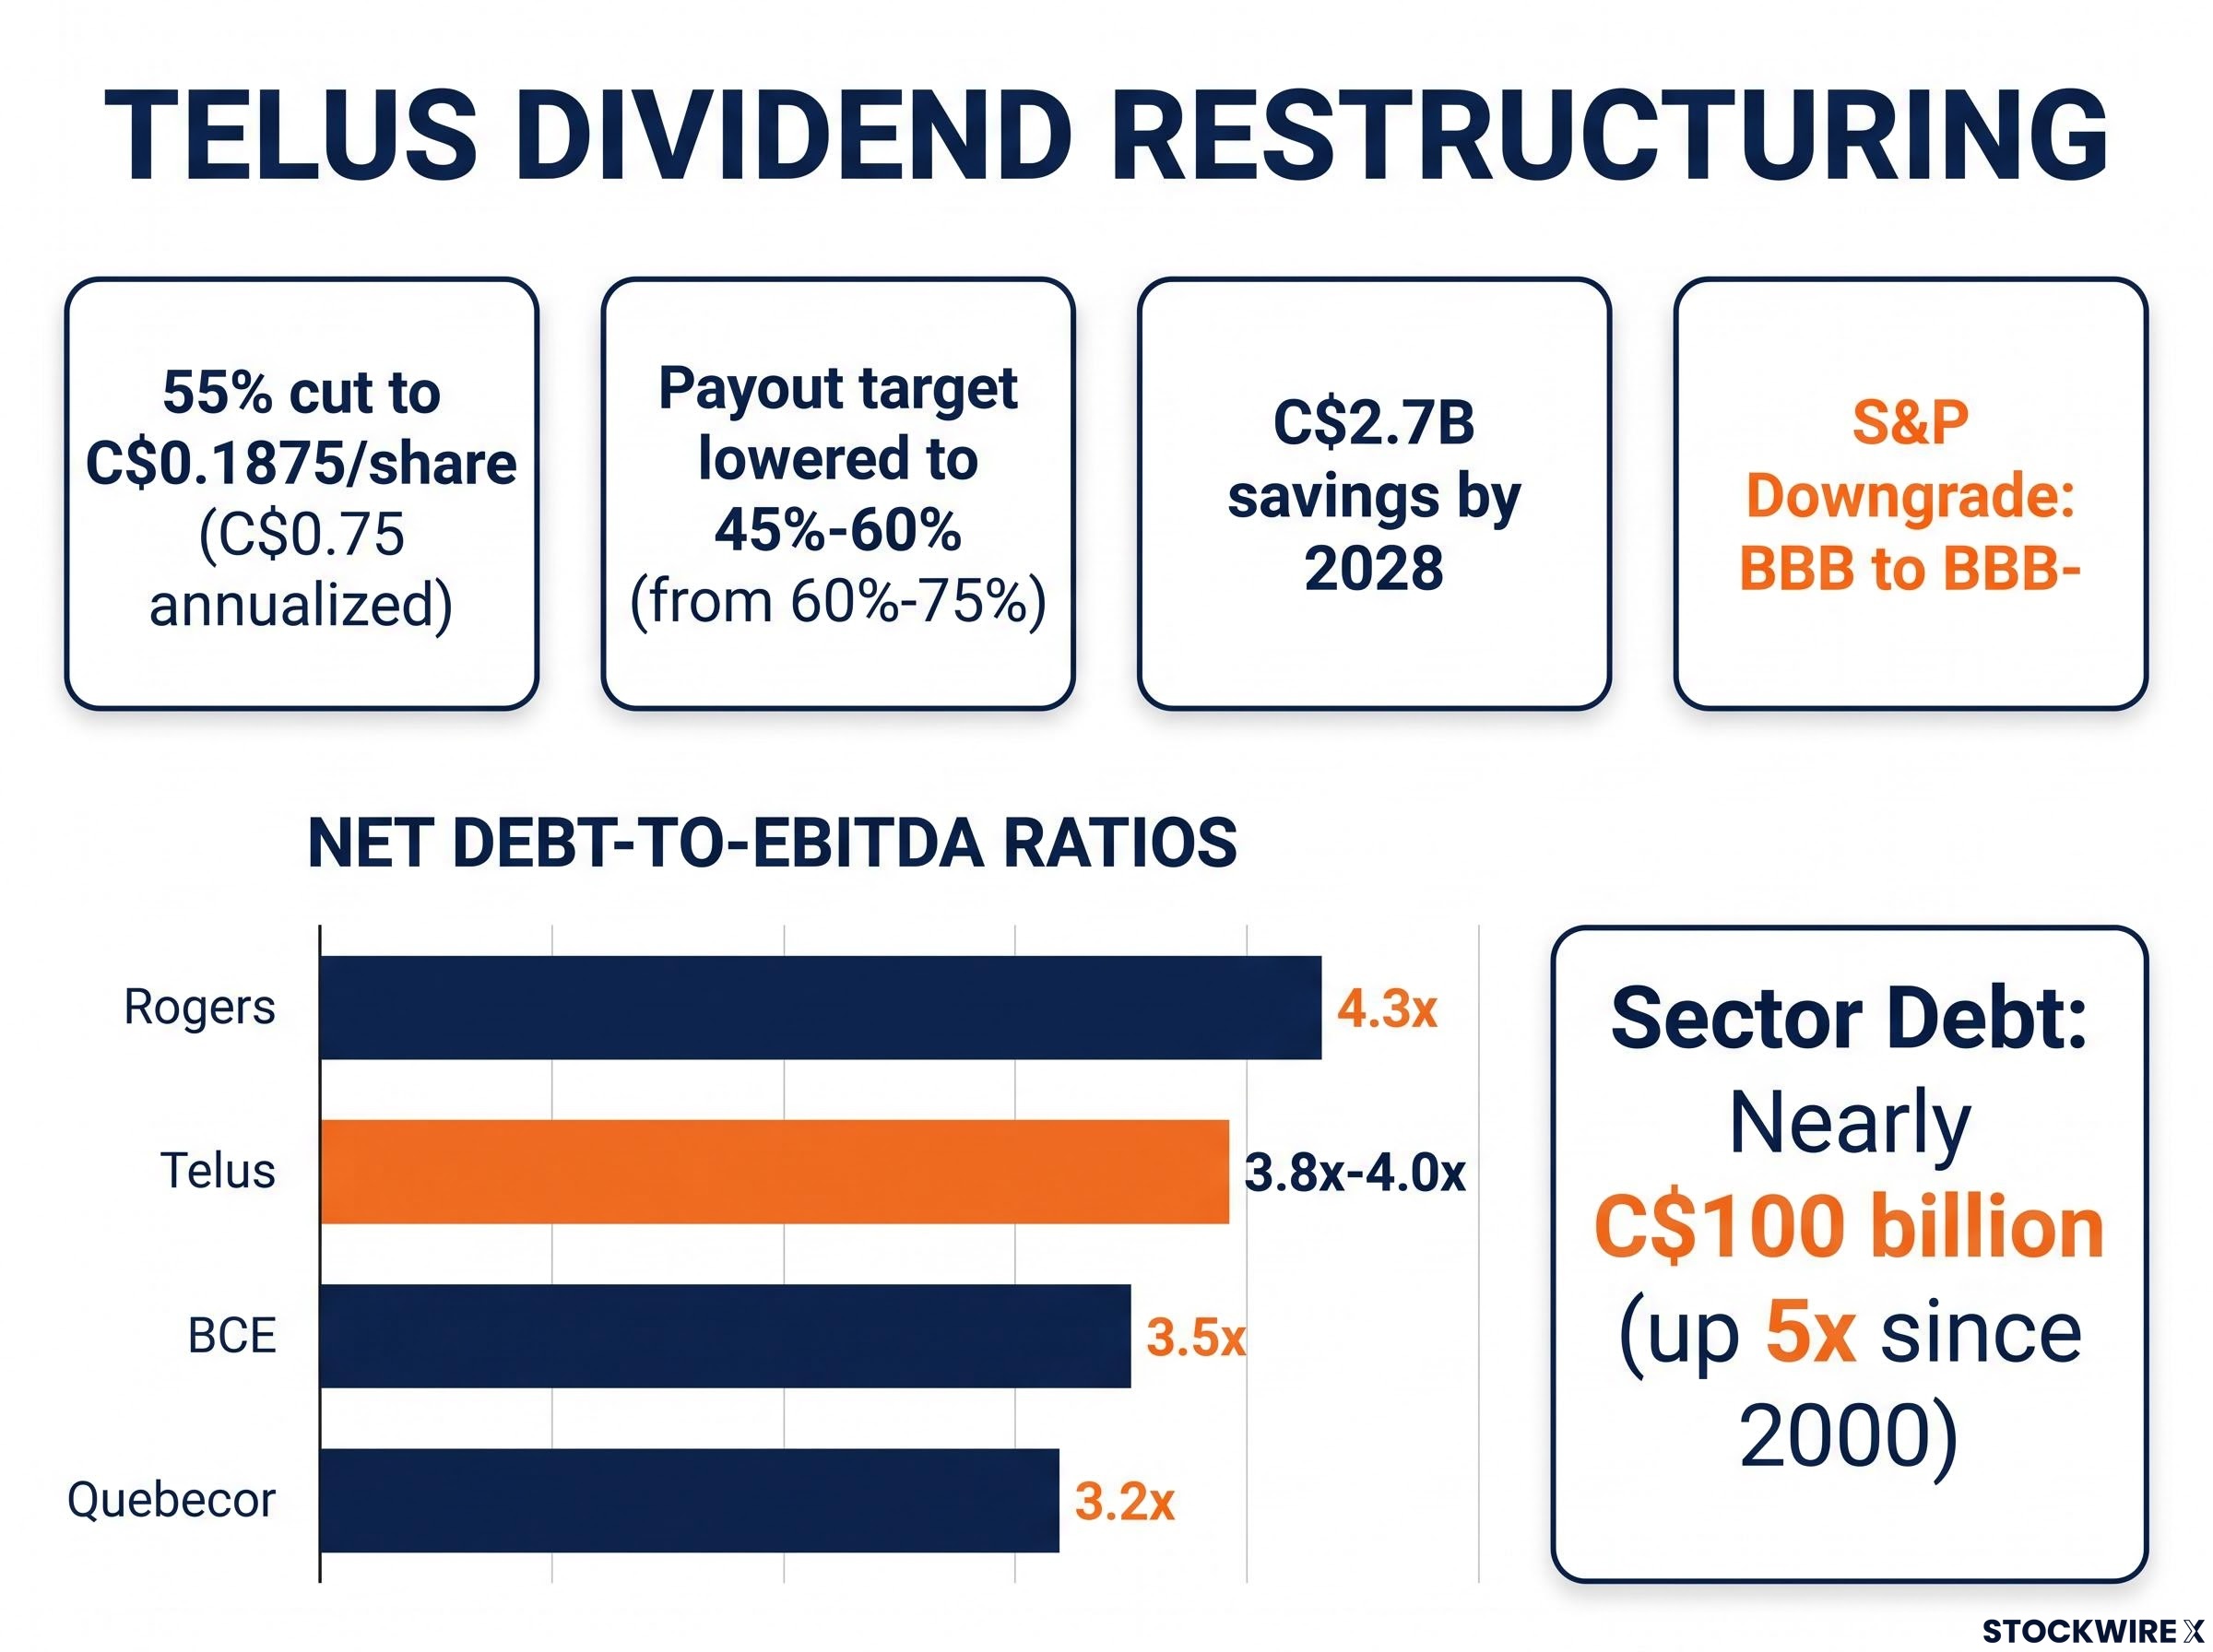
- The quarterly dividend was cut 55% to C$0.1875 per share, annualising to C$0.75.
- The long-term payout ratio target dropped from 60%-75% of free cash flow to 45%-60%.
- The dividend reinvestment plan discount was removed, effective 1 October 2026.
- Management expects C$2.7 billion in cumulative cash savings through 2028, directed entirely at debt reduction.
Telus is not an isolated case. Canada’s four largest telecoms now carry nearly C$100 billion in long-term debt, roughly a fivefold rise since 2000, driven by 5G spectrum, fibre, and large deals such as Rogers-Shaw. Net debt-to-EBITDA ratios sit well above the sector’s typical 3x target: Rogers around 4.3x, Telus around 3.8x-4.0x, BCE around 3.5x, and Quebecor around 3.2x. S&P Global Ratings downgraded Telus from BBB to BBB-, citing leverage above 4.0x, and BCE has also halved its own dividend.
Here is why that matters to you specifically. These ETFs typically hold an equal-weight basket of around 10 stocks. Concentration like that means a single holding’s 55% dividend cut lands as an outsized drag on the whole portfolio’s income stream. If you hold one of these funds, this is the prompt to check your top holdings and ask how much of your yield depends on names undergoing forced deleveraging.
Enbridge Line 5: operational incident, regulatory halt, and recovery timeline
The second event was an accident, not a strategy. On 25 August 2026, a parked subcontractor truck rolled into an open excavation trench at a valve construction site on Enbridge’s Line 5 near Saxon in Iron County, northern Wisconsin, puncturing the pipeline.
The breach released approximately 31,000 barrels (about 1.3 million gallons) of natural gas liquids, mostly propane and butane. That makes it the largest oil and gas pipeline spill reported in Wisconsin in more than 50 years. Because the leak was natural gas liquids, most of the volume vaporised into the atmosphere; the roughly 2,000 barrels left in the trench were eliminated through controlled burns using flare stacks.
The operational fallout was real but time-bound. The Wisconsin Department of Natural Resources temporarily halted work on the broader Line 5 reroute project, and the pipeline stayed shut until mid-September 2026, when Enbridge restored service via a temporary bypass around the damaged section. Line 5 already carries a contested regulatory history around that reroute, which forms the backdrop here rather than the substance of this incident.
The distinction to hold onto: Telus is a structural restructuring, while the Enbridge spill is a cyclical operational hit with a visible recovery path. One reshapes the income stream; the other dents earnings for a quarter.
Rate plateau or buying opportunity? What the analyst divide tells you about timing risk
Where the sector goes next depends almost entirely on rates, and well-resourced analysts are split down the middle on how that resolves.
The cautious camp, which includes Barclays, Truist, and DPIM, argues that sector valuations remain elevated relative to the 10-year Government of Canada bond yield. If a higher-for-longer rate environment persists, investors will keep favouring bonds over utilities, capping any multiple expansion and sustaining technical selling pressure even where operational fundamentals hold up.
The constructive camp reads the same sell-off as a mispriced entry point. This view holds that utilities are shifting from purely defensive income plays into growth-and-income vehicles, with genuine earnings optionality from surging data centre electricity demand, broad electrification, and LNG expansion. Management teams across the sector are generally targeting 5%-8% annual earnings and dividend growth.
Utility ETFs and AI demand have become structurally linked through data centre power requirements, with Goldman Sachs projecting a 165% surge in data centre electricity consumption by 2030, an earnings optionality argument that underpins the constructive camp’s view that rate-driven sell-offs may represent mispriced entry points.
| View | Key thesis | Primary risk cited | Rate assumption |
|---|---|---|---|
| Cautious | Valuations elevated vs bond yields | Continued rotation into fixed income | Higher-for-longer persists |
| Constructive | Sell-off is a mispriced entry point | Missing secular electrification growth | Rates eventually normalise |
The constructive camp frequently points to specific names as well-positioned for regulated rate-base growth:
- Fortis
- Emera
- Brookfield Renewable
- Northland Power
- Canadian Utilities
- Enbridge
- Hydro One
The divide itself is the signal worth reading. When institutions this well-resourced hold opposing views on the same sector, the honest takeaway for you is that the forward outcome is genuinely uncertain, and the disagreement resolves on one variable: how long the higher-for-longer rate environment lasts. Nearly C$100 billion of telecom debt, up roughly fivefold since 2000, is exactly why that single variable carries so much weight here.
Three variables to watch before reassessing your exposure
The framework built across this piece converts into a short monitoring checklist. Watch these three, in this order.
- The 10-year Government of Canada bond yield trajectory. Reference the anchors already established: the late-February peak of 3.13%, the late-June baseline of 3.25%-3.37%, and the mid-September reading of 3.96%. A sustained move back toward 3.25% or below would materially reverse the valuation arithmetic from the Barclays sensitivity, turning the sector tailwind back on.
- The next Telus and BCE quarterly results. Watch whether the lower payout ratios are actually generating deleveraging progress. Telus committed to C$2.7 billion in cumulative savings through 2028; that is the benchmark against which quarterly progress should be measured. Further restructuring signals would be a warning, not a bottom.
- The return-of-capital composition of any high-yield holding. The 79.1% RoC figure on UTES is the benchmark for structural deterioration. If NAV keeps eroding while distributions stay elevated, the income illusion is worsening, not stabilising.
The three variables are not equal. The bond yield is the master variable: without yield normalisation, even a genuine company-level recovery cannot translate into ETF price recovery, and the other two become secondary.
For investors reassessing whether any high-yield income strategy belongs in their portfolio after this experience, our deep-dive into dividend strategy hidden risks examines how sector concentration inside high-dividend funds creates implicit bets most investors do not anticipate before entering a position.
This article is for informational purposes only and should not be considered financial advice. Investors should conduct their own research and consult with financial professionals before making investment decisions. Past performance does not guarantee future results, and financial projections are subject to market conditions and various risk factors. Forward-looking views in this piece are speculative and subject to change based on market developments and company performance.