
Most investors treat a currency as a scorecard for its home economy. Strong jobs data, rising growth, a hawkish central bank, and the currency should climb. That logic works right up until the moment the US 10-year Treasury yield touches 5%, at which point the gravitational pull of the world’s benchmark bond starts bending everything around it.
That is exactly what is happening now. Any serious NZD/USD analysis in September 2026 has to start not in Wellington but in the US bond market, where surging yields, a strong dollar, and diverging central bank paths are dragging the New Zealand dollar toward the 0.5757 level even as domestic data cools sharply.
Here is what the data actually tells you about how global macro forces translate into currency price action, so you can read the broader forex market with far more clarity the next time a currency moves against its own economic news.
The mechanics of growth currencies and rising yields
The New Zealand dollar belongs to a family of currencies that behave less like national report cards and more like leveraged bets on global optimism. When the world feels confident and yields elsewhere are low, capital flows toward higher-returning, riskier assets. When yields rise and confidence fades, that same capital rushes home.
To understand why the Kiwi weakens when US yields climb, you need to see the three channels that transmit that pressure.
Carry trade mechanics operate the same way across all high-beta currency pairs: when rate differentials compress, speculative positions built on yield pickup unwind in a self-reinforcing move, and the Canadian dollar’s experience in September 2026 illustrates how quickly the calculus shifts when US yields surge.
- Shrinking carry differentials: Investors borrow in low-yielding currencies and park the money in higher-yielding ones, pocketing the gap. This is the carry trade. When US yields rise faster than New Zealand’s, the reward for holding the Kiwi shrinks, and the trade unwinds.
- Reduced risk appetite: The NZD is a high-beta currency, meaning it amplifies moves in global sentiment. When markets turn defensive, growth-sensitive currencies get sold first and hardest.
- Commodity-linked terms-of-trade exposure: The International Monetary Fund classifies the NZD, alongside the Australian and Canadian dollars, as a commodity currency. Its value is tightly bound to global growth expectations and the prices New Zealand earns for its exports.
The funding channel is where this gets concrete. New Zealand Treasury Working Paper WP 18/04 provides some of the clearest evidence: a 20 basis point rise in the US one-year rate is historically associated with a 14% jump in domestic funding spreads and a striking 59% rise in external funding spreads for New Zealand banks.
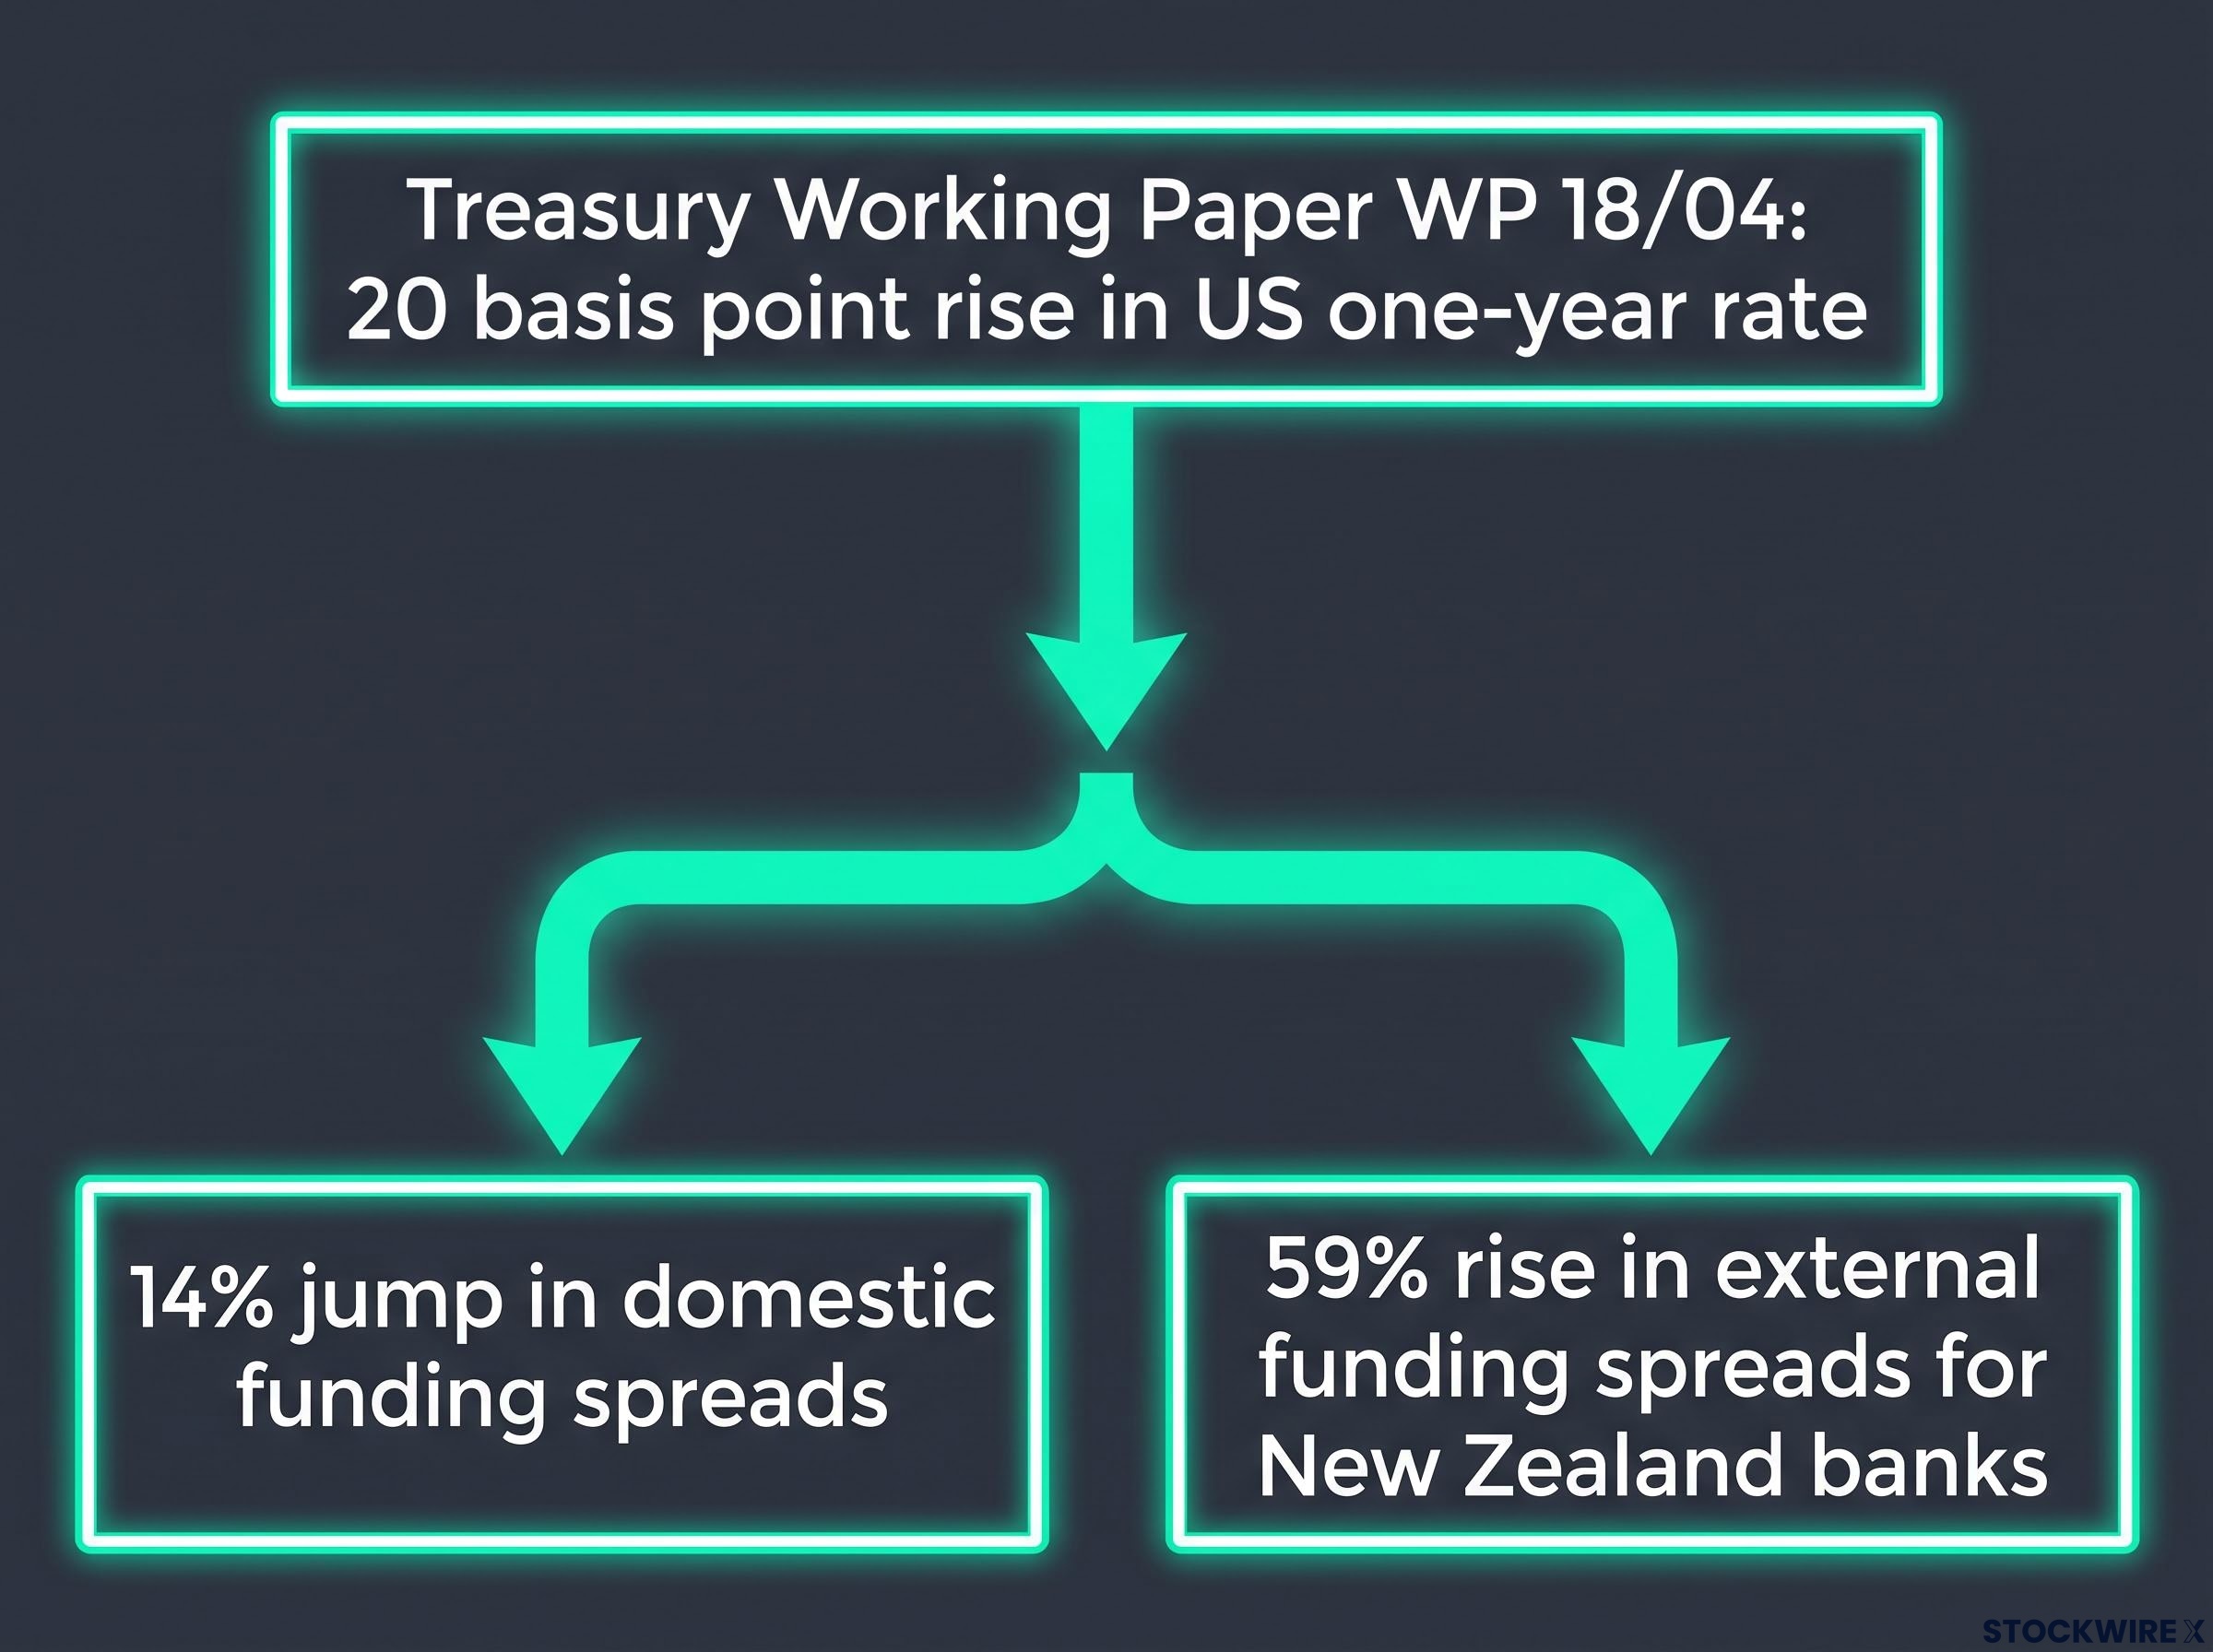
That is the mechanism in a single statistic. When the Federal Reserve tightens, it does not just move US rates; it raises the cost of US-dollar funding and hedging for smaller open economies, squeezing them from the outside.
The Treasury paper goes further, finding that the NZD experiences a persistent weakening after a US monetary tightening shock, consistent with well-documented deviations from interest-rate parity.
What this means for you is a shift in how you view the currency. The New Zealand dollar is not simply a mirror of its local economy. It is a high-beta proxy for global risk, which means your Kiwi positions are exposed first and foremost to what happens in the US bond market, not to the next Auckland housing print.
Grasp that, and you are no longer caught off guard when strong domestic news fails to lift the currency during a global risk-off episode. You will have been watching the right screen all along.
When big ASX news breaks, our subscribers know first
Diverging paths between US strength and domestic stagnation
Theory only matters when it collides with reality, and right now the collision is loud. On one side sits a US fixed-income market running hot. On the other sits a New Zealand economy losing momentum quarter by quarter. The gap between them is the fundamental engine driving the Kiwi lower.
Start with the US. The benchmark 10-year Treasury yield pushed above the 5% psychological threshold in mid-September 2026, reaching roughly 5.002% on 14 September, according to Reuters fixed-income coverage. A surge of more than 3% in oil prices reignited inflation worries and added fuel to the move. Markets were positioning for a further 25 basis point Fed rate increase, which would lift the target range to 3.75%-4.00%.
US Treasury yield dynamics at the 5% threshold are driven by four simultaneous forces — a hotter core CPI print amplified by an oil price surge, structural fiscal deficit anxiety, AI infrastructure spending uncertainty, and curve-wide selling across the 2-year, 10-year, and 30-year — each compounding the pressure on growth-sensitive currencies like the Kiwi.
Now turn to New Zealand, where the picture is far more sobering. Official Stats NZ data showed GDP rising just 0.8% year-on-year in the March 2026 quarter (Q1). The forward view is worse: the Q2 release was expected to confirm a sharp deceleration to around 0.1% quarter-on-quarter.
The Reserve Bank of New Zealand (RBNZ) has tried to defend the currency’s yield appeal. At its 8 July 2026 review, the Monetary Policy Committee reversed its earlier easing cycle and raised the Official Cash Rate from 2.25% to 2.50%, citing the goal of returning inflation to 2%.
The problem is arithmetic. A 2.50% policy rate simply cannot compete with US yields flirting with 5%. The hike was a step in the right direction, but it did nothing to close a gap that keeps widening.
| Metric | United States | New Zealand |
|---|---|---|
| Benchmark 10-year yield | ~5.002% (14 Sep 2026) | Well below US levels; spread narrowing against NZD |
| Central bank policy rate | 3.75%-4.00% target (anticipated) | 2.50% OCR (from 9 Jul 2026) |
| Recent GDP growth trend | Resilient, supporting elevated yields | 0.8% YoY (Q1 2026); ~0.1% QoQ forecast for Q2 |
Line the data up side by side and the capital flow becomes obvious. Institutional money moves toward the higher yield and the stronger growth story, and right now both sit firmly on the US side of the ledger. Reading these fundamentals directly lets you anticipate the macro shift rather than merely react to the price after it has already moved.
Translating macro weakness into technical price action
Macroeconomics can feel abstract until you watch it print on a chart. Every yield differential, every GDP miss, and every Fed expectation eventually shows up as a candle, a resistance line, or a stalled rally. The 4-hour NZD/USD chart in mid-September 2026 reads like a direct translation of the fundamental weakness discussed above.
Forex technical analysis is most powerful when treated as a conditional scenario framework rather than a prediction tool: the moving averages and RSI readings on the NZD/USD chart define trigger points to act on when price confirms a direction, not signals to trade ahead of confirmation.
As of 15 September 2026, the pair was trading near the 0.5757-0.5760 zone, hovering at the lower edge of its recent range after slipping around 0.33% on the session. The structure sits firmly below key moving averages, and those averages are doing the work of a ceiling.
Key resistance barriers and momentum signals
Moving averages smooth out price over a set number of periods to reveal the underlying trend. On this chart, they are stacked overhead as sellers’ territory.
- 20-period Simple Moving Average: capping upside near 0.5787, the first hurdle any rally must clear.
- 100-period Simple Moving Average: sitting around 0.5877, a heavier secondary barrier.
- Dense overhead supply zone: stretching from 0.5907 through to 0.5965, the region that would need to break to shift the broader bearish bias.
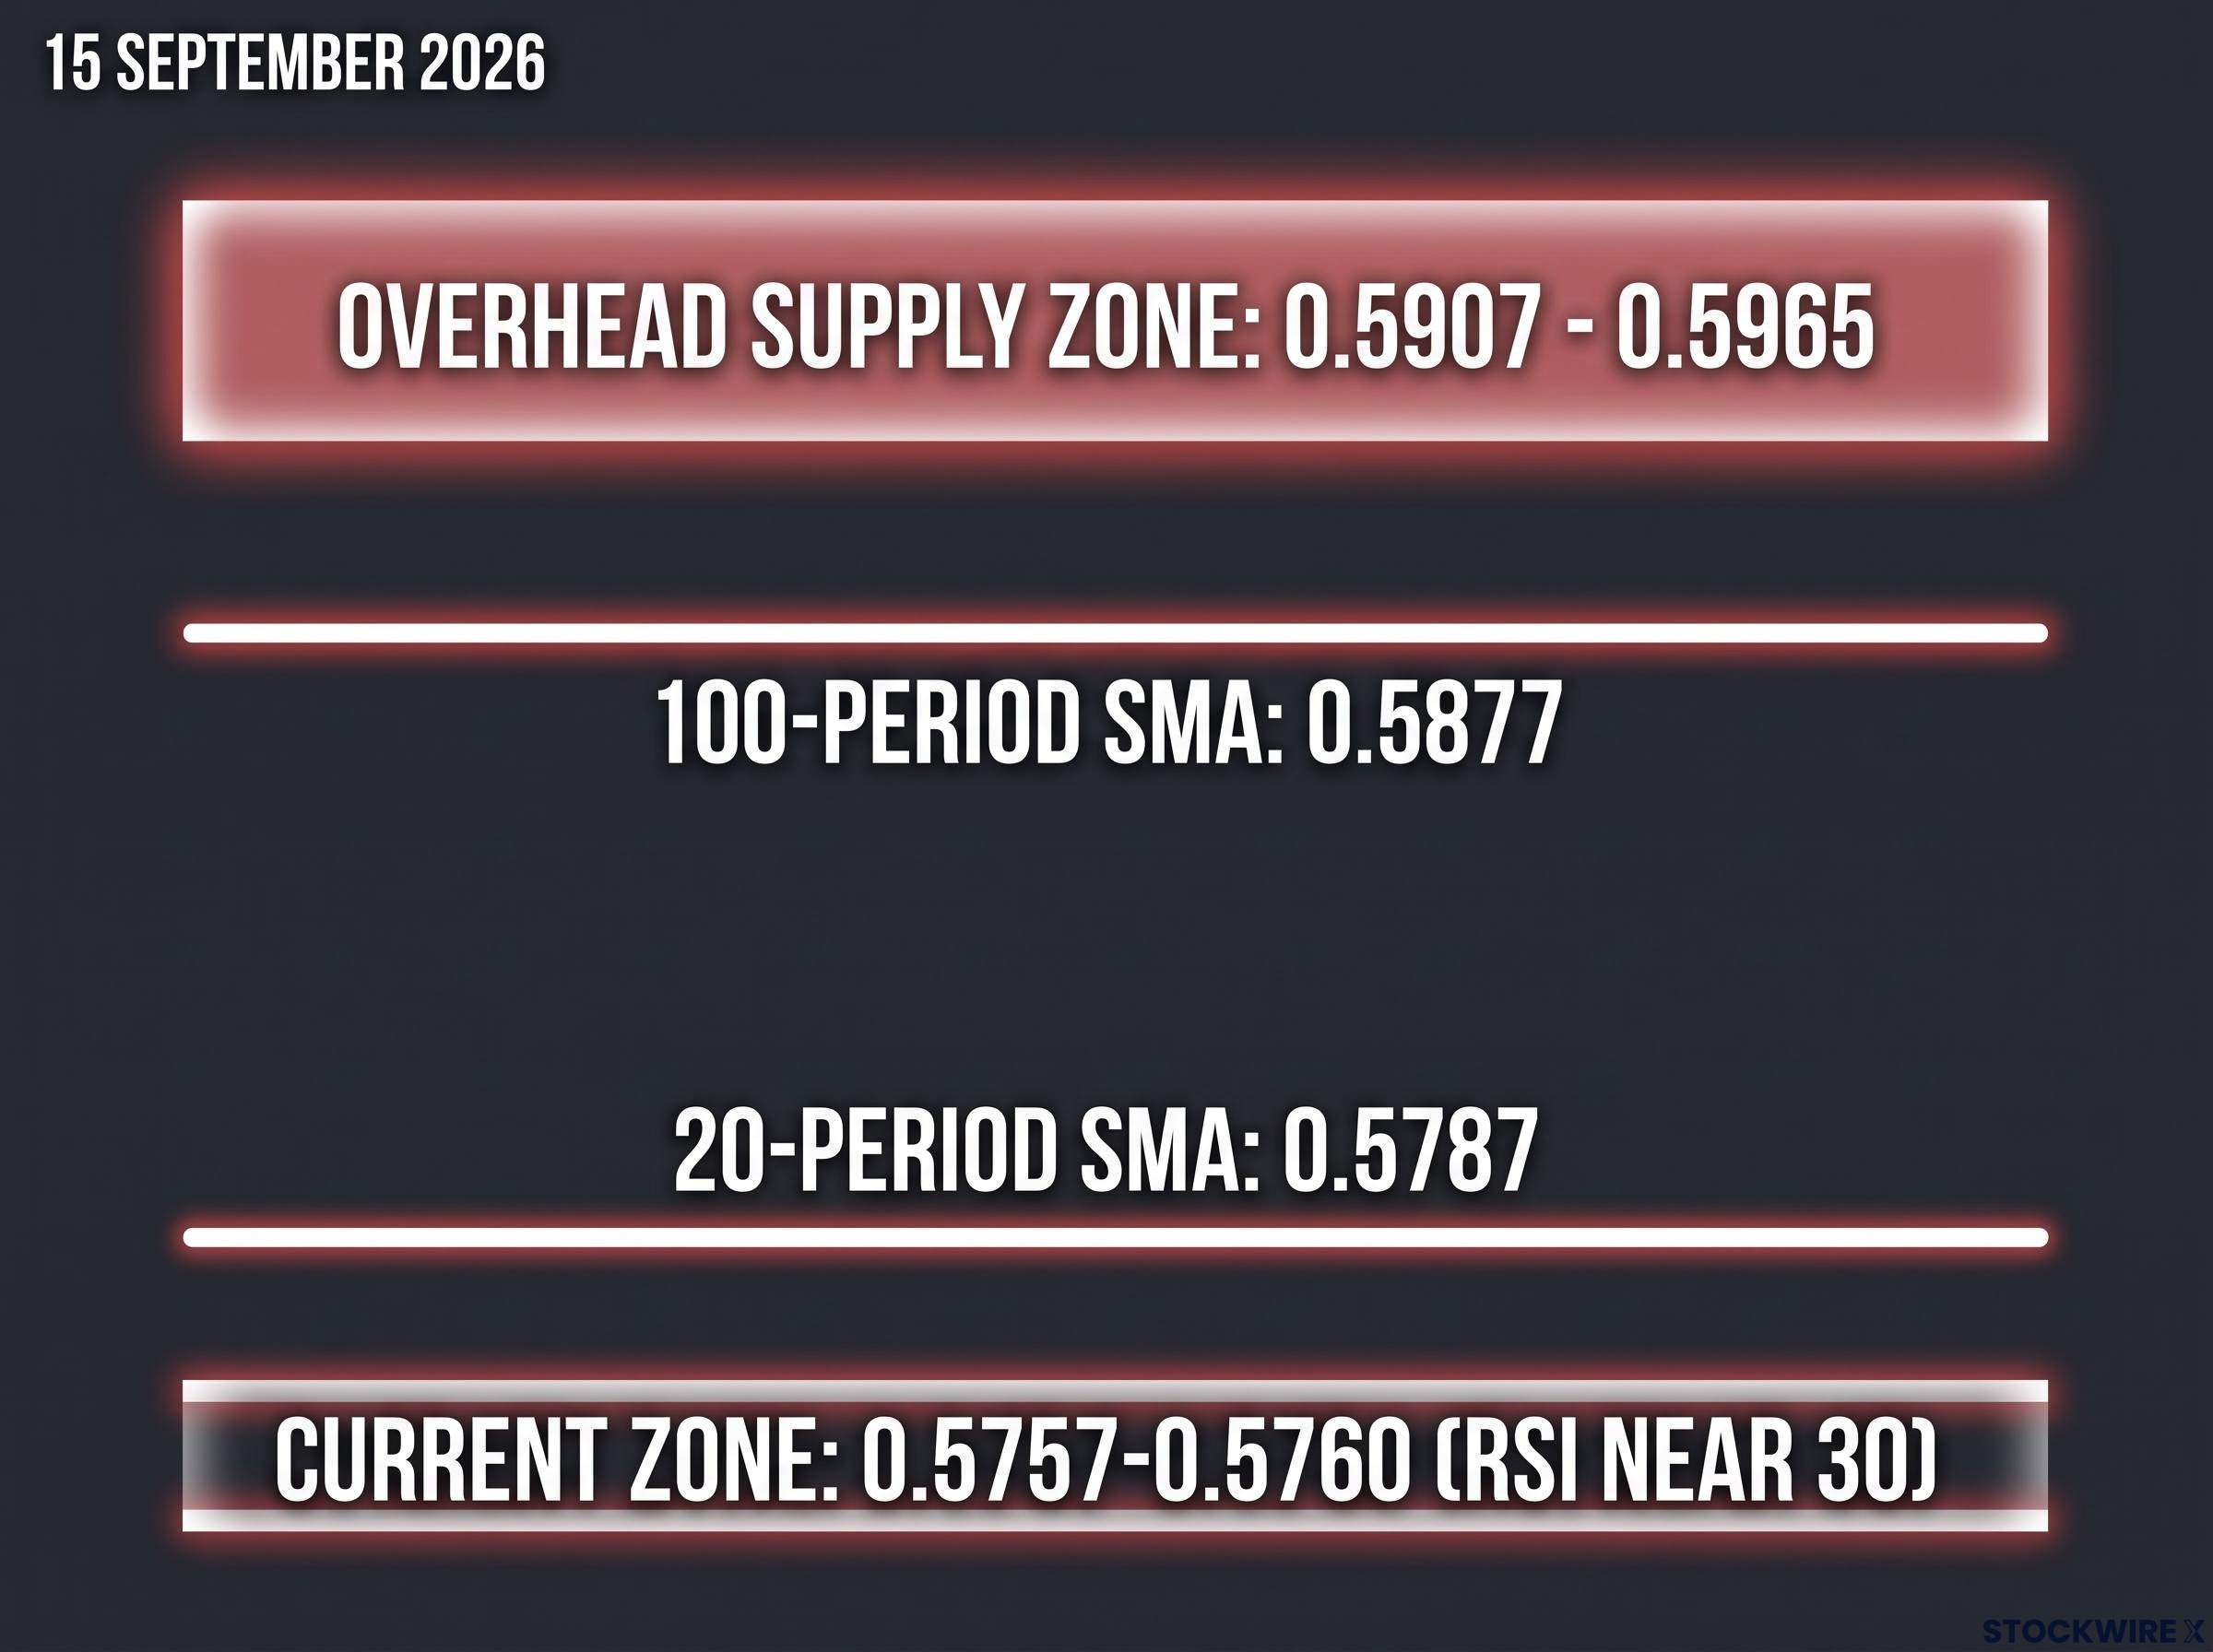
Momentum tells a similarly cautious story. The Relative Strength Index (RSI), a gauge of whether a market is overbought or oversold on a scale of 0 to 100, was hovering near 30.
A reading approaching 30 flirts with oversold territory, but here is the trap many retail traders fall into: oversold does not mean a bounce is coming. It signals persistent downward pressure, and in a strong trend a currency can sit near oversold for a long time while grinding lower.
You should treat these levels as a map of where other participants are likely to act. The moving averages near 0.5787 and 0.5877 mark where sellers have historically stepped back in, giving you concrete reference points to time an exit or fade a rally rather than trading on gut feel.
The hidden cost of a falling currency on domestic inflation
A weaker Kiwi is not just a line on a trader’s screen. It reaches into households and boardrooms across New Zealand through a channel called imported inflation, and understanding it completes the macro picture.
Imported inflation is straightforward: when the currency falls, everything New Zealand buys from overseas, from fuel to electronics to machinery, costs more in local dollars. Those higher costs feed through to shop prices and eat into household purchasing power and corporate margins alike.
The RBNZ has quantified the effect. Its analytical work on exchange-rate pass-through shows that a 1% depreciation in the trade-weighted NZD is associated with a rise of between 0.05% and 0.3% in long-run ex-fuel tradables inflation.
A 1% depreciation in the trade-weighted New Zealand dollar is associated with a long-run increase of roughly 0.05% to 0.3% in ex-fuel tradables inflation, according to RBNZ pass-through research, meaning currency weakness feeds directly into the prices consumers pay.
This is where the RBNZ gets boxed in. An April 2026 analysis of the NZD’s nominal effective exchange rate (NEER), its value against a basket of trading partners, noted that a falling exchange rate actively reduces the central bank’s flexibility.
The trap works like this. Growth is stalling, which normally argues for lower rates to support the economy. But a sinking currency imports fresh inflation, which argues for keeping rates higher. The bank cannot fully serve both mandates at once.
You need to see this feedback loop clearly. A persistently weak currency acts like a stealth tax on the whole economy, and it can force the central bank to hold borrowing costs higher for longer even as growth falters. That has direct consequences for anyone exposed to New Zealand rates, assets, or the currency itself.
Navigating the timeline for a potential Kiwi recovery
Pulling the threads together, the near-term case remains bearish: compressed rate differentials, a hawkish Fed, elevated US yields, and slowing domestic growth all point the same direction. Yet the weakness need not be permanent.
A structural reversal, according to bank research from ANZ and Westpac, hinges on three specific triggers:
- A US Federal Reserve pivot that pulls Treasury yields lower.
- A stabilisation in global risk sentiment that revives appetite for high-beta currencies.
- A genuine recovery in New Zealand domestic growth alongside a settled OCR.
On that basis, ANZ’s outlook has projected NZD/USD recovering toward 0.64 by end-2026, though it explicitly flags downside risk if US yields stay elevated or the RBNZ cuts more than expected.
The RBNZ rate path from 2.75% in September 2026 toward a projected terminal rate near 3.30% by early 2027 remains well below US yield levels, meaning even the full hiking sequence completing without interruption would leave the carry differential firmly in the dollar’s favour throughout the recovery window.
Your most useful leading indicator is not the next New Zealand GDP print. It is the direction of US Treasury yields. Watch them turn before you expect the Kiwi to.
This article is for informational purposes only and should not be considered financial advice. Investors should conduct their own research and consult with financial professionals before making investment decisions. Past performance does not guarantee future results, and financial projections are subject to market conditions and various risk factors. Forward-looking statements are speculative and subject to change based on market developments.