Goodman Group’s 18% Pullback: Decoding the Metrics That Matter
6 mins ago

Two separate valuation methods applied to Bendigo and Adelaide Bank (BEN) shares in May 2026 point to the same conclusion: the stock appears to be trading below its intrinsic value. The size of the gap, however, depends entirely on which assumptions an investor is willing to trust. With BEN priced at $10.48 and all four tracked sell-side analyst targets sitting above the current price (ranging from $11.00 to $13.50), the question is not whether a discount exists but whether the underlying methodology holds up under scrutiny. This analysis walks through two concrete valuation approaches, shows exactly what inputs produce which outputs, and flags where the methods converge and where they diverge, giving readers a grounded framework for forming their own view.
BEN shares traded at $10.48 in May 2026, with FY24 earnings per share of $0.87. Those two figures anchor every calculation that follows.
As a regional bank competing against the four majors, BEN operates with higher funding costs, a community-banking model, and a smaller cost base. That combination creates a persistent margin drag relative to Commonwealth Bank, Westpac, ANZ, and NAB, while also carving out a differentiated customer niche in regional and agribusiness lending.
What makes the current pricing interesting is the unanimity of the sell-side view. All four tracked analyst targets sit above the current share price:
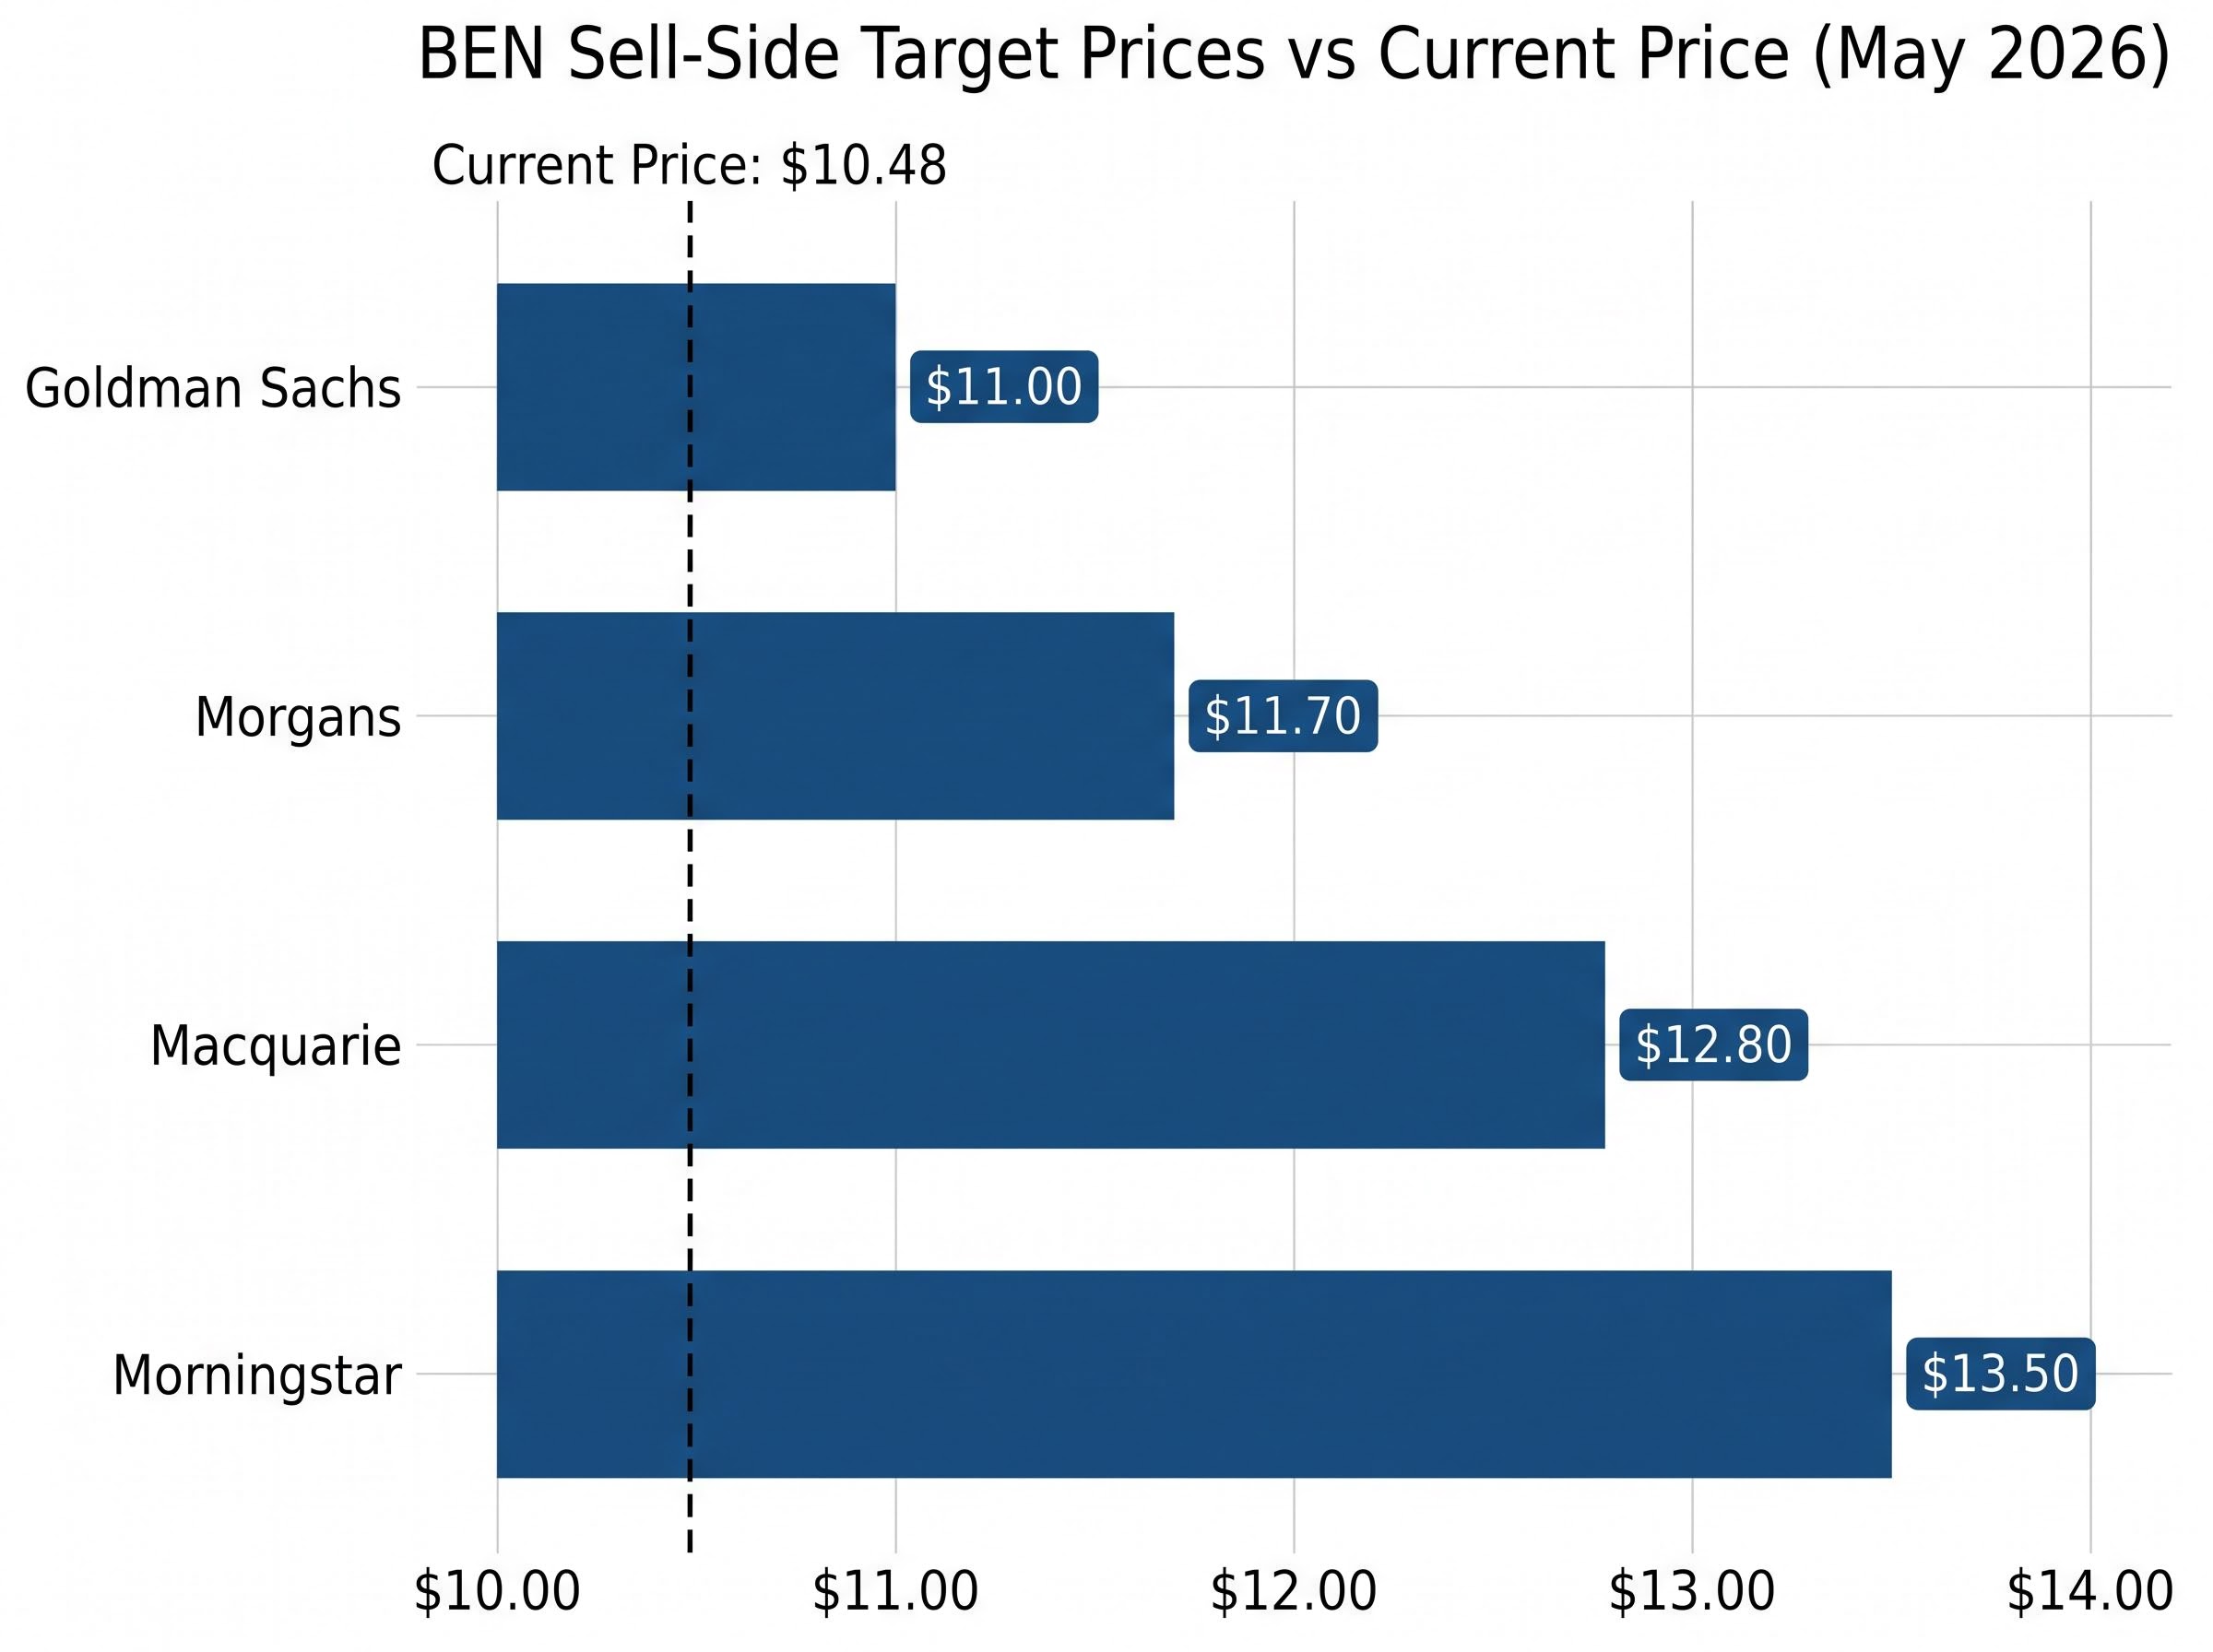
The spread between the lowest target ($11.00) and the highest ($13.50) is wide enough to matter. Understanding how those targets are constructed, and whether the assumptions behind them hold, is the purpose of the analysis that follows.
BEN‘s trailing PE ratio, derived from the $10.48 share price and $0.87 FY24 EPS, sits at approximately 12x. Yahoo Finance reported a trailing PE of 13.31x as at 8 May 2026, offering an alternative anchor depending on the earnings figure used.
The peer comparison, however, is where the arithmetic becomes instructive. CBA trades at approximately 20x forward earnings, a structural premium that reflects market dominance and a liquidity premium that no other Australian bank commands. Strip CBA out and the picture changes. ANZ and NAB both trade at approximately 13x forward earnings, with Westpac at approximately 14x.
Against that cluster, BEN‘s trailing PE is not dramatically discounted. It sits broadly in line with the mid-major group rather than at the deep discount some commentary implies.
The structural discount in BEN’s PE multiple reflects factors that a simple arithmetic comparison cannot capture: lower return on equity, regional loan book concentration, and ongoing technology investment each contribute to a multiple that the market appears to apply deliberately rather than overlook.
| Bank | Approximate PE | Implied position vs BEN |
|---|---|---|
| CBA | ~20x (forward) | Significant premium |
| Westpac | ~14x (forward) | Modest premium |
| ANZ | ~13x (forward) | Broadly in line |
| NAB | ~13x (forward) | Broadly in line |
| BEN | ~12-13x (trailing) | Baseline |
The simple average of the four major bank PEs comes to approximately 15x. Applying that to BEN‘s $0.87 EPS produces an implied valuation of approximately $13.05 per share. The frequently cited “sector average” of 18x, which appears in some commentary, is internally inconsistent with the individual bank figures above and inflates the implied valuation to $15.68, a figure that overstates the case.
Macquarie noted that BEN trades “on a PE discount of around 25% to majors,” a characterisation that holds against CBA but narrows considerably when measured against the ANZ/NAB/Westpac cluster.
The PE method’s output is therefore highly sensitive to which “sector average” an analyst selects. The defensible range runs from $13.05 (at 15x) to $15.68 (at 18x), and the honest read is that both boundaries matter.
The Dividend Discount Model (DDM) estimates the value of a share by treating it as a stream of future dividends, discounted back to today’s value. The formula is straightforward:
The formula: Share Value = Annual Dividend / (Required Return Rate minus Dividend Growth Rate).
What makes the DDM sensitive is the denominator. Small changes in either the required return or the growth rate produce large swings in the output. A 1% shift in either input can move the valuation by 20-30% or more.
The DDM works best where dividends are the primary return vehicle and where dividend policy is consistent and transparent. Banks fit that profile better than most sectors.
BEN pays fully franked dividends with a payout ratio guided at 60-75% of cash earnings. Morningstar expects “only modest growth in the dividend from FY26 onwards, broadly in line with EPS growth.” That stability and visibility make BEN a strong DDM candidate, in contrast to technology or mining stocks where retained earnings and reinvestment dominate and dividend streams are irregular.
The gross dividend, including franking credits, lifts BEN‘s $0.63 cash payment to an equivalent of approximately $0.93 per share for Australian taxpayers who can fully utilise franking credits. Whether to use the cash figure or the gross figure in the DDM depends on the investor’s own tax position, and it produces materially different outputs.
| Dividend input | Growth rate assumption | Required return rate | DDM valuation |
|---|---|---|---|
| $0.63 (FY24 cash) | 2-4% | 6-11% | $7.22 – $32.50 |
| $0.63 (blended mid-range) | Modest | Blended 6-11% | $13.32 |
| $0.65 (forecast adjusted) | Modest | Blended | $13.75 |
| $0.93 (gross, franking-inclusive) | Modest | Blended | $19.64 |
The full scenario range, from $7.22 (at an 11% required return and 2% growth) to $32.50 (at 6% required return and 4% growth), is wide. That width is not a flaw in the model. It is an honest reflection of the uncertainty embedded in forecasting dividends and discount rates years into the future.
The base case DDM output of $13.32, using blended mid-range assumptions and the $0.63 cash dividend, serves as the central reference point for this analysis.
The adjusted dividend scenario, using a $0.65 per share forecast figure, nudges the output to $13.75. Both sit comfortably above the current $10.48 price.
The franking-inclusive scenario at $19.64 is the outlier. It reflects total shareholder value for Australian taxpayers who can fully utilise franking credits, not a broader consensus view of intrinsic value. Investors should assess which dividend input matches their own tax circumstances before weighting this scenario.
The franking credit mechanics that underpin this calculation reflect corporate tax already paid at the company level, passed through to shareholders as a direct offset against personal tax liability; for SMSFs in pension phase or other zero-tax investors, the full credit becomes a refundable cash amount from the ATO, which is precisely why the gross dividend input produces such a materially different DDM output.
Where the scenarios cluster matters more than the extremes. Using mid-range assumptions, the DDM’s most defensible read on BEN‘s intrinsic value sits in the $13.00 to $14.00 range, a zone that overlaps with the PE method’s conservative output.
The convergence is clear. The PE method (at 15x peer average) implies a valuation of approximately $13.05. The DDM base case produces $13.32, and the adjusted dividend scenario reaches $13.75. Both methods, applied independently with different mechanics and different inputs, land in the $13.00 to $13.75 range.
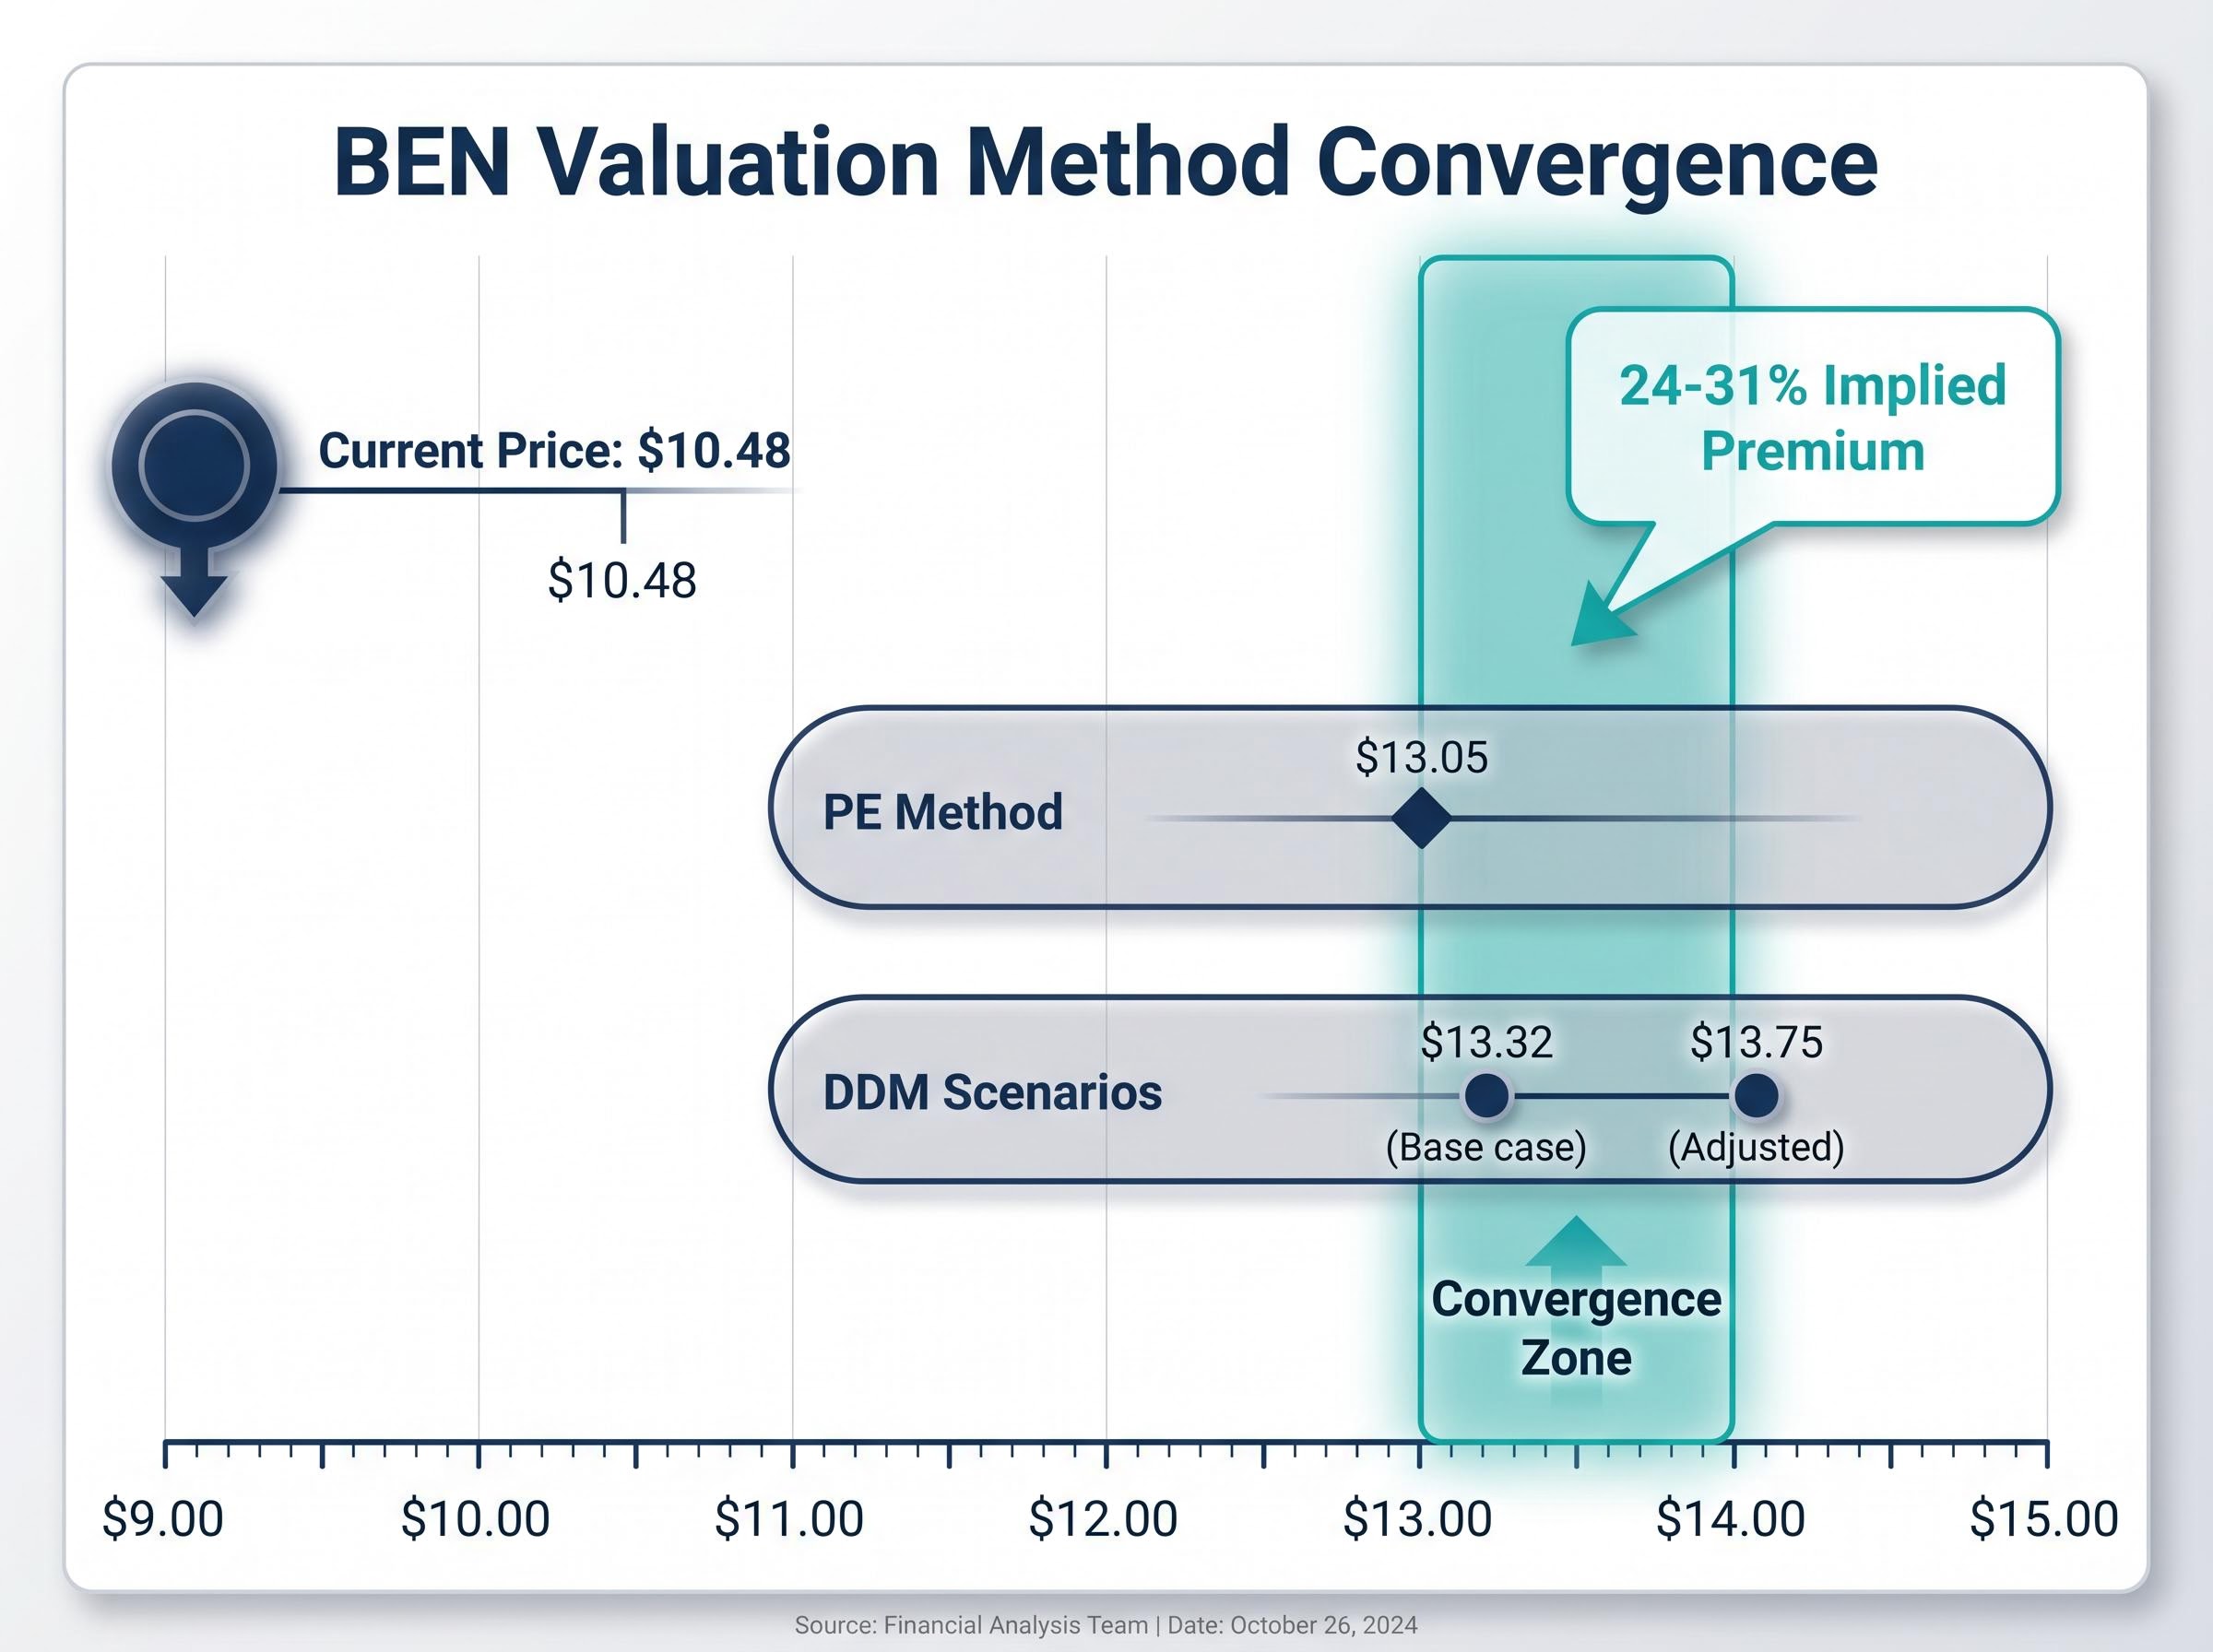
That overlap represents an implied premium of approximately 24-31% over the current $10.48 price. Morningstar’s $13.50 fair value estimate sits squarely inside this convergence zone, adding directional consistency.
The divergence sits at the upper end. The DDM’s franking-inclusive scenario ($19.64) sits well above anything the PE method produces. This reflects a more favourable assumption about total shareholder returns for Australian taxpayers who can use franking credits; it is not a broader consensus figure and should not be treated as one.
The PE method’s upper boundary ($15.68 at the 18x often-cited average) also diverges from the DDM base case, but for different reasons: it relies on a sector average figure that the individual bank PEs do not support.
Both PE and DDM are either backward-looking or assumption-heavy. Neither captures several qualitative factors that weigh on BEN‘s valuation discount:
BEN’s cost base restructuring through seven-year and six-year outsourcing deals with Infosys and Genpact targets $65-75 million in annualised savings by FY2028, a development that sits directly against the cost-to-income disadvantage the valuation models cannot automatically price in.
APRA’s quarterly ADI performance statistics for the December 2025 quarter provide sector-wide benchmarks on net interest margins, capital adequacy, and asset quality across Australian authorised deposit-taking institutions, giving investors a regulatory anchor for assessing how BEN’s reported metrics compare to the broader system.
Both Macquarie and Morgans frame BEN as a yield-and-value play rather than a growth stock. That framing implies patience is required before any valuation gap closes.
Investors should also compare BEN‘s risk-adjusted profile against a diversified, low-cost dividend ETF (such as Vanguard Australian Shares Index ETF, ASX: VAS) before concentrating capital in a single regional bank.
On both methods, BEN appears to be trading at a discount to a defensible central estimate of intrinsic value in the $13.00-$13.75 range. The implied upside of approximately 24-31% is meaningful, but the discount reflects real structural constraints, not only market mispricing.
The conditions under which the gap would narrow, hold, or widen break down as follows:
Within the broker range, Macquarie’s $12.80 target (Outperform, September 2025) represents the more constructive view, while Goldman Sachs’ $11.00 target (Neutral, January 2026) reflects a more cautious reading of margin dynamics.
At the current price, BEN‘s dividend yield sits at approximately 6.0% fully franked ($0.63 divided by $10.48), a figure Morningstar characterises as an “attractive fully franked yield in the mid-single digits” for income investors comfortable with regional-bank risk.
Past performance does not guarantee future results. Financial projections are subject to market conditions and various risk factors.
Two methodologically independent approaches produce overlapping intrinsic value estimates in the $13.00-$13.75 range, both meaningfully above $10.48. That convergence is the strongest signal this analysis produces.
The legitimate reasons for the discount, including structural NIM drag, below-system loan growth, and a cost base that cannot match the majors, are real constraints rather than temporary noise. These factors explain why the gap exists and why it may persist even if the valuation arithmetic is sound.
Investors considering BEN should verify the most recent dividend and EPS figures via the bank’s ASX announcements page as full-year FY25 numbers become available, and stress-test the DDM assumptions against their own required return expectations before treating any estimate as a target.
For investors wanting to extend the analysis beyond PE and DDM, our comprehensive walkthrough of ASX bank valuation methods covers price-to-book ratios, discounted cash flow approaches, and the qualitative checklist across management track record, loan book quality, and APRA capital adequacy that should precede any investment conclusion regardless of what the quantitative models produce.
This article is for informational purposes only and should not be considered financial advice. Investors should conduct their own research and consult with financial professionals before making investment decisions.
The Dividend Discount Model (DDM) values a share by discounting its future dividend stream back to a present value, using the formula: Share Value = Annual Dividend divided by (Required Return Rate minus Dividend Growth Rate). For BEN, using the FY24 cash dividend of $0.63 and blended mid-range assumptions, the DDM produces a base case valuation of approximately $13.32 per share.
BEN trades at approximately 12-13x trailing earnings, broadly in line with ANZ and NAB (both around 13x forward earnings) and slightly below Westpac (around 14x), while sitting at a significant discount to CBA which trades at approximately 20x forward earnings due to its structural market dominance premium.
All four tracked analysts have target prices above BEN's current price of $10.48: Morningstar has a fair value estimate of $13.50, Macquarie has an Outperform rating with a $12.80 target, Morgans has an Add rating with an $11.70 target, and Goldman Sachs has a Neutral rating with an $11.00 target.
BEN pays fully franked dividends, which means the $0.63 cash dividend lifts to an equivalent of approximately $0.93 per share for Australian taxpayers who can fully utilise franking credits; when this gross figure is used in the DDM, the implied valuation rises to $19.64, though this figure reflects a tax-specific benefit and is not a broad consensus intrinsic value estimate.
The main risks include net interest margin deteriorating more sharply than the current 'manageable' outlook implies, mortgage competition forcing further margin concessions, and below-system loan growth persisting, any of which could make the current PE multiple appropriate rather than discounted relative to peers.