
Gold dropped to an intraday weekly low of $4,530 on 28 August 2026, after Kevin Warsh’s hawkish commentary at the Jackson Hole Economic Policy Symposium sent the US Dollar and Treasury yields sharply higher. The selloff punched through the psychologically significant $4,600 level and kept falling until price brushed the 200-day Simple Moving Average (SMA) near $4,527, a threshold that systematic and discretionary traders treat as the boundary between a tested uptrend and a potential trend reversal.
Gold partially recovered above $4,550 before the session closed, but the battle is unresolved. Price remains below $4,600, and a single intraday bounce does not constitute a confirmed defence of long-term support.
Here is what the technicals and the fundamental backdrop tell you about where Gold goes from here, what each support and resistance level actually means, and how to read this inflection point based on whether you are trading the next session, the next month, or the next year.
Gold’s intraday collapse and where price actually landed
The sequence matters. Kevin Warsh delivered hawkish commentary during the Jackson Hole symposium (which ran 27-29 August 2026), and the reaction was immediate: the US Dollar strengthened, Treasury yields spiked, and the transmission mechanism hit Gold within hours. The precious metal, which is priced in dollars and pays no yield, absorbed the full force of both moves simultaneously.
Warsh’s Jackson Hole address on 27 August contained no new data or numerical rate projections, yet the rate market repricing was immediate and substantial, with CME-linked September hike odds jumping roughly 20 percentage points overnight as tone alone proved sufficient to move positioning across asset classes.
- Intraday weekly low: $4,530 (source: FXStreet, Christian Borjon Valencia)
- Current session price: $4,576
- 200-day SMA: approximately $4,527
- Daily decline: more than 0.42%
Price broke below $4,600 early in the session and accelerated lower, establishing the weekly low at $4,530 before dip-buyers stepped in and pushed Gold back above $4,550.
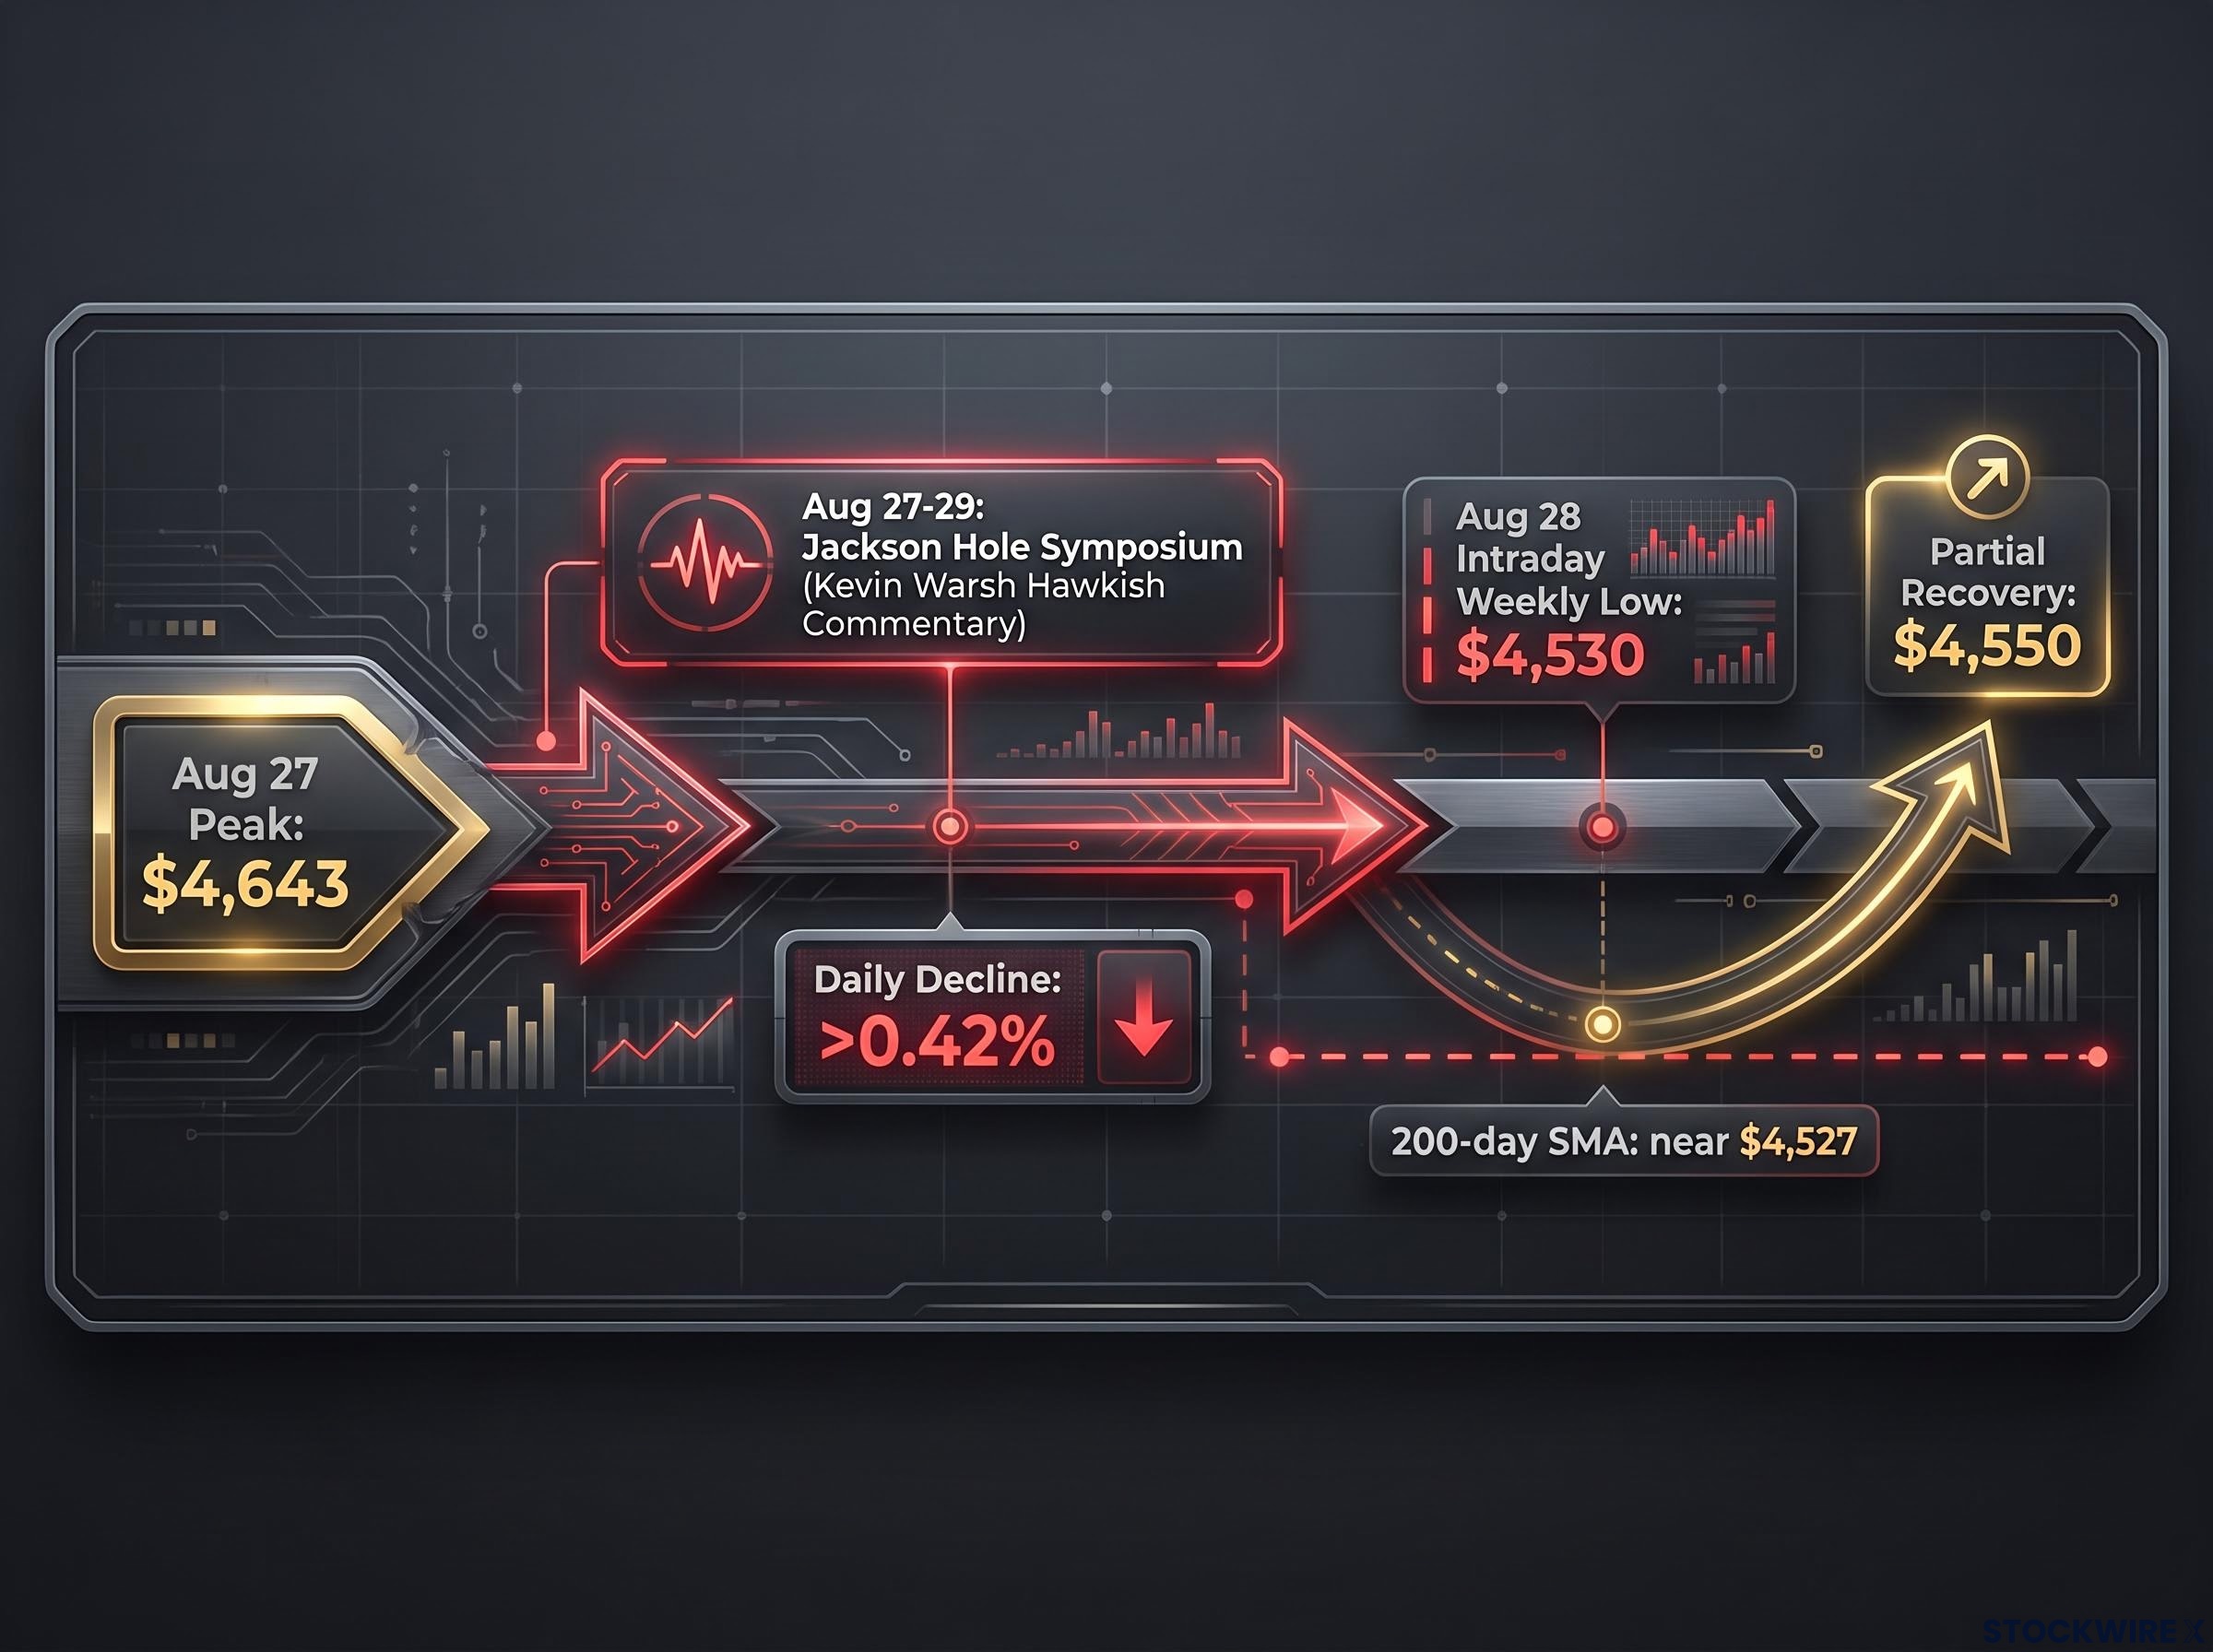
According to FXStreet analysis by Christian Borjon Valencia, XAU/USD established an intraday weekly low at $4,530 on 28 August 2026, placing price within three dollars of the 200-day SMA at approximately $4,527.
The partial recovery is a data point, not a resolution. Dip-buyers are present, and they showed up at a level that matters. But Gold closed below $4,600, and a single intraday bounce off a moving average does not confirm that the floor will hold. What it tells you is that the support zone is being contested rather than conceded, which means the next few sessions carry outsized importance for anyone with an active Gold position.
When big ASX news breaks, our subscribers know first
The technical map: support zones, resistance ceilings, and what each level means
Reading a single price level in isolation gives you a line on a chart. Reading the full support and resistance structure gives you the range of outcomes and the specific thresholds where the thesis changes. This section builds that map from the deepest plausible downside up to resistance, so you can locate exactly where you are and what each directional move would signal.
Support levels: where buyers are likely to defend
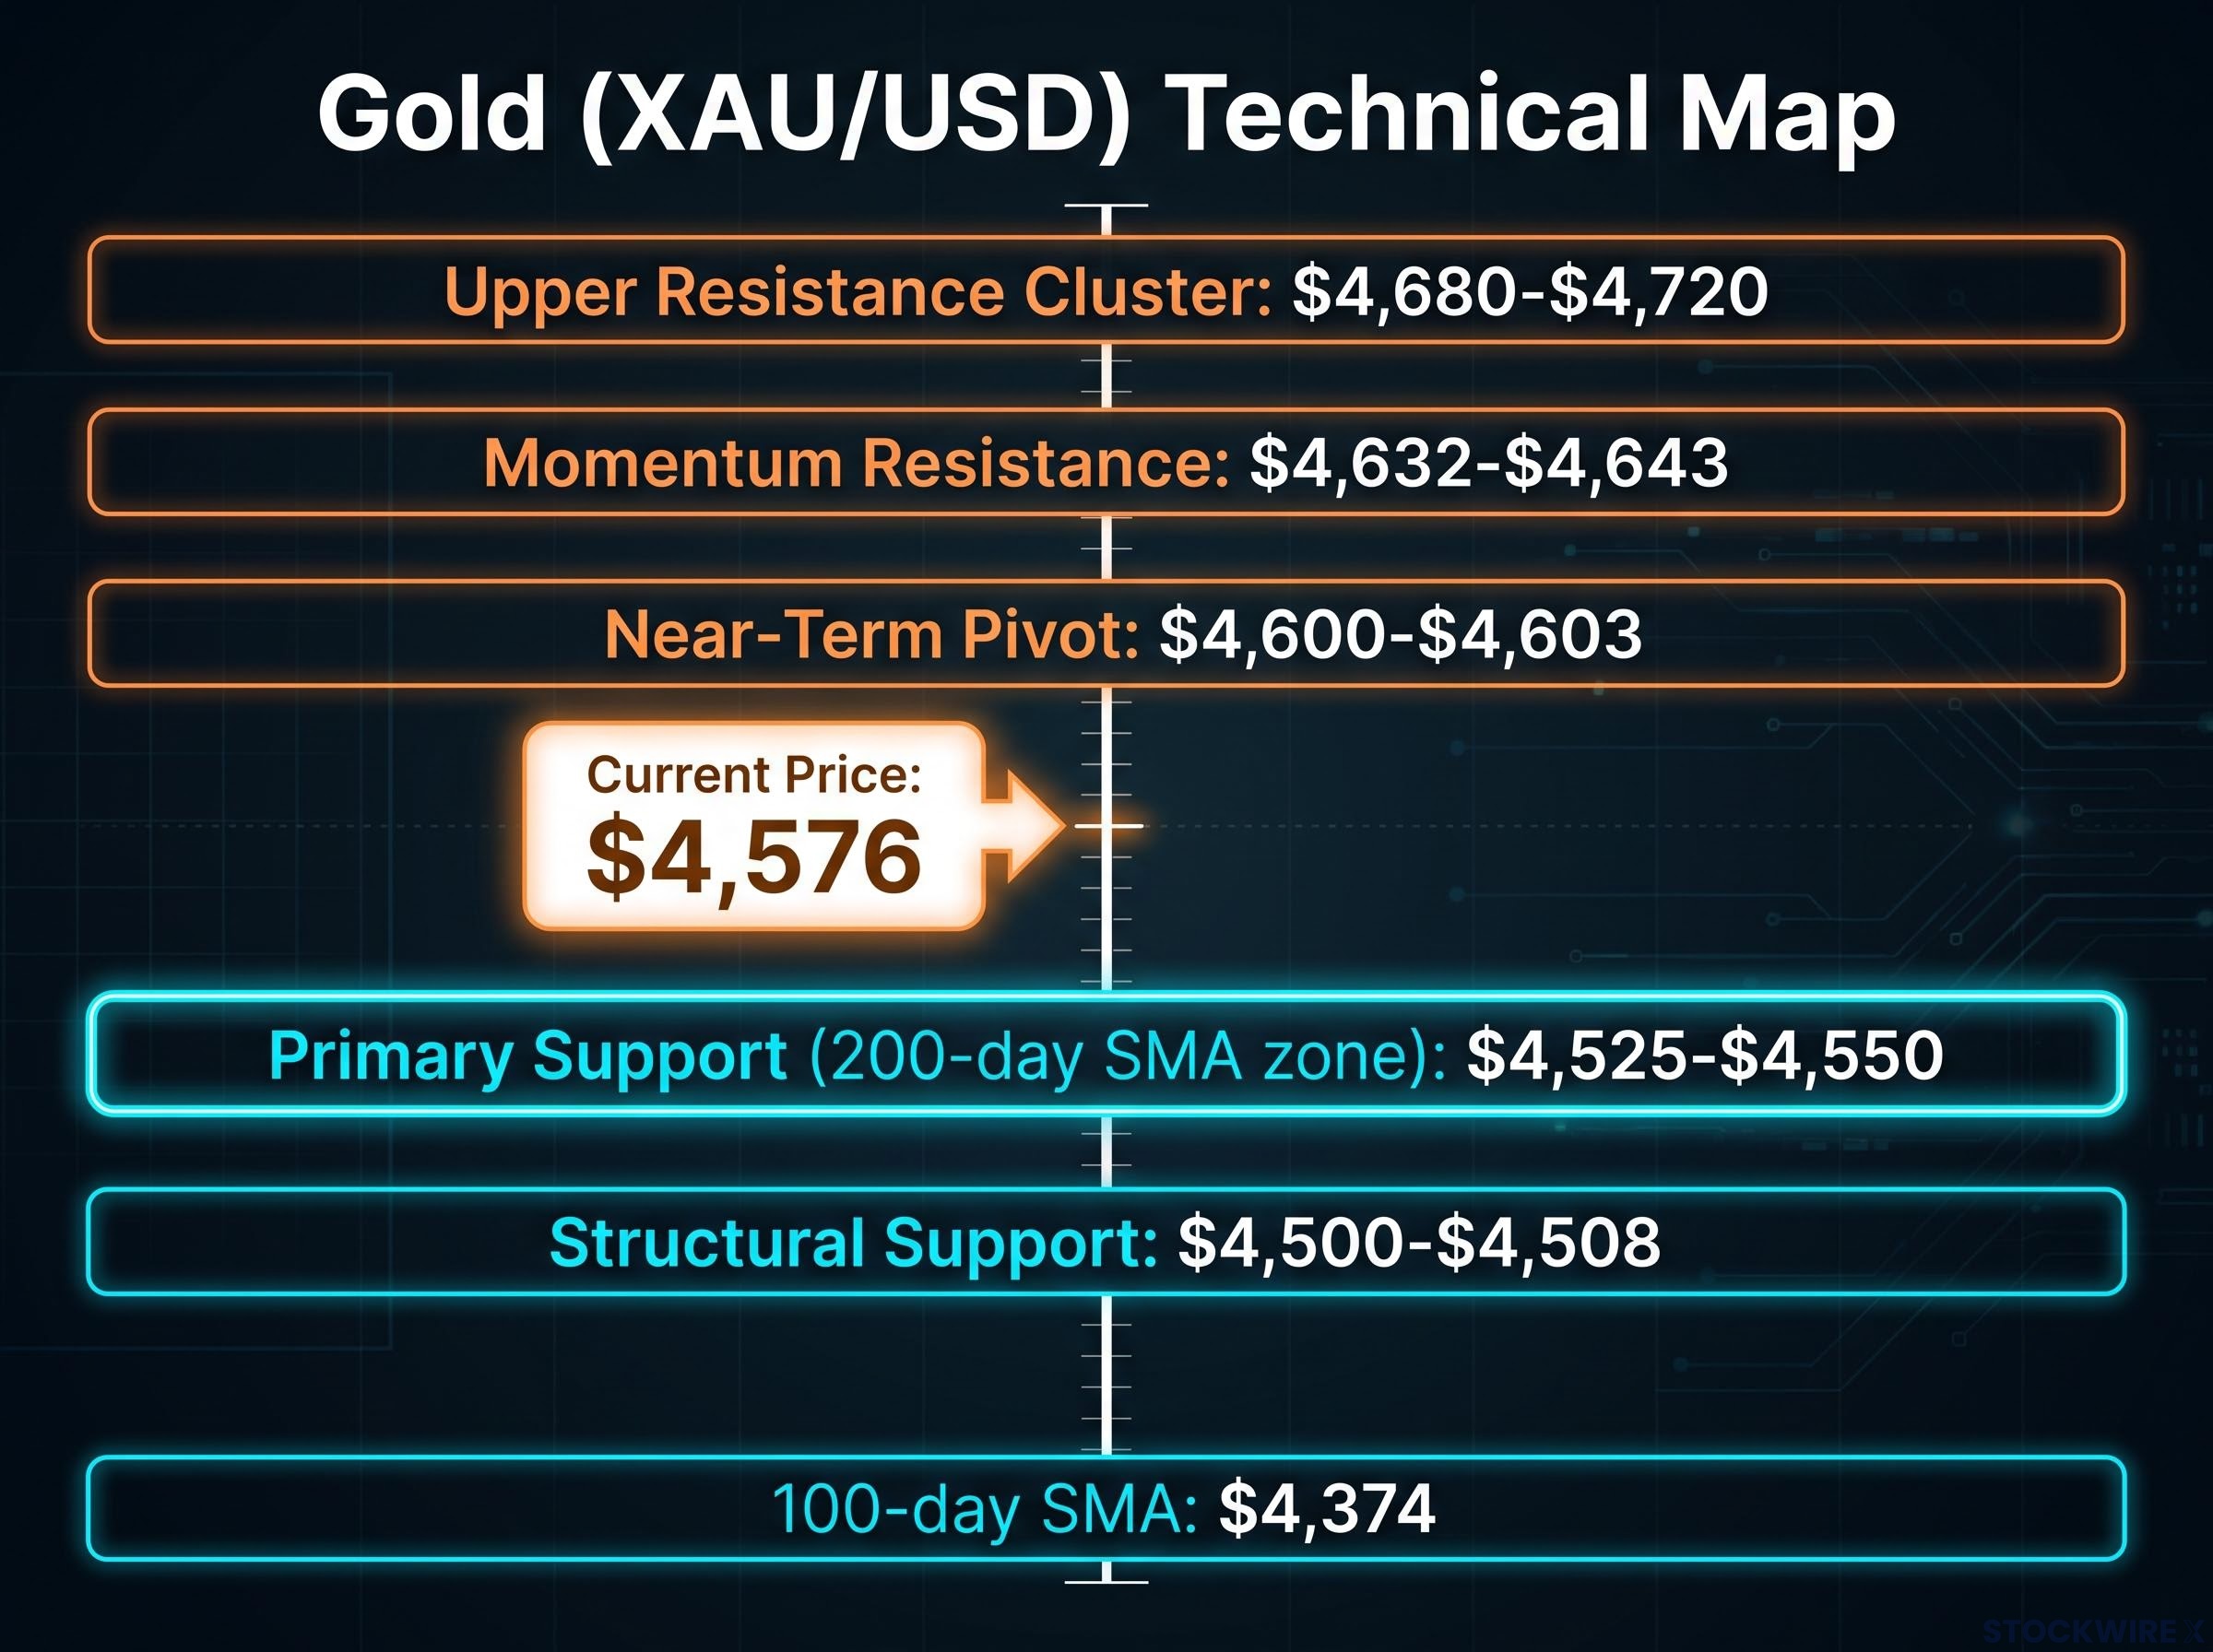
The primary support band sits at $4,550-$4,525. Multiple independent technical sources converge on this zone, combining Fibonacci retracement levels, prior breakout structure, and the 200-day SMA near $4,527. That convergence matters: when several unrelated methodologies point to the same price area, it adds analytical weight and suggests institutional reference points cluster there.
Below that, $4,508-$4,500 represents a structural order block and lower channel boundary. A break through this level would signal that dip-buyers are losing control and would invite trend-following selling into the gap below.
If both bands fail, downside extension targets sit at $4,450-$4,432, with the 100-day SMA near $4,374 as the next major moving average support. That would represent a correction of roughly 3-7% from current levels.
Resistance levels: what Gold must reclaim to restore bullish momentum
On the upside, $4,600-$4,603 is the minimum requirement for bulls, not a ceiling to celebrate. The weekly pivot sits near $4,603, and regaining this area on a daily close would be the first sign that the selloff is being absorbed rather than extended.
Above that, $4,632-$4,643 is the level that would shift sentiment from “dip absorbed” to “momentum restored.” FXStreet identifies the 27 August daily peak at $4,643, while broader weekly resistance matrices place this threshold at approximately $4,632.
The higher resistance cluster at $4,680-$4,720 represents intermediate supply and a major upside projection zone. Clearing these layers would re-establish the bullish trend and open the path toward new cycle highs.
| Level | Price Zone | What It Means |
|---|---|---|
| 200-day SMA zone | $4,525-$4,550 | Primary support. Holding here keeps the long-term uptrend intact; a confirmed close below shifts the framework to defensive |
| Structural support | $4,500-$4,508 | Order block floor. A break here means dip-buyers have lost control and deeper downside targets activate |
| Near-term pivot | $4,600-$4,603 | Minimum bull requirement. A daily close above signals the selloff was absorbed, not extended |
| Momentum resistance | $4,632-$4,643 | Sentiment shift level. A push through here confirms short-term bullish momentum is restored |
| Upper resistance cluster | $4,680-$4,720 | Upside projection zone. Clearing this re-establishes the broader bullish trend and targets new cycle highs |
The gap between the nearest support ($4,525-$4,550) and the nearest meaningful resistance ($4,600-$4,603) defines your risk-reward equation right now. If you are considering a long position, this is the space in which you are operating, and the asymmetry only becomes attractive if stops are placed with discipline below $4,500.
Why Gold dropped: the macro forces behind the technical move
The chart tells you where Gold is. The fundamental backdrop tells you why it got there, and what would need to reverse for technical support to hold. This section breaks down the specific forces that drove the 28 August selloff.
- Dollar correlation: Gold carries an inverse relationship with the US Dollar. When the Dollar strengthens, Gold weakens. Warsh’s hawkish commentary drove the Dollar higher, and Gold absorbed the pressure directly.
- Interest rate sensitivity: Gold is a non-yielding asset, which means it pays no income. Higher interest rates raise the opportunity cost of holding it, because investors can earn yield elsewhere with less volatility. That dynamic suppresses Gold prices when rate-cut expectations fade.
- Central bank demand: Sovereign buyers provide a structural floor beneath Gold that separates cyclical corrections from structural breakdowns.
- Safe-haven role: Geopolitical instability and recession fears tend to accelerate Gold demand, while equity rallies tend to suppress it.
Central bank accumulation provides the structural floor beneath Gold that separates cyclical corrections from regime breakdowns, with sovereign institutions citing counterparty-risk elimination, sanctions resilience, and inflation hedging as primary drivers rather than short-term price speculation, meaning their demand curve behaves differently from momentum-driven institutional or retail flows.
The transmission mechanism on 28 August was direct: Warsh’s hawkish commentary at Jackson Hole pushed the Dollar and Treasury yields higher simultaneously, and Gold, which moves inversely to both, fell in response.
World Gold Council data shows that sovereign institutions purchased 1,136 tonnes of Gold, worth approximately $70 billion, across 2022, a total that represented the largest single-year reserve build on record. China, India, and Turkey were among the most active accumulating nations.
That structural demand figure matters for how you interpret this correction. Even in a selloff driven by hawkish macro forces, there is a buyer of size with a multi-decade time horizon in this market. Central bank accumulation does not prevent short-term drawdowns, but it changes the probability distribution: a sustained breakdown below long-term support is less likely when sovereign institutions are systematically adding to reserves at lower prices.
This article is for informational purposes only and should not be considered financial advice. Investors should conduct their own research and consult with financial professionals before making investment decisions.
Buying opportunity or early warning? How to read this for your time horizon
The case for buying the dip, and the case for staying cautious
The bull case rests on specific technical evidence. Price remains above the 50-day Exponential Moving Average (EMA), a shorter-term trend indicator that tracks recent price momentum. The rising trend line on the daily chart is intact. There has been no confirmed daily close below the 200-day SMA at $4,527. And the support consensus at $4,550-$4,525, drawn from multiple independent technical methodologies, suggests institutional dip-buying interest is concentrated in this zone.
The bear case draws from the same chart. The Relative Strength Index (RSI), a momentum gauge that measures the speed and magnitude of recent price changes, sits above 50 but is trending lower. Near-term price action is framed inside a downtrend channel. And if the $4,525-$4,550 support band fails, the next meaningful floors sit at $4,450, $4,374 (the 100-day SMA), and $4,320 in a more severe scenario.
Neither case is wrong. Both are reading the same evidence through different time lenses.
The market is in an inflection zone. There is enough evidence to justify selective dip-buying near major support, but not enough to dismiss the risk of a further 3-7% drawdown if that support fails.
What each type of investor should actually do
The split between the bull and bear cases is not ambiguity to be frustrated by. It is the market telling you that position sizing and stop placement matter more right now than directional conviction. The appropriate response is disciplined risk management, not a binary all-in or all-out decision.
- Short-term traders: The $4,550-$4,525 band is your primary buy zone, with stops placed below $4,500-$4,508. The confirmation signal before sizing up is a reclaim of $4,600-$4,603 followed by a push through $4,632-$4,643. Without that confirmation, any long position is a speculative bet on support holding, not a confirmed trend trade.
- Swing and medium-term investors: A clean daily close below the 200-day SMA (near $4,527) is your reassessment trigger. If price holds above this zone and the RSI stabilises or turns higher, staggered entries become reasonable. Your mental line in the sand sits at $4,500-$4,508.
- Long-term allocators: The current move appears, so far, as a test of long-term support within an established uptrend, not a structural breakdown. Using weakness toward the mid-$4,500s as a rebalancing opportunity is reasonable, but only if you are prepared to tolerate potential follow-through toward the mid-$4,400s or the 100-day SMA near $4,374 should support temporarily fail.
Sovereign debt dynamics have reinforced the structural Gold thesis by eroding the diversification value of government bonds, with institutions including BlackRock, JPMorgan, and Swiss pension funds shifting allocations toward Gold to fill the hedging role that bonds historically provided but no longer reliably deliver during simultaneous equity and rate stress events.
Past performance does not guarantee future results. Financial projections are subject to market conditions and various risk factors.
The signals that will resolve this inflection point
Five signals, ranked by importance, will tell you over the coming sessions whether the $4,525-$4,550 support thesis is strengthening or deteriorating:
- Daily close versus the 200-day SMA band (near $4,527, broader zone mid-$4,500s). This is the primary signal. Holding above it keeps the long-term bull case intact. A confirmed close below would represent a regime shift in most technical models.
- Behaviour around $4,600-$4,603. Sustained trade above this pivot would indicate that the Jackson Hole selloff was a buyable dip, not the start of a trend reversal.
- Follow-through at $4,632-$4,643 and $4,680-$4,720. Clearing these resistance layers would re-establish upside momentum and open the path toward new cycle highs.
- RSI and momentum oscillators. Stabilisation or an upturn from current levels would support the thesis that downside pressure is exhausting. Continued deterioration would favour patience before adding to long positions.
- US Dollar and Treasury yield direction. Given Gold’s inverse relationship with the Dollar, any reversal in Dollar or yield strength would provide a macro tailwind for a technical bounce off the support zone.
The signal to shift into full defensive mode is a confirmed break and close below the $4,550-$4,525 band, especially if accompanied by failure to reclaim $4,600 and renewed strength in the Dollar and yields. That combination would open the path toward $4,450, potentially $4,374 (100-day SMA), and in a more severe scenario, $4,320.
Each session close now either strengthens or weakens the support thesis in a measurable, specific way. That means you can update your view with evidence rather than noise, which is the difference between a watching brief and passive observation.
What the next few sessions will actually tell you
Gold is technically tested but not broken. The 200-day SMA near $4,527 held on an intraday basis, structural demand from central bank accumulation provides a fundamental floor beneath the cyclical correction, and the evidence justifies cautious positioning rather than confident directional conviction in either direction.
The single most important variable to watch is the daily close relative to that 200-day SMA. Everything else, the RSI trajectory, the Dollar and yield direction, the behaviour around $4,600, feeds into or confirms what that daily close tells you.
The analysis has mapped the territory. The support and resistance levels are specific and observable. The monitoring signals are ranked and actionable. The next move belongs to the market, and the next decision belongs to you.
For investors wanting to apply the same SMA, RSI, and support-resistance mapping methodology shown here to other currency and commodity pairs, our full explainer on technical analysis frameworks walks through the five-step conditional process with a live USD/MXN case study that any trader can replicate on any instrument.