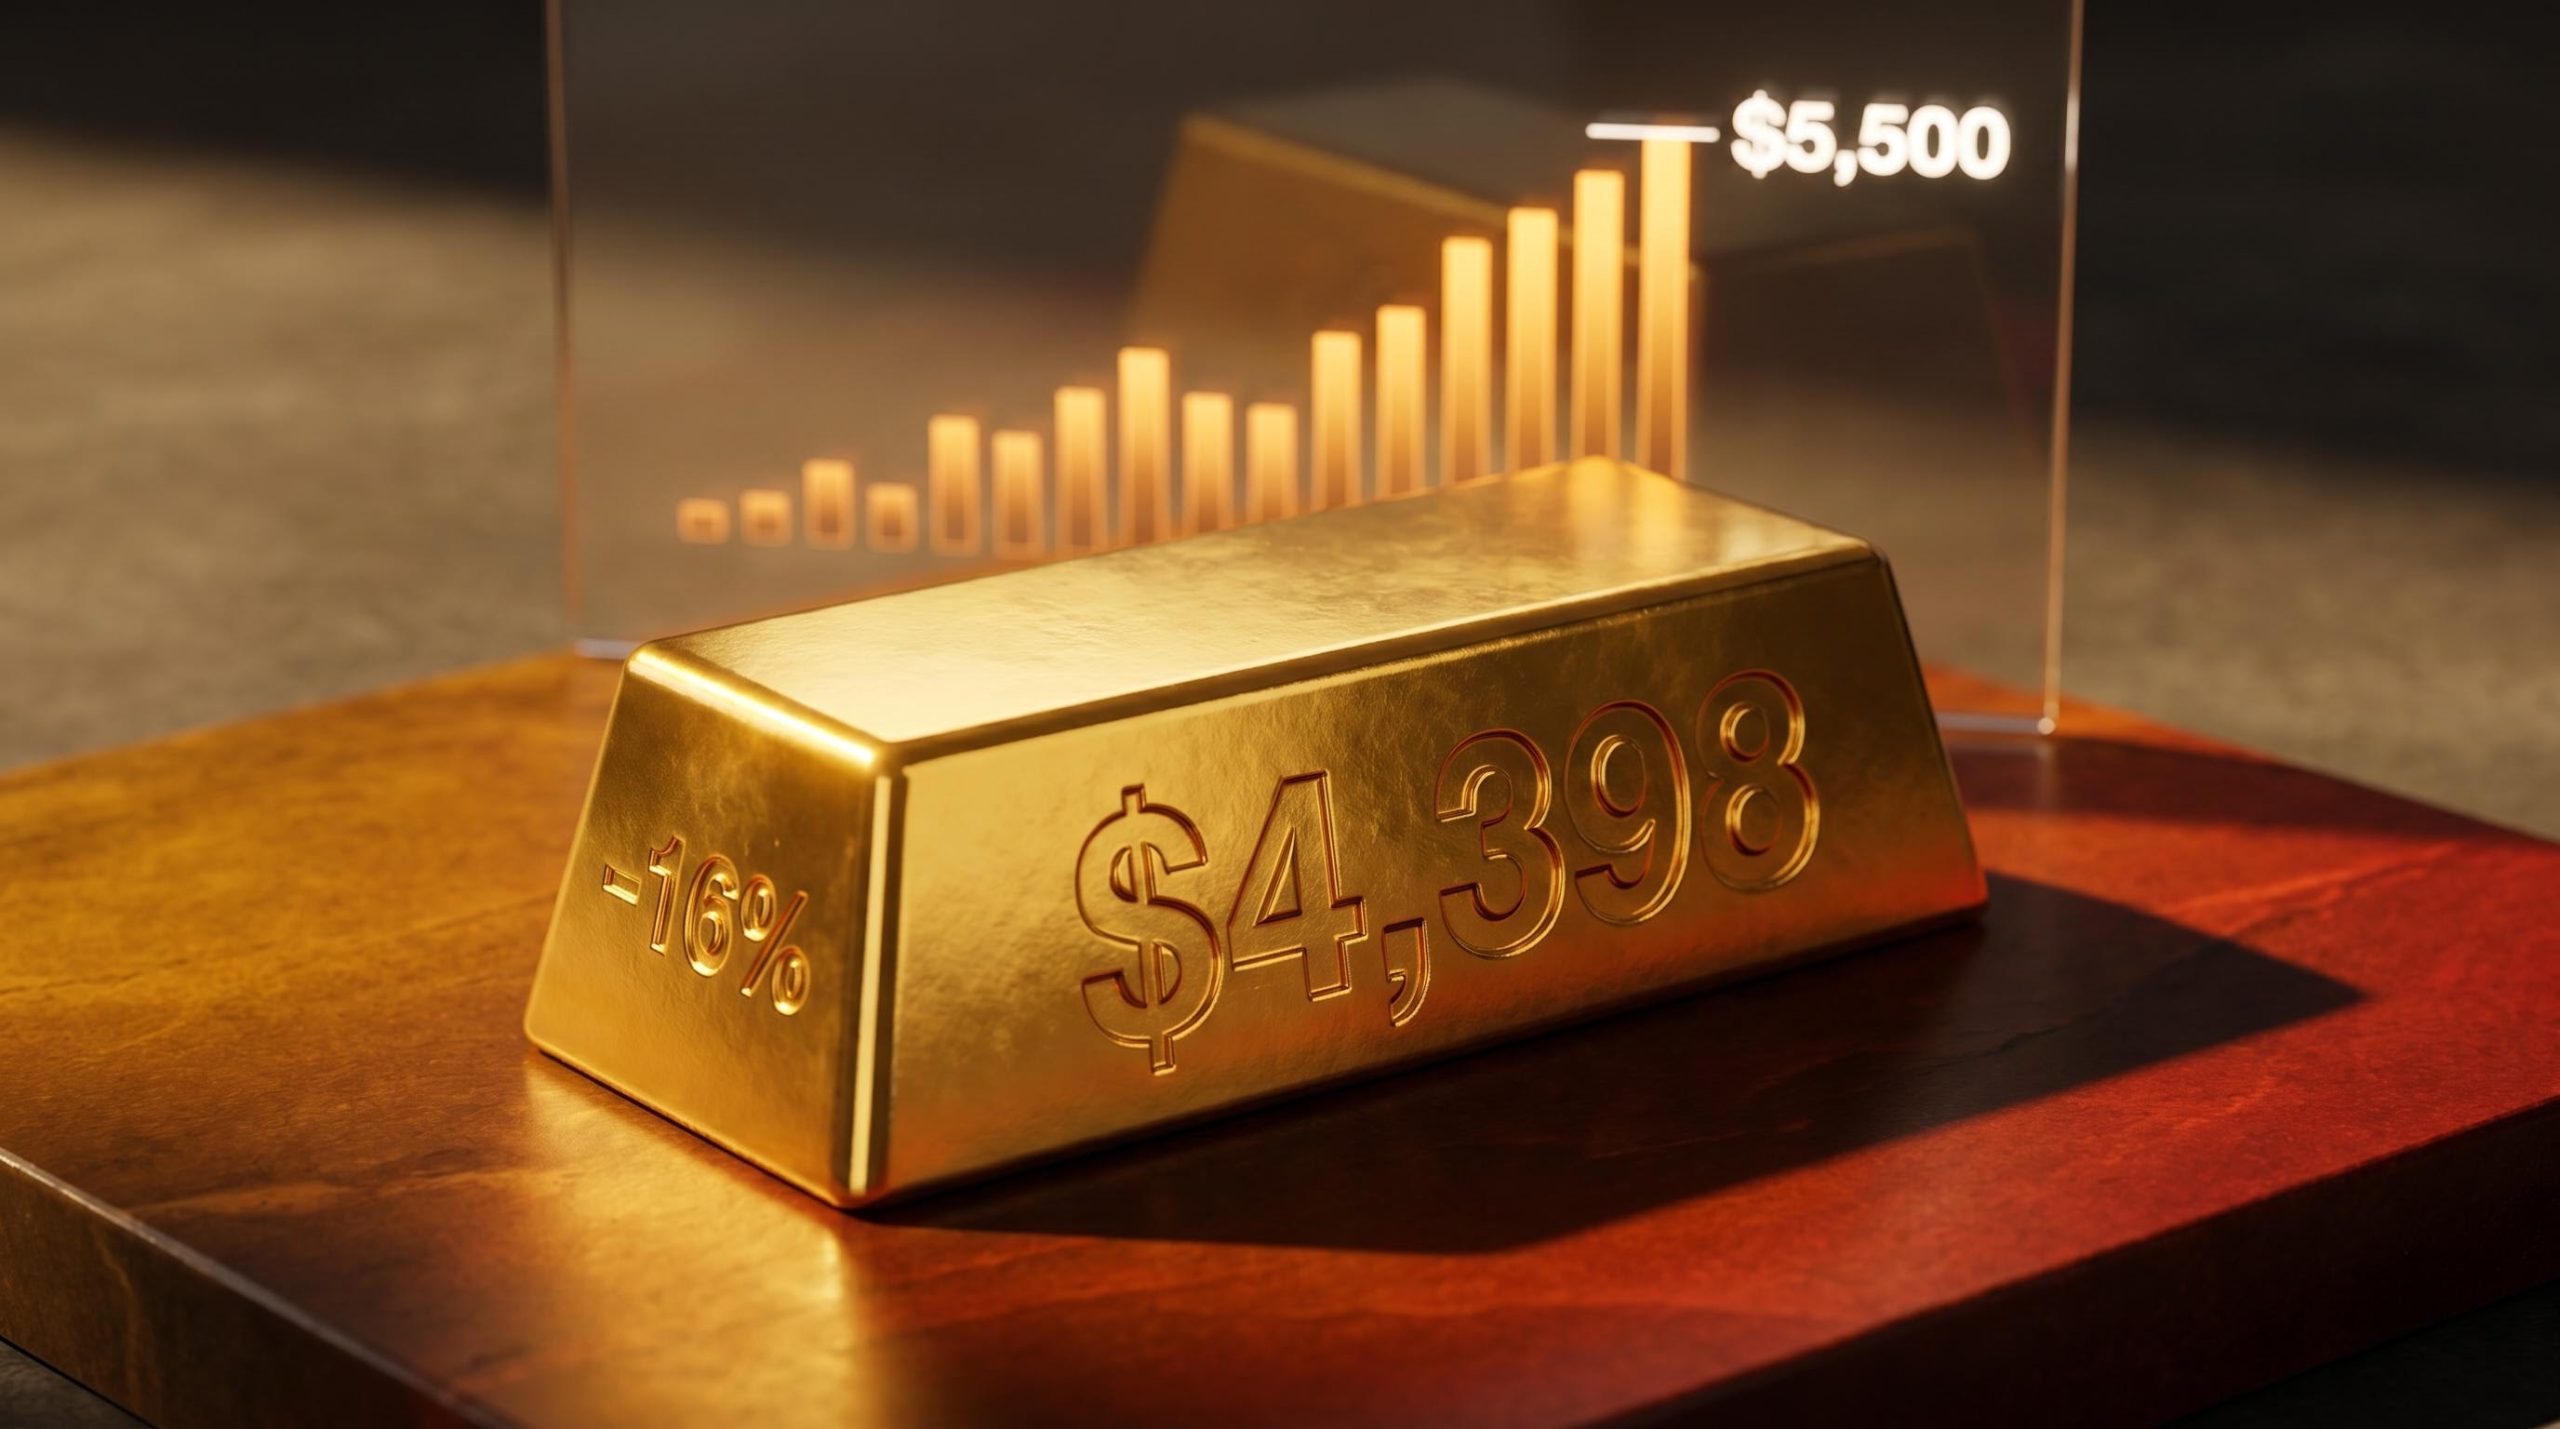
Gold has lost more than 16% of its value since U.S. and Israeli military strikes on Iran began in late February 2026, falling from roughly $4,700 per ounce to approximately $4,398 per ounce as of 28 May 2026. Wars are supposed to make gold go up. That this conflict has done the opposite is not an anomaly but a specific consequence of how the fighting has repriced Federal Reserve expectations through energy-cost inflation.
Understanding this mechanism is the difference between watching a price chart and reading the forces beneath it. What follows explains why the conflict hurt gold rather than helped it, what the $5,500 UBS year-end target actually implies about the recovery math, and what specific catalysts must materialise before a sustained move above $5,400 per ounce becomes achievable.
The mechanism that turned a war into a gold headwind
Gold sold off on every major escalation in the Iran conflict from late February through mid-May 2026, and rallied on peace signals. The pattern inverted the traditional safe-haven trade completely.
The transmission chain is specific and traceable:
- Elevated energy prices from the conflict raised inflation expectations across the U.S. economy.
- Higher inflation expectations drove hawkish Federal Reserve repricing, pushing Treasury yields upward.
- Rising Treasury yields increased the opportunity cost of holding non-yielding gold, making bonds relatively more attractive and pulling capital away from bullion.
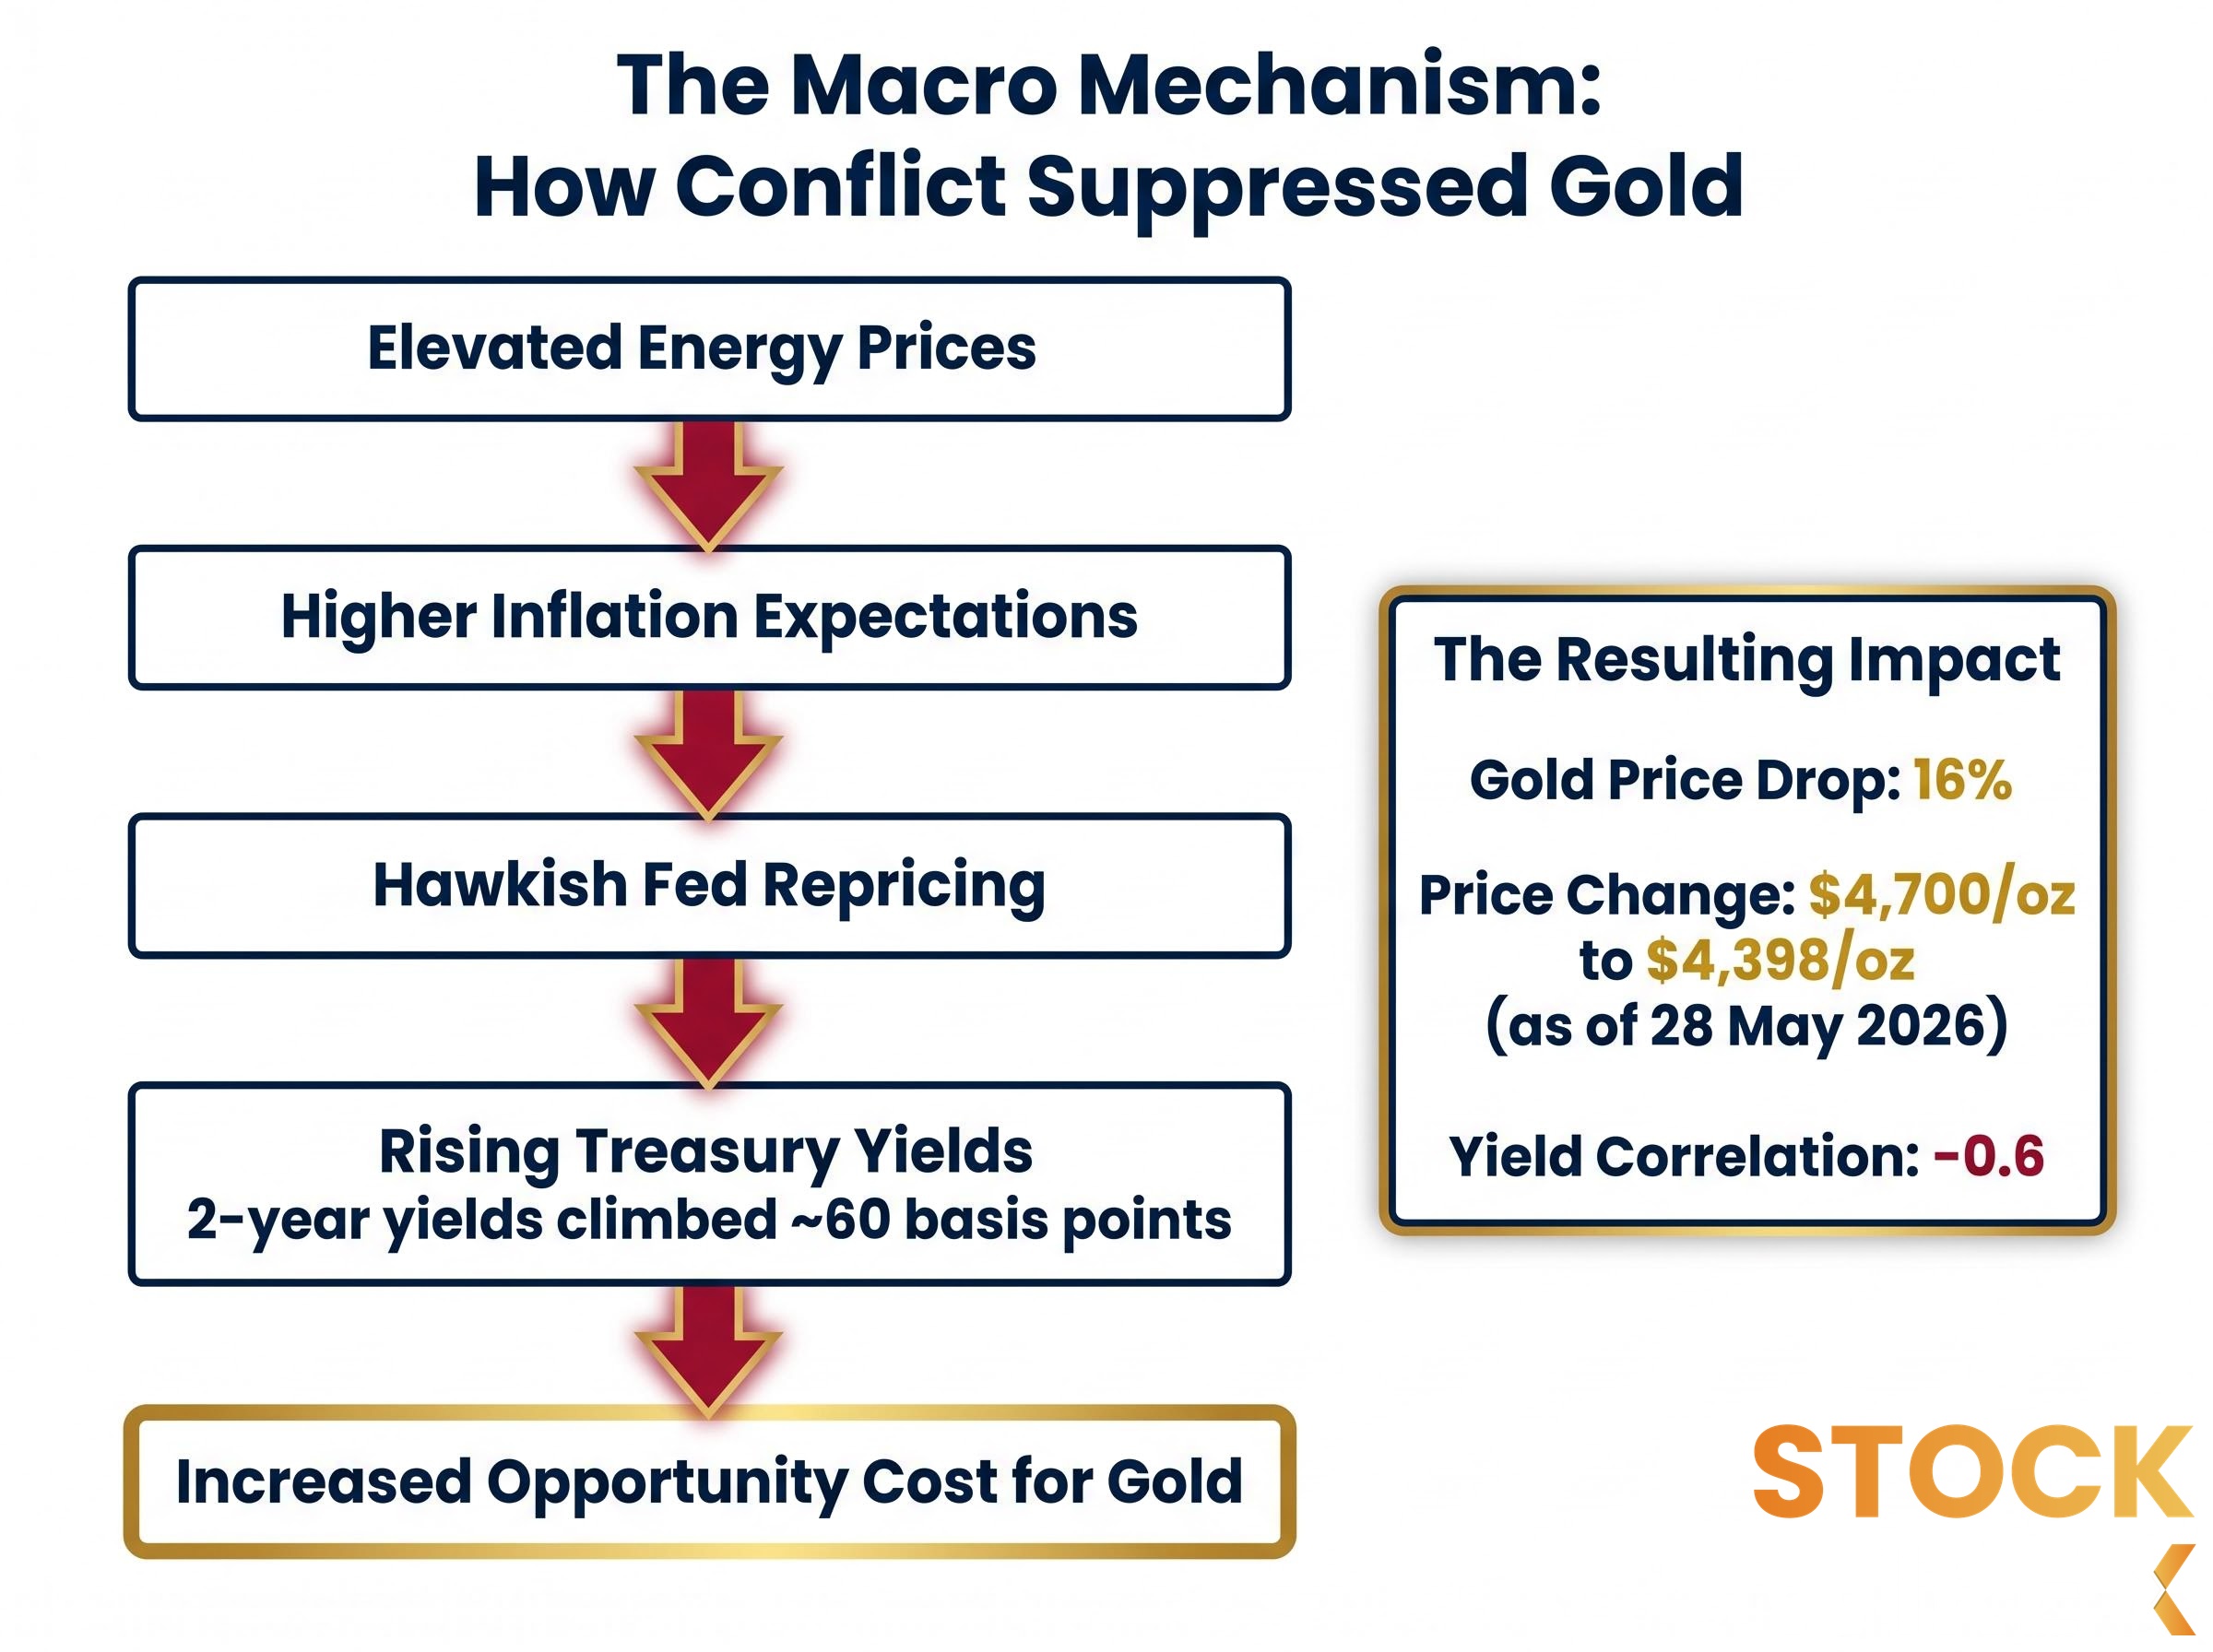
Each link reinforced the next. Two-year U.S. Treasury yields climbed approximately 60 basis points from the conflict’s onset through 28 May 2026, a move that applied persistent downward pressure on gold by making safe, income-generating alternatives more appealing.
The correlation between two-year Treasury yields and gold stood at approximately -0.6 as of 28 May 2026, compared to a slightly positive reading earlier in 2026. That single statistic captures the macro regime shift: gold and yields moved from travelling together to moving in sharp opposition.
This is not a novel dynamic. Prior conflict-inflation-repricing cycles, including the Ukraine war and Red Sea tensions, produced similar outcomes when rising real yields overwhelmed safe-haven demand. The mechanism that defeated the “war is good for gold” thesis in 2026 is the same mechanism that must reverse before gold can recover.
The oil-to-inflation transmission chain is the key to reading why this conflict behaved so differently from the safe-haven playbook: elevated crude prices fed directly into CPI expectations, delayed the Fed’s easing timeline, lifted real yields, and made the geopolitical risk that was supposed to support gold the very force suppressing it.
When big ASX news breaks, our subscribers know first
What gold actually is right now: a real-yield and dollar trade, not a war trade
The forces suppressing gold in May 2026 are macroeconomic, not geopolitical. The headwinds are:
- Hawkish Federal Reserve repricing that has pushed rate-cut expectations into late 2026 or beyond
- Elevated U.S. Treasury yields that raise the cost of holding non-yielding assets
- Dollar strength that makes gold more expensive in other currencies, dampening global demand
Short-term safe-haven buying occurred on specific strike events through March and April. Each time, the rally was overwhelmed within days by the structural macro repricing. The conflict’s net effect on gold has been negative precisely because the source of geopolitical risk was simultaneously the source of the inflationary pressure driving Fed repricing.
Minutes from the April 2026 FOMC meeting projected higher near-term inflation from energy prices, with the expectation that inflation would slow after H1 2026 as conflict-related effects dissipated. A Reuters poll published 22-23 April 2026 found economists expected the Fed to delay rate cuts until at least late 2026 due to war-driven energy shocks.
The April 2026 FOMC minutes confirmed the Committee’s view that near-term inflation was being pushed higher by energy prices linked to the Middle East conflict, while simultaneously projecting that these effects would dissipate in H2 2026 as conditions stabilised, a projection that remains the central assumption behind the December rate-cut thesis.
The correct framework for gold in this environment is not “will the conflict escalate further” but “when will Fed repricing reverse.”
Why central bank buying has capped the downside
The decline has been 16% rather than something more severe because central banks have continued to accumulate gold as a reserve asset. The World Gold Council reported on 29 April 2026 that central banks bought a net 244 tonnes of gold in Q1 2026, up 3% year-over-year.
The World Gold Council Q1 2026 demand report documented net central bank purchases of 244 tonnes during the quarter, a figure that represents both a 3% year-over-year increase and the clearest quantitative evidence that institutional demand floors remain structurally intact despite the price decline.
This structural bid has functioned as a demand floor, not a price catalyst. It has limited downside without reversing the direction set by macro forces. The distinction matters: central bank buying supports gold’s long-term value but cannot overpower a yield and dollar environment that is actively working against the metal.
What UBS’s revised $5,500 target actually means for the recovery math
UBS lowered its year-end 2026 gold price target to $5,500 per ounce from $5,900 per ounce in a note reported on 28 May 2026. The revision reflected a recalibration of timing and magnitude, not a change in directional view. UBS still projects gold will surpass its prior all-time high of approximately $5,400 per ounce before year-end.
From the current spot price of approximately $4,398 per ounce, reaching the UBS target of $5,500 implies a move of roughly 25%, a rally that would take gold above its previous record high. That is the scale of recovery the institutional consensus is projecting within seven months.
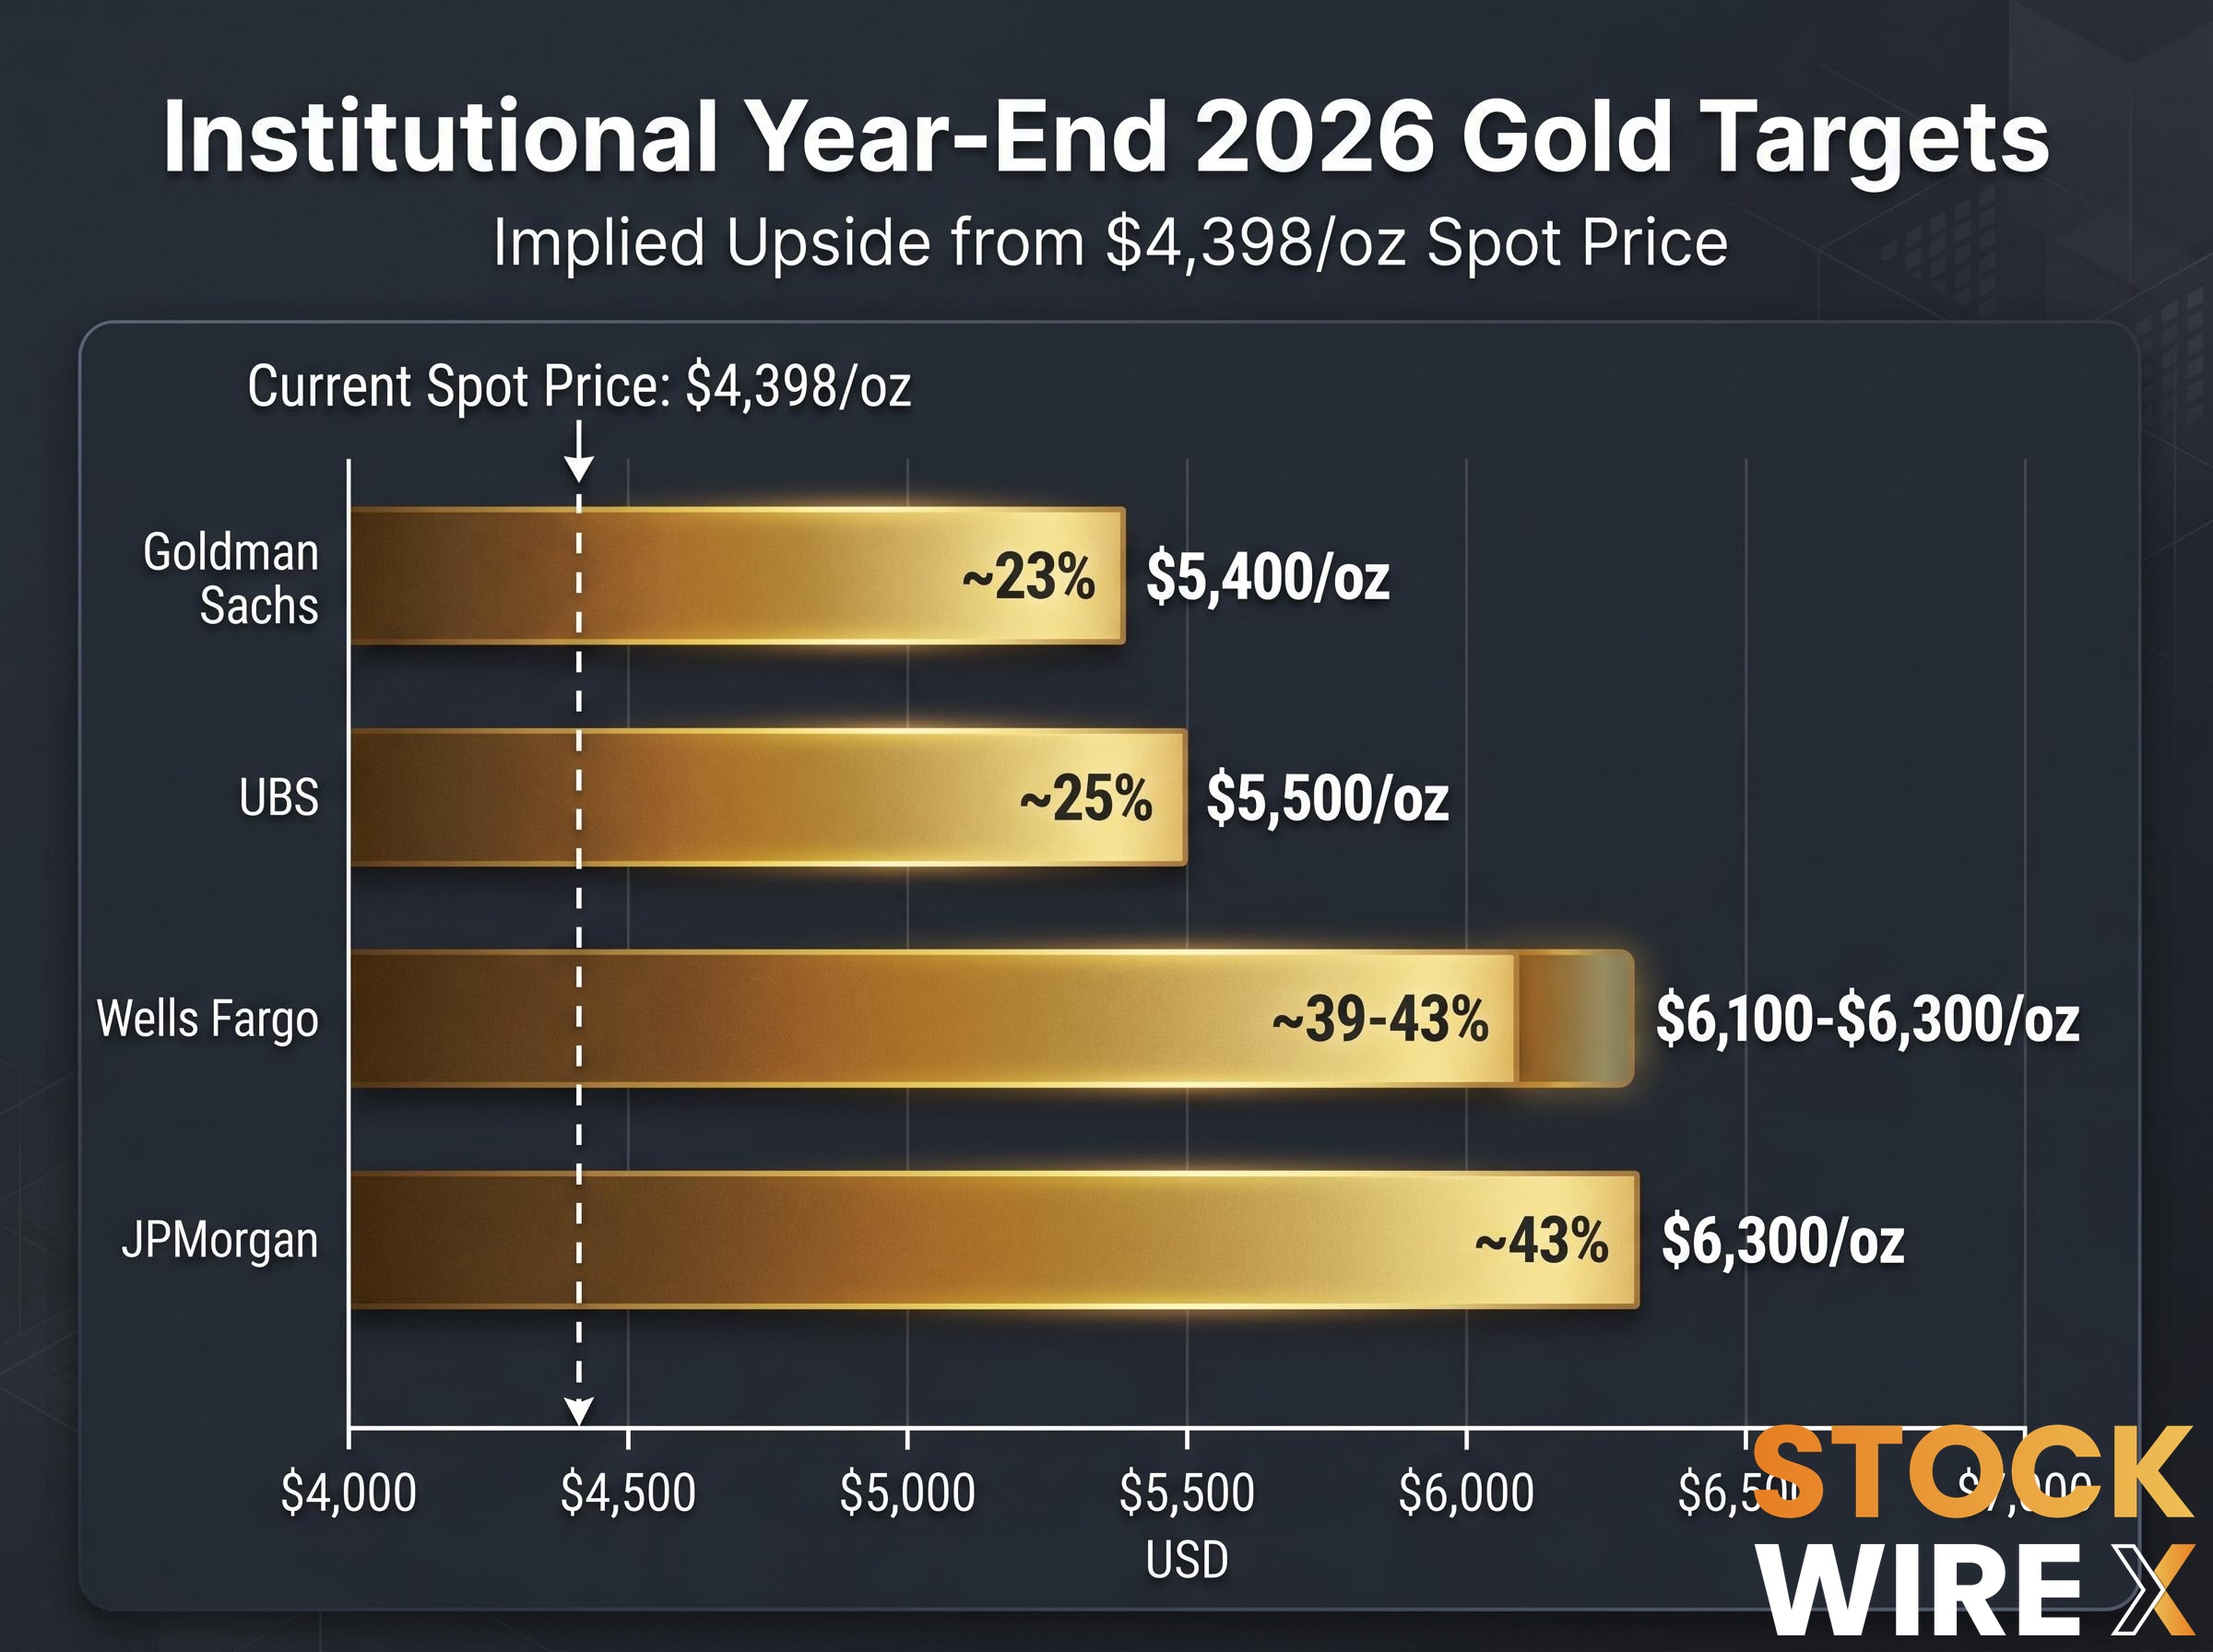
The UBS revision is the most conservative among major banks. The full forecast range reveals how wide the institutional consensus stretches:
| Institution | Prior Target | Revised/Current Target | Implied Upside from $4,398/oz |
|---|---|---|---|
| UBS | $5,900/oz | $5,500/oz | ~25% |
| Goldman Sachs | $5,400/oz (reaffirmed) | $5,400/oz | ~23% |
| JPMorgan | ~$5,055/oz (base case) | $6,300/oz | ~43% |
| Wells Fargo | N/A | $6,100-$6,300/oz | ~39-43% |
The spread between current spot and every major bank’s year-end target is the clearest signal that these institutions do not view the current decline as a structural bear market. Whether those targets prove accurate depends on the catalysts that follow.
Investors wanting to model the specific catalyst sequence behind the Goldman Sachs recovery case will find our full explainer on Goldman’s $5,400 gold thesis, which walks through the 50-basis-point Fed easing model, the implied $120 per ounce of direct price support from rate reductions, and the liquidation risks that could temporarily force gold lower even within an overall recovery trend.
The three catalysts that must align for gold to reclaim its high
The recovery case shared across major banks rests on three conditions materialising in sequence:
- Federal Reserve pivot to rate cuts. UBS projects the first cut at the December 2026 FOMC meeting, followed by additional reductions in early 2027 (specifically March 2027). This pivot depends on incoming inflation data between now and December confirming that energy-price inflation has not generated meaningful second-round effects in wages or core goods prices. The H2 2026 Consumer Price Index and Personal Consumption Expenditures prints are the data to watch.
- Yield and dollar reversal. A dovish Fed shift would mechanically unwind the yield and dollar strength that has suppressed gold since February. This is not a separate catalyst but the consequence of the first one: if the Fed signals cuts, two-year yields decline, the dollar softens, and the opportunity cost of holding gold falls.
- Central bank demand holding at or above the Q1 pace. UBS projected central bank purchases of 200-250 metric tonnes in Q2 2026, which would sustain the structural floor beneath the recovery.
Central bank demand as the structural floor beneath the recovery
Q1 2026 realised purchases of 244 tonnes (World Gold Council) were led by Poland (adding 31 tonnes, bringing total reserves to 582 tonnes) and Uzbekistan (adding 25 tonnes). If Q2 2026 volumes land within the UBS projection of 200-250 tonnes, the demand floor remains intact.
UBS cited reserve diversification trends, high global debt levels, and the prospect of looser monetary conditions as factors supporting medium-term central bank demand. Goldman Sachs separately flagged potential further private-sector diversification as an additional upside factor beyond central bank buying.
Central bank reserve diversification has accelerated well beyond the Q1 2026 pace, with the World Gold Council forecasting 850 tonnes of sovereign demand for the full year, a volume that reflects a structural reorientation away from dollar-denominated reserves rather than a tactical response to any single geopolitical event.
These three catalysts give investors a concrete monitoring framework: track inflation prints through H2 2026, watch the December Fed meeting, and note whether central bank buying volumes hold at or above the Q1 pace.
Why the bear case deserves a full hearing before December
The institutional consensus points upward, but the path from $4,398 per ounce to any year-end target requires substantial acceleration in the second half of 2026. Several specific risks could delay or derail the recovery:
- Persistent second-round inflation effects from elevated energy prices, which would prevent the Fed from cutting in December
- Sustained dollar strength if U.S. yields remain elevated relative to other major economies
- A delayed or shallower Fed easing cycle that extends the headwind environment well into 2027
JPMorgan lowered its 2026 average gold price forecast to $5,243 per ounce from $5,708 per ounce, a reduction of approximately $465 per ounce, reflecting softer near-term investor demand. That revision signals that even the most bullish institution on year-end targets acknowledges the near-term environment remains challenging.
Reaching even the most conservative year-end target (Goldman Sachs at $5,400 per ounce) from current levels implies approximately 23% upside in roughly seven months. Every major bank target has already been revised downward once in 2026, and a second revision remains possible if H2 inflation data surprises to the upside.
The FOMC’s April minutes projected that inflation would slow after H1 2026, but this projection is contingent on conflict-related effects dissipating on schedule. Treating institutional targets as conditional projections rather than probable outcomes is the appropriate framing for position sizing and timing decisions.
What this unusual cycle reveals about gold’s actual role in a portfolio
The 2026 cycle demonstrates that gold’s sensitivity to real yields and Fed policy expectations is more powerful than its safe-haven demand when geopolitical risk is simultaneously inflationary. The correlation shift to -0.6 is the statistical signature of this dynamic.
Gold functions differently across time horizons, and those two roles can appear contradictory without actually conflicting:
- Long-term structural role: A reserve asset supported by consistent central bank accumulation (244 tonnes net in Q1 2026), diversification away from dollar-denominated reserves, and a hedge against monetary debasement over multi-year periods.
- Short-to-medium term price drivers: Real yields, dollar strength, and Fed expectations dominate price action over quarters and months. When these forces align against gold, as they have since February, the structural bid from central banks limits downside but does not reverse direction.
This dynamic was particularly pronounced in 2026 because the source of geopolitical risk (the Iran conflict) was simultaneously the source of the inflationary pressure driving Fed repricing. In a different conflict, one that did not directly threaten energy supply chains, the traditional safe-haven response could have held.
Every major institutional forecast remains above $5,400 per ounce for year-end 2026 despite the sell-off. That consensus reflects the distinction between short-term macro headwinds and medium-term structural support. Investors who understand the real-yield framework will be better positioned to interpret gold price signals in future geopolitical cycles, not only the current one.
For investors evaluating how gold’s 16% drawdown has changed its relative value against equities, our deep-dive into the Dow-to-gold ratio examines where the current reading sits against its 50-year average, how prior ratio extremes have marked secular turning points between equity and gold cycles, and what the institutional price targets for year-end 2026 would imply for the ratio if they are realised.
The path to $5,500 runs through December, not Damascus
Gold’s recovery is a Federal Reserve story, not a geopolitical story. The December 2026 FOMC meeting is the event that the UBS recovery thesis depends upon, and the inflation data published between now and December determines whether that thesis holds or gets revised again.
The institutional consensus is constructive above $5,400 per ounce by year-end, but this requires H2 2026 inflation prints to confirm that the energy shock has not embedded in broader price levels. If the data cooperates, the Fed pivots, yields decline, and gold’s recovery has a credible path. If it does not, the timeline extends and targets face a second round of downward revision.
The direction is clear. The timing is not. Monitoring inflation data and Fed signals through H2 2026 is the actionable implication for investors evaluating their gold exposure.
This article is for informational purposes only and should not be considered financial advice. Investors should conduct their own research and consult with financial professionals before making investment decisions. Past performance does not guarantee future results. Financial projections are subject to market conditions and various risk factors.