
Why Drug Reformulation Carries Less Risk Than Investors Price in
5 hrs ago

In March 2022, the Federal Reserve began the most aggressive rate-hiking cycle in four decades. U.S. inflation was running at 9.1%. A war in Europe was driving profound uncertainty across global markets. By any popular framework for owning gold, conditions could not have been more favourable. Gold fell as much as 20% anyway.
Gold is one of the most widely discussed assets in personal finance, yet the popular rules investors use to time it have a poor historical track record. Buy when the Fed cuts. Buy when inflation spikes. Buy when geopolitics heats up. Each of these heuristics sounds intuitive. Each has failed, repeatedly, across documented cycles.
What follows is an evidence-based examination of why gold price prediction is structurally difficult, not temporarily so. It covers what gold actually is as an asset class, why its price resists the conventional macro signals investors rely on, and what a more defensible role for gold in a portfolio looks like.
There is no model that can tell an investor what gold is worth. That is not a gap in current research; it is a permanent feature of the asset.
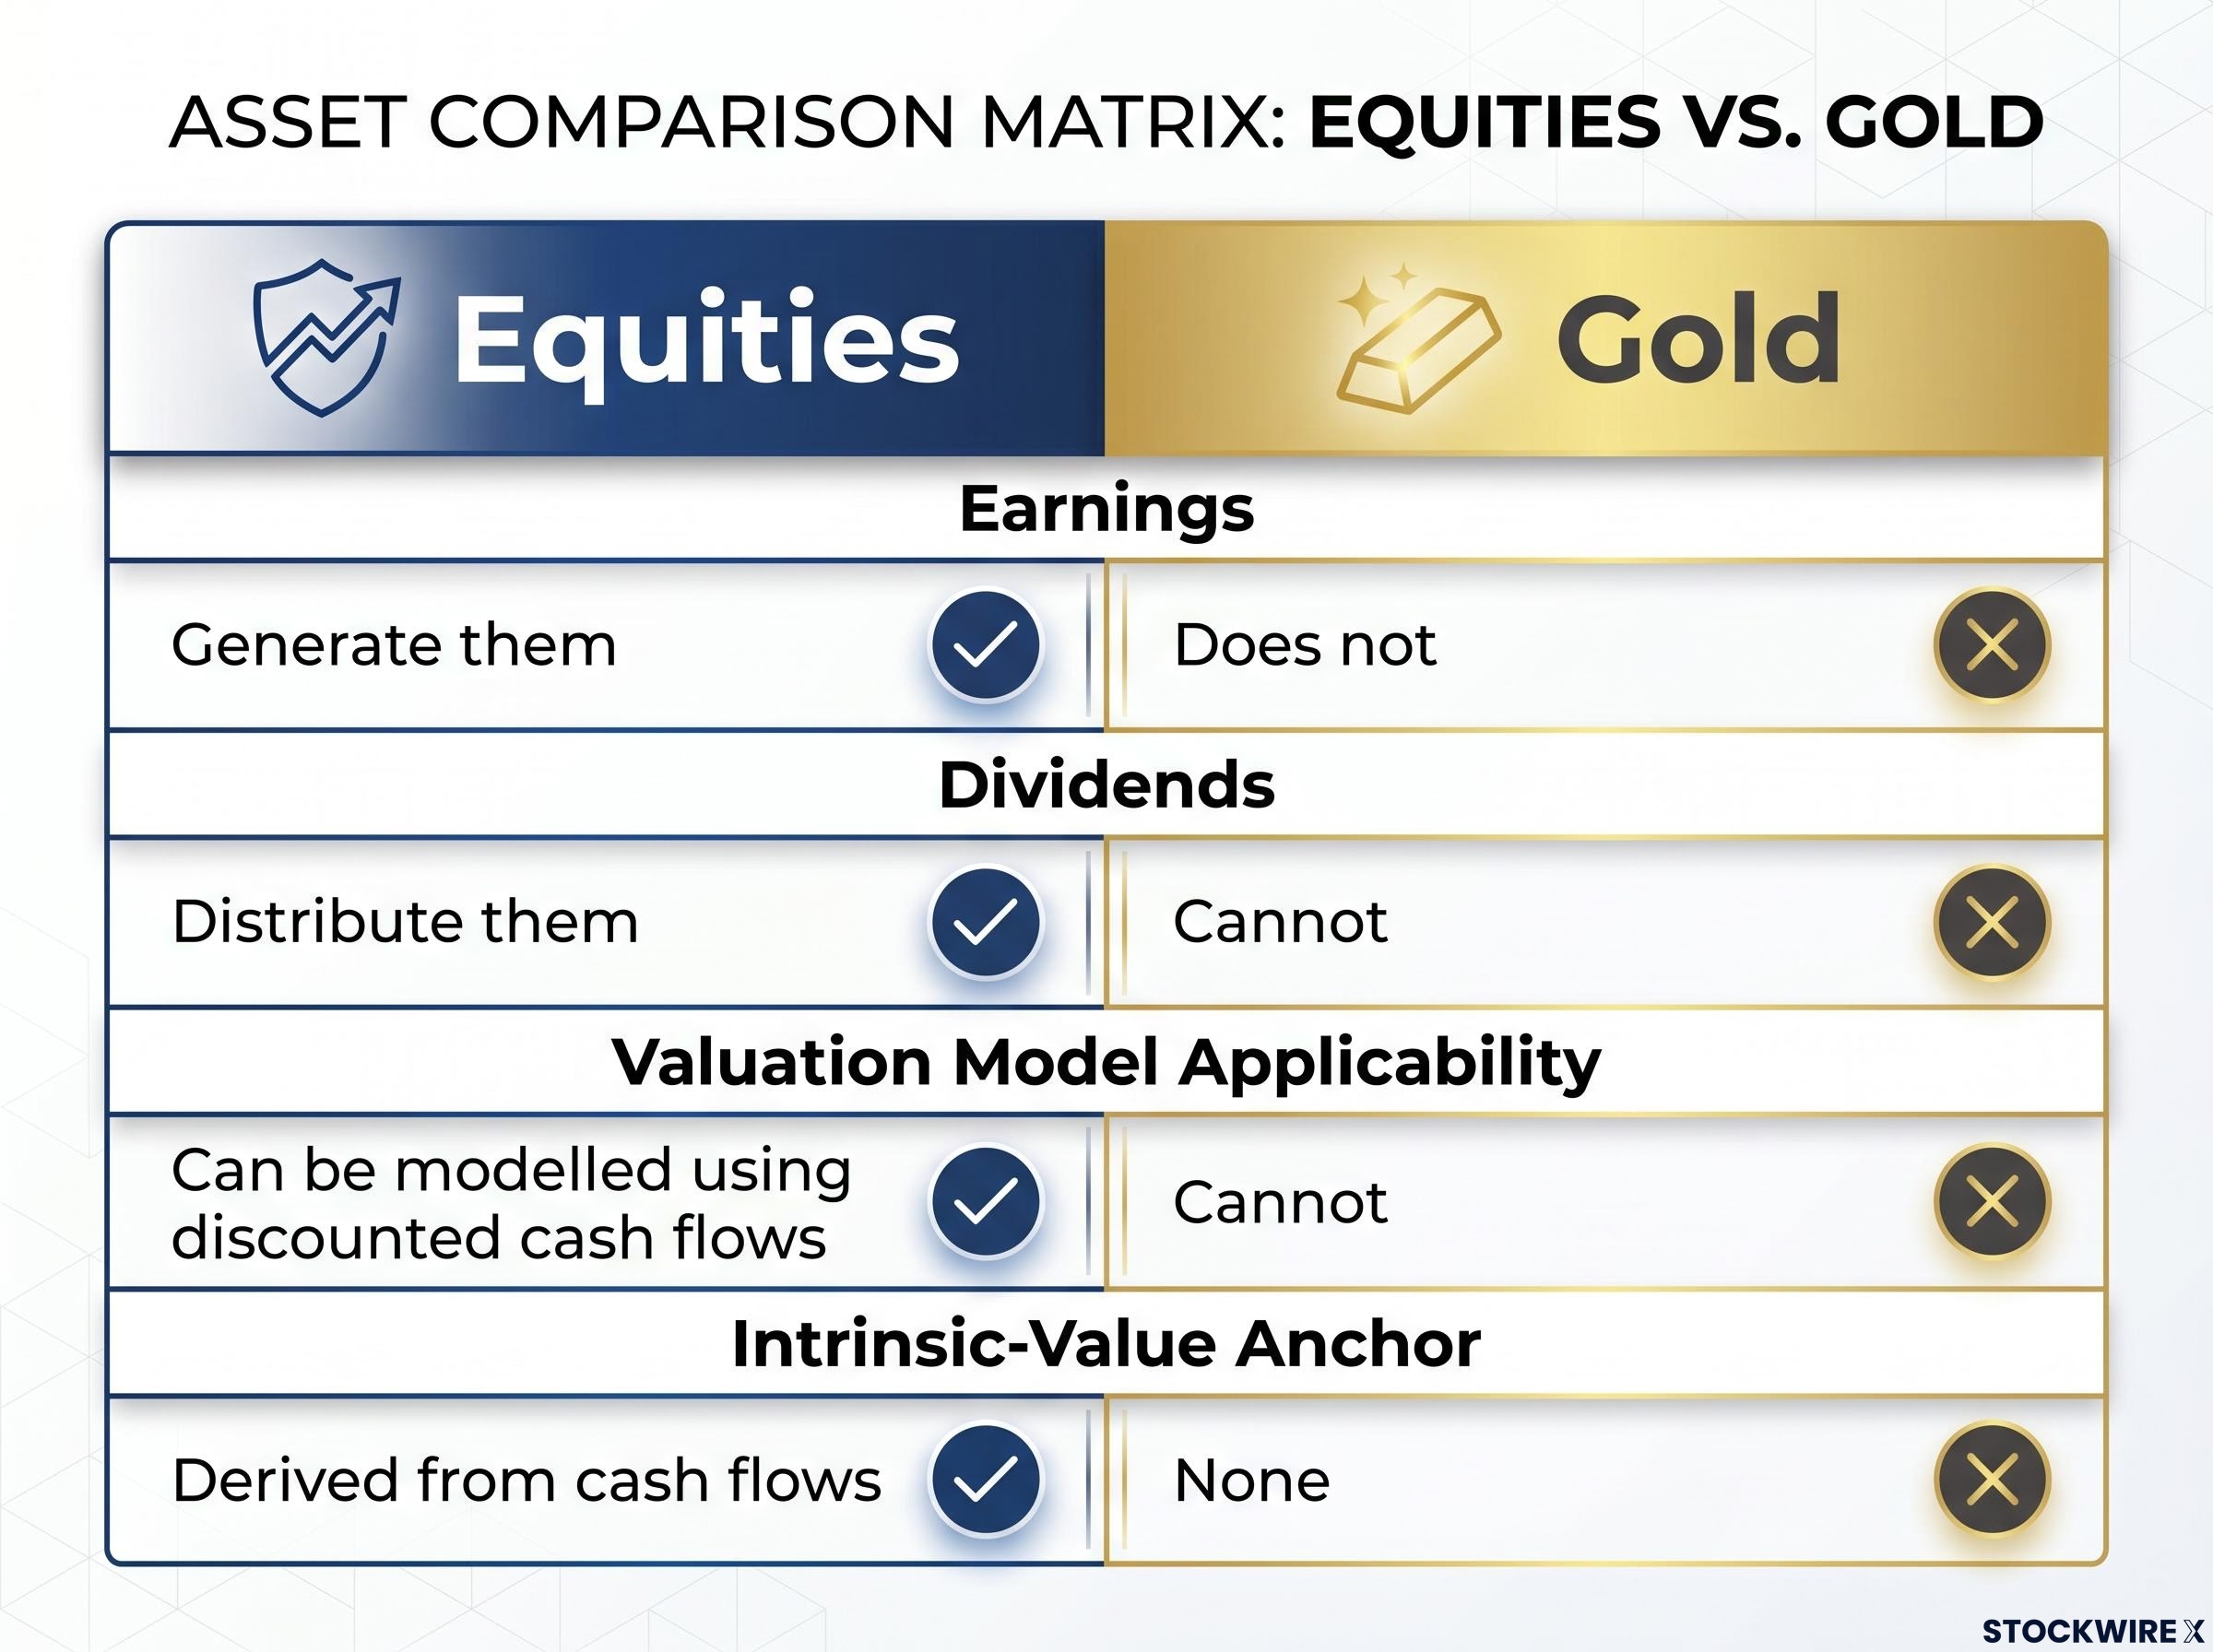
Gold generates no cash flows. It pays no interest. It produces no earnings, distributes no dividends, and does not engage in share repurchases. Unlike a company, it cannot reinvest in its own growth. There is no revenue line, no margin structure, and no book value. The discounted-cash-flow models that underpin equity and bond analysis have nothing to discount.
The practical consequence is that gold has no pricing floor. With equities or corporate bonds, internal cash-flow streams provide an anchor. If a stock’s price falls far enough below the present value of its expected earnings, a rational buyer can step in with a valuation argument. Gold offers no equivalent.
What determines the price, then, is what the next buyer is willing to pay. Institutions frame gold as a store of value, a portfolio hedge, or a diversifier, not a productive asset, and this framing is consistent across professional research and academic contexts. The price at any given moment reflects expectations and sentiment rather than measurable fundamentals.
The Dow-to-gold ratio, which stood roughly 30% below its 50-year average in May 2026, captures the same purchasing-power tension this article examines from the opposite direction: rather than asking where gold is headed, it asks what equities are worth when denominated in an asset with no cash flows to anchor its value.
The distinction matters because most investors approach gold with instincts trained on equity analysis, and those instincts do not transfer:
Without a pricing anchor, every other difficulty covered in this article follows directly.
Investors familiar with oil or copper cycles often assume that gold follows similar supply-and-demand logic: high prices attract new production, supply eventually surges, and prices correct. For gold, that mechanism is structurally weak.
Most gold ever mined still exists above ground, in bars, coins, jewellery, or central bank reserves. Annual mine output adds only incrementally to an already enormous stock. This is the opposite of consumable commodities like oil, where industrial use physically destroys the product. Burning oil removes it from the market permanently. Gold, by contrast, circulates between forms and owners. It changes hands; it does not disappear.
The result is that high prices do not reliably incentivise enough new mine investment to create supply surpluses that correct pricing. The commodity-supercycle logic that works for energy and base metals is far weaker here.
Gold has limited industrial applications compared to metals like copper. The demand side is dominated by three categories:
Central bank gold accumulation has introduced a structural demand floor that operates largely independently of the monetary policy signals retail investors track: sovereign buyers are driven by reserve diversification and geopolitical hedging motives, not by yield differentials, which means their purchasing behaviour persists even during tightening cycles that suppress speculative demand.
None of these categories represents consumptive destruction of the asset. Because gold is not consumed in the way oil or agricultural products are, sentiment and macro narratives fill the gap that industrial demand fills for other commodities. The pricing mechanism is driven not by physical scarcity from consumption, but by how much the next buyer believes gold is worth holding.
If gold has no valuation anchor and no consumption-driven supply correction, what actually moves the price? The World Gold Council’s own attribution work provides a direct answer: belief, narrative, and regime expectations.
The WGC’s Gold Return Attribution Model (GRAM) decomposes gold’s recent returns into explanatory categories. According to the World Gold Council’s 2026 outlook, approximately 12 percentage points of year-to-date return were attributed to a “high-risk environment,” primarily geopolitical risk. Another 9 percentage points were attributed to momentum and investor positioning.
The relationship between geopolitical conflict and gold prices ran in reverse during the Iran conflict of early 2026: elevated energy prices fed directly into inflation expectations, triggered hawkish Federal Reserve repricing, and pushed Treasury yields roughly 60 basis points higher, producing a selloff rather than a safe-haven rally.
According to the World Gold Council’s 2026 GRAM attribution, roughly 12 percentage points of gold’s year-to-date return reflected a high-risk environment (geopolitical risk), and approximately 9 percentage points reflected momentum and investor positioning. These are structured ways of capturing sentiment and risk appetite, and together they explain the dominant share of gold’s recent performance.
These categories, geopolitical risk and positioning, are structured ways of capturing what investors believe and feel about the macro environment. Their dominance in the attribution means gold price moves are largely a function of collective market psychology rather than hard fundamentals in the equity or credit sense.
The implication is uncomfortable but precise. Because sentiment is inherently changeable and difficult to forecast, timing gold’s price movements carries the same structural difficulty as timing short-term stock market swings. When investors buy gold, they are making a bet on how other investors will feel about the world, not on a measurable economic outcome. That reframing changes how seriously anyone should take short-term gold price calls.
The most commonly cited rule in gold investing is straightforward: higher interest rates raise the opportunity cost of holding a non-yielding asset, so gold should weaken when rates rise and strengthen when rates fall. The historical record directly contradicts this as a reliable signal.
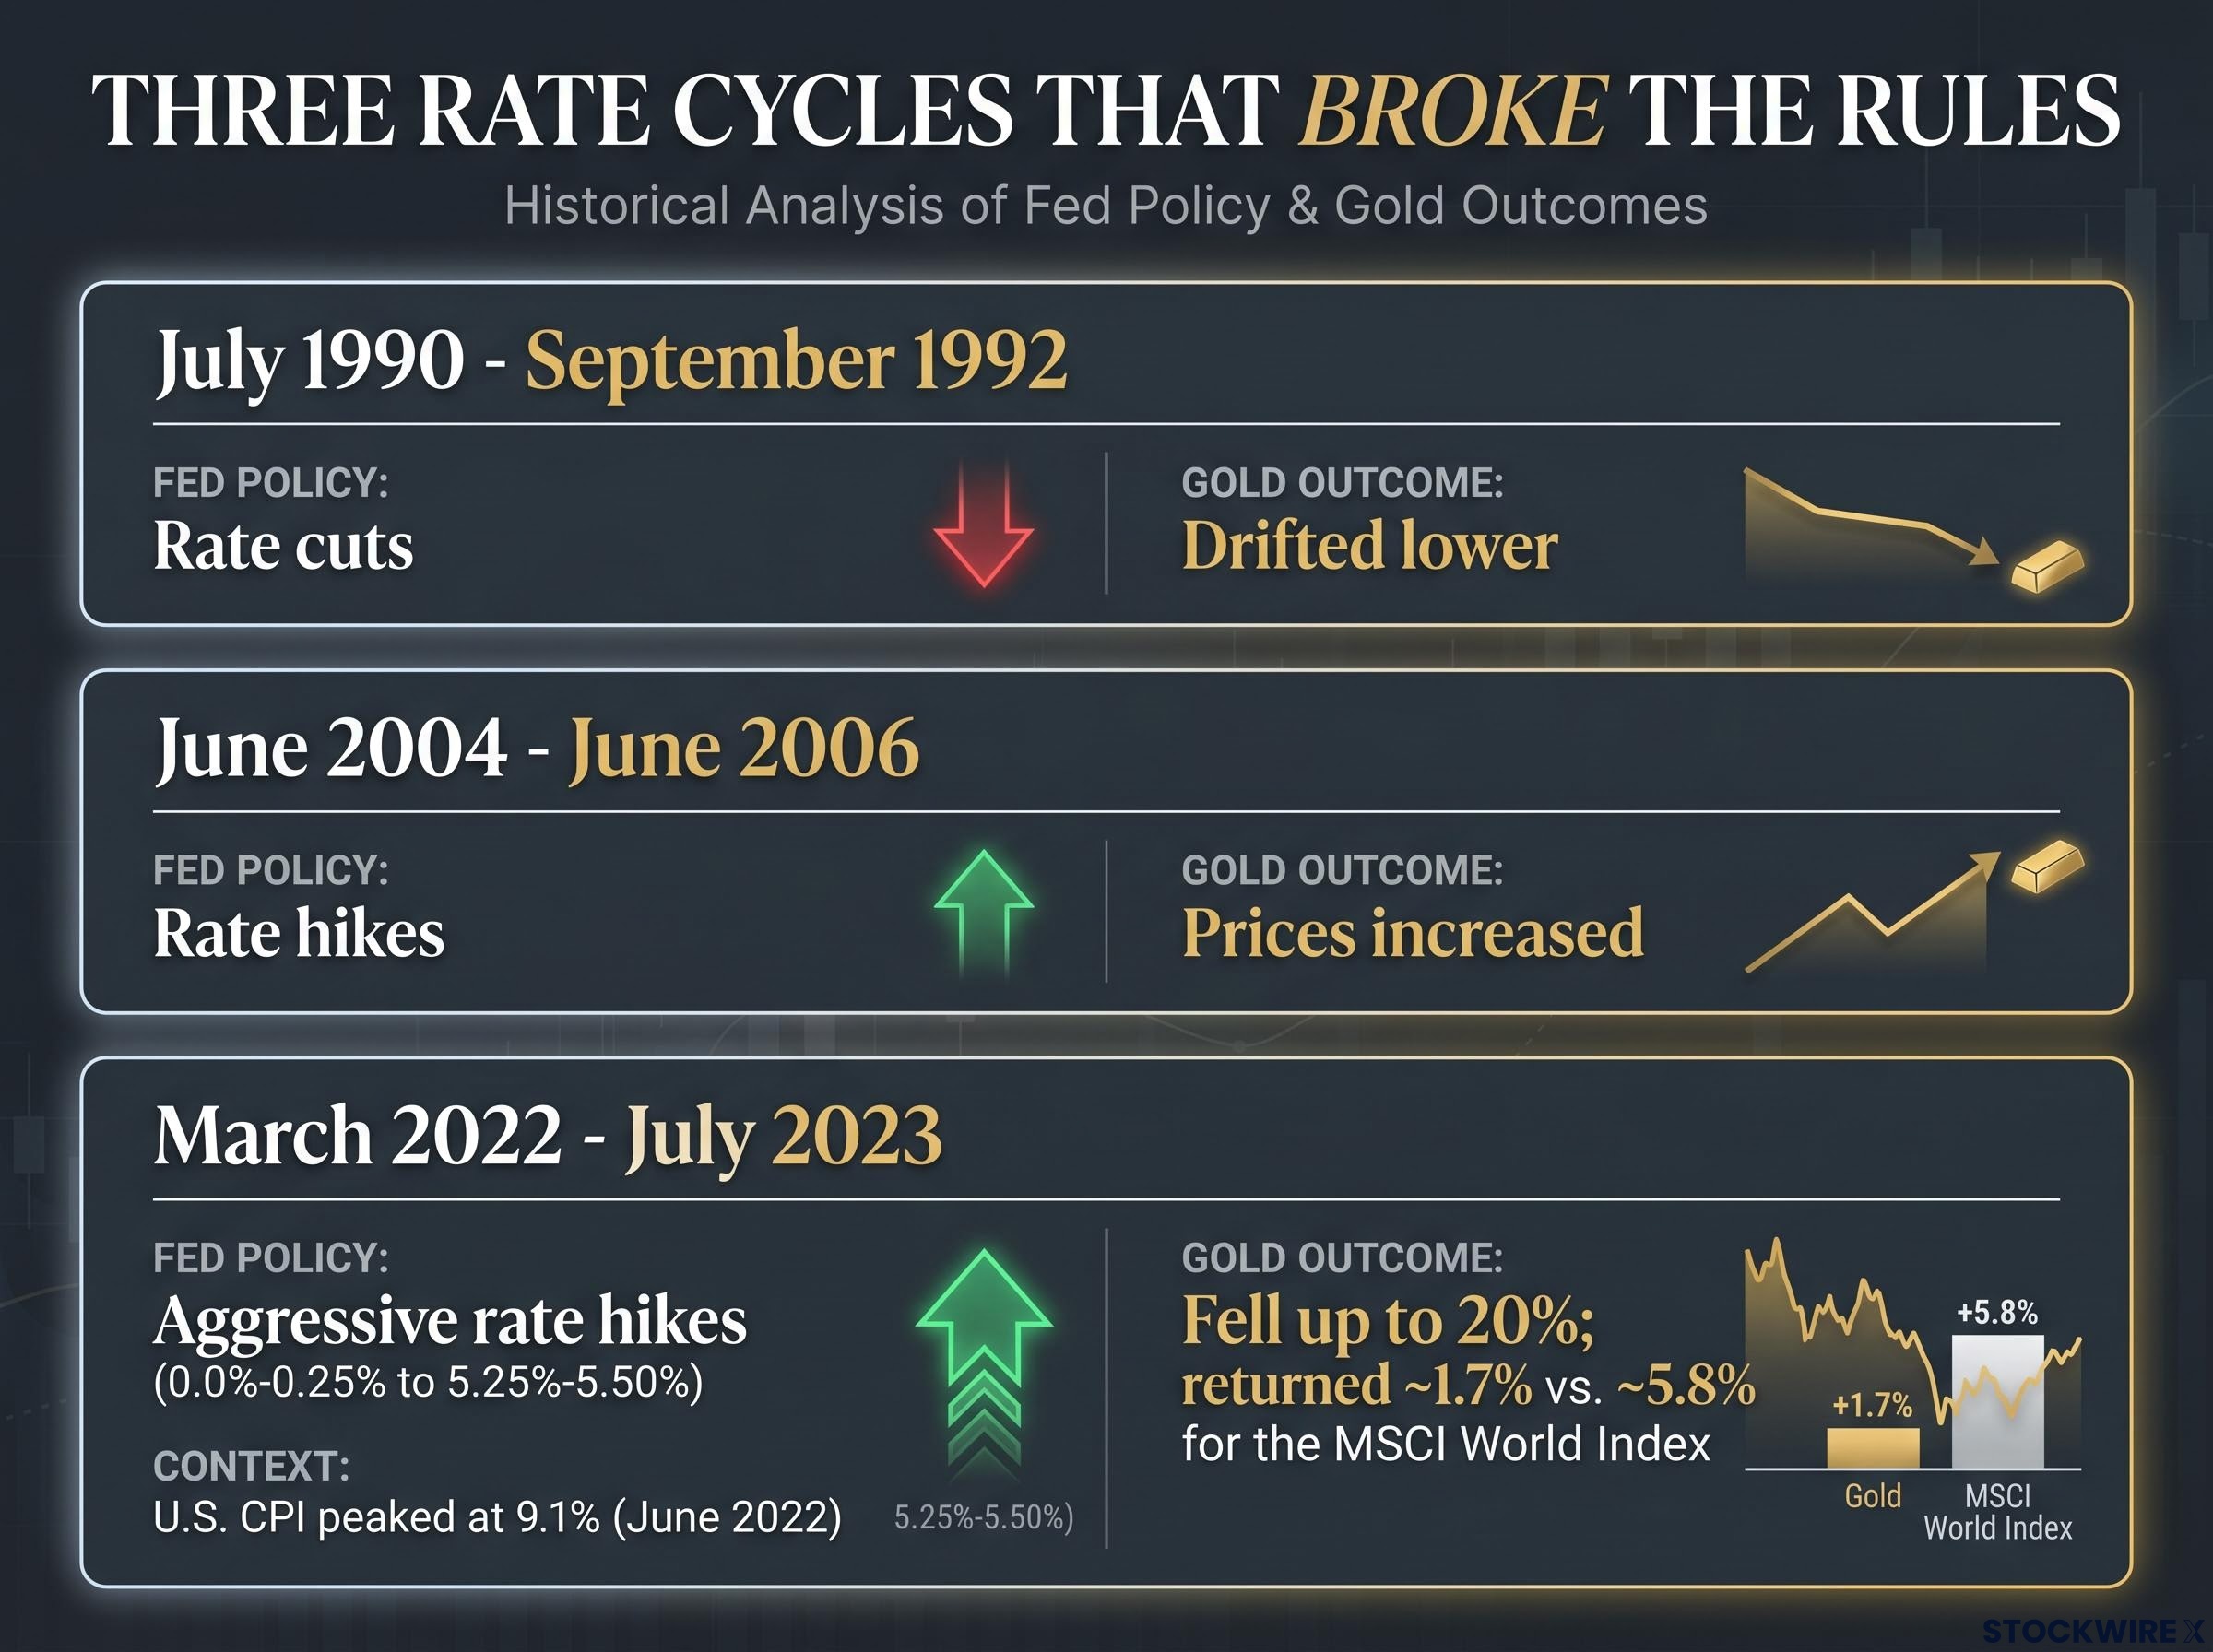
The 2004-2006 hiking cycle should have pressured gold lower. The Fed raised rates steadily over two years. Instead, gold prices increased over the period, according to FactSet data as of 16 June 2026.
The 1990-1992 cutting cycle should have supported gold. The Fed reduced rates from July 1990 through September 1992. Gold drifted lower, according to FactSet data as of 16 June 2026.
The 2022-2023 tightening cycle is the most instructive case. The Fed moved the federal funds target range from 0.0%-0.25% to 5.25%-5.50% between March 2022 and July 2023. U.S. CPI peaked at 9.1% year-over-year in June 2022. Active geopolitical conflict in Europe and energy supply disruption fears created a backdrop that combined every theoretically gold-positive condition simultaneously. Gold fell as much as 20% between 8 March and 3 November 2022. Over the full tightening cycle from 16 March 2022 through 27 July 2023, gold returned approximately 1.7%, compared with roughly 5.8% for the MSCI World Index with net dividends, according to FactSet data.
| Period | Fed Policy Action | Gold Outcome | Takeaway |
|---|---|---|---|
| July 1990 – September 1992 | Rate cuts | Gold drifted lower | Cutting rates did not support gold |
| June 2004 – June 2006 | Rate hikes | Gold prices increased | Rising rates did not suppress gold |
| March 2022 – July 2023 | Aggressive rate hikes (0.0%-0.25% to 5.25%-5.50%) | Gold fell up to 20%; returned ~1.7% vs. ~5.8% for MSCI World | Peak inflation, geopolitical conflict, and rate hikes combined; gold still underperformed |
These are not theoretical objections. They are documented episodes where the most widely cited rules produced the wrong directional call and where investors relying on those heuristics faced real opportunity costs.
The case against tactical gold prediction does not require claiming gold is completely random. Several partial, probabilistic relationships exist. They simply are not stable enough to support reliable trading rules.
Gold is more tightly linked to real interest rates (nominal rates minus inflation) and the U.S. dollar than to nominal rates alone. The World Gold Council’s GRAM model shows that lower real rates, a weaker dollar, and elevated geopolitical risk jointly explain a large share of recent gains. These relationships are real. They are also time-varying.
The three partial relationships that hold, conditionally, are:
This regime-dependence is why institutional models produce wide scenario ranges rather than confident point forecasts.
The World Gold Council’s 2026 scenario analysis shows gold could surge 15-30% in some macro paths or fall 5-20% in others, depending on how growth, inflation, and policy evolve. JP Morgan research ties its bullish price targets explicitly to Fed policy and geopolitical outcomes, while immediately noting that both are uncertain and unstable.
The honest position is not that gold is random, but that its relationships with macro variables are regime-dependent and not stable enough to trade on. Investors who finish this section have a more precise model than “buy gold when the Fed cuts,” and that precision is the point.
Most investors arrive at this topic because they want to know when to buy gold. The evidence suggests the question itself may be framed incorrectly.
A more defensible use of gold operates over multi-year horizons and does not depend on calling the next Fed move correctly. The strategic case rests on:
These rationales have more consistent long-run support in the data. They also do not require a view on where gold is headed next month.
Investors wanting to build out the multi-year strategic allocation case in more depth will find our deep-dive into the structural long-term gold thesis, which examines how rising sovereign debt has eroded the diversification role of government bonds, what the World Gold Council and BlackRock data show about gold in a 60/40 context over 2013-2023, and why central bank reserve behaviour signals a regime shift rather than a tactical move.
The tactical case, by contrast, has a poor historical track record across documented cycles. The specific rules that have failed include:
The 2022 episode is the clearest available demonstration of all three conditions being present simultaneously without the expected outcome. No single macro variable, not the Fed funds rate, not CPI, not geopolitical headlines, has produced consistent, reliable tactical signals across cycles.
If gold is used at all, the evidence supports treating it as a tool with a specific strategic purpose rather than an asset that can be reliably timed using monetary policy decisions, inflation data, or news flow.
The 2022 episode from the opening paragraph was not an anomaly. It was a clean demonstration of what the structural evidence shows: gold’s forecasting difficulty is not a temporary feature to be solved with better models. It is rooted in the absence of cash flows, the dominance of sentiment, and the regime-dependence of every macro relationship investors rely on.
The more useful question is not “where is gold going?” but “what specific portfolio purpose does gold serve, and over what horizon?” That distinction, between strategic allocation and tactical timing, is the single most important framework the evidence supports.
Gold is very hard to time tactically using simple rules tied to the Fed, inflation prints, or news flow, because the mapping from those variables to price is unstable and heavily mediated by shifting expectations, the dollar, and risk sentiment. The research, the institutional models, and the historical record all converge on the same conclusion: scenario analysis, not point forecasts.
This article is for informational purposes only and should not be considered financial advice. Investors should conduct their own research and consult with financial professionals before making investment decisions. Past performance does not guarantee future results. Financial projections are subject to market conditions and various risk factors.
Gold has no cash flows, earnings, or dividends, so there is no valuation model to anchor its price. Instead, its price is driven by sentiment, narrative, and shifting macro expectations, all of which are inherently hard to forecast.
No. The 1990-1992 cutting cycle is a documented example where the Fed reduced rates steadily over two years and gold drifted lower. The rate-cut-equals-gold-strength rule has failed across multiple historical cycles.
According to the World Gold Council's GRAM attribution model, geopolitical risk and investor positioning explained the dominant share of gold's recent performance, with real interest rates and the U.S. dollar playing more reliable roles than nominal rates alone.
Despite U.S. CPI hitting 9.1% in June 2022 and active geopolitical conflict in Europe, gold fell as much as 20% between March and November 2022 and returned only approximately 1.7% over the full tightening cycle, underperforming the MSCI World Index.
The evidence supports treating gold as a strategic allocation for portfolio diversification, tail-risk hedging, and long-run protection against currency debasement, rather than attempting to time it using Fed decisions, inflation prints, or geopolitical headlines.