Warsh Drives Real Yields to a 12-Month High, Pressuring Risk Assets
53 mins ago
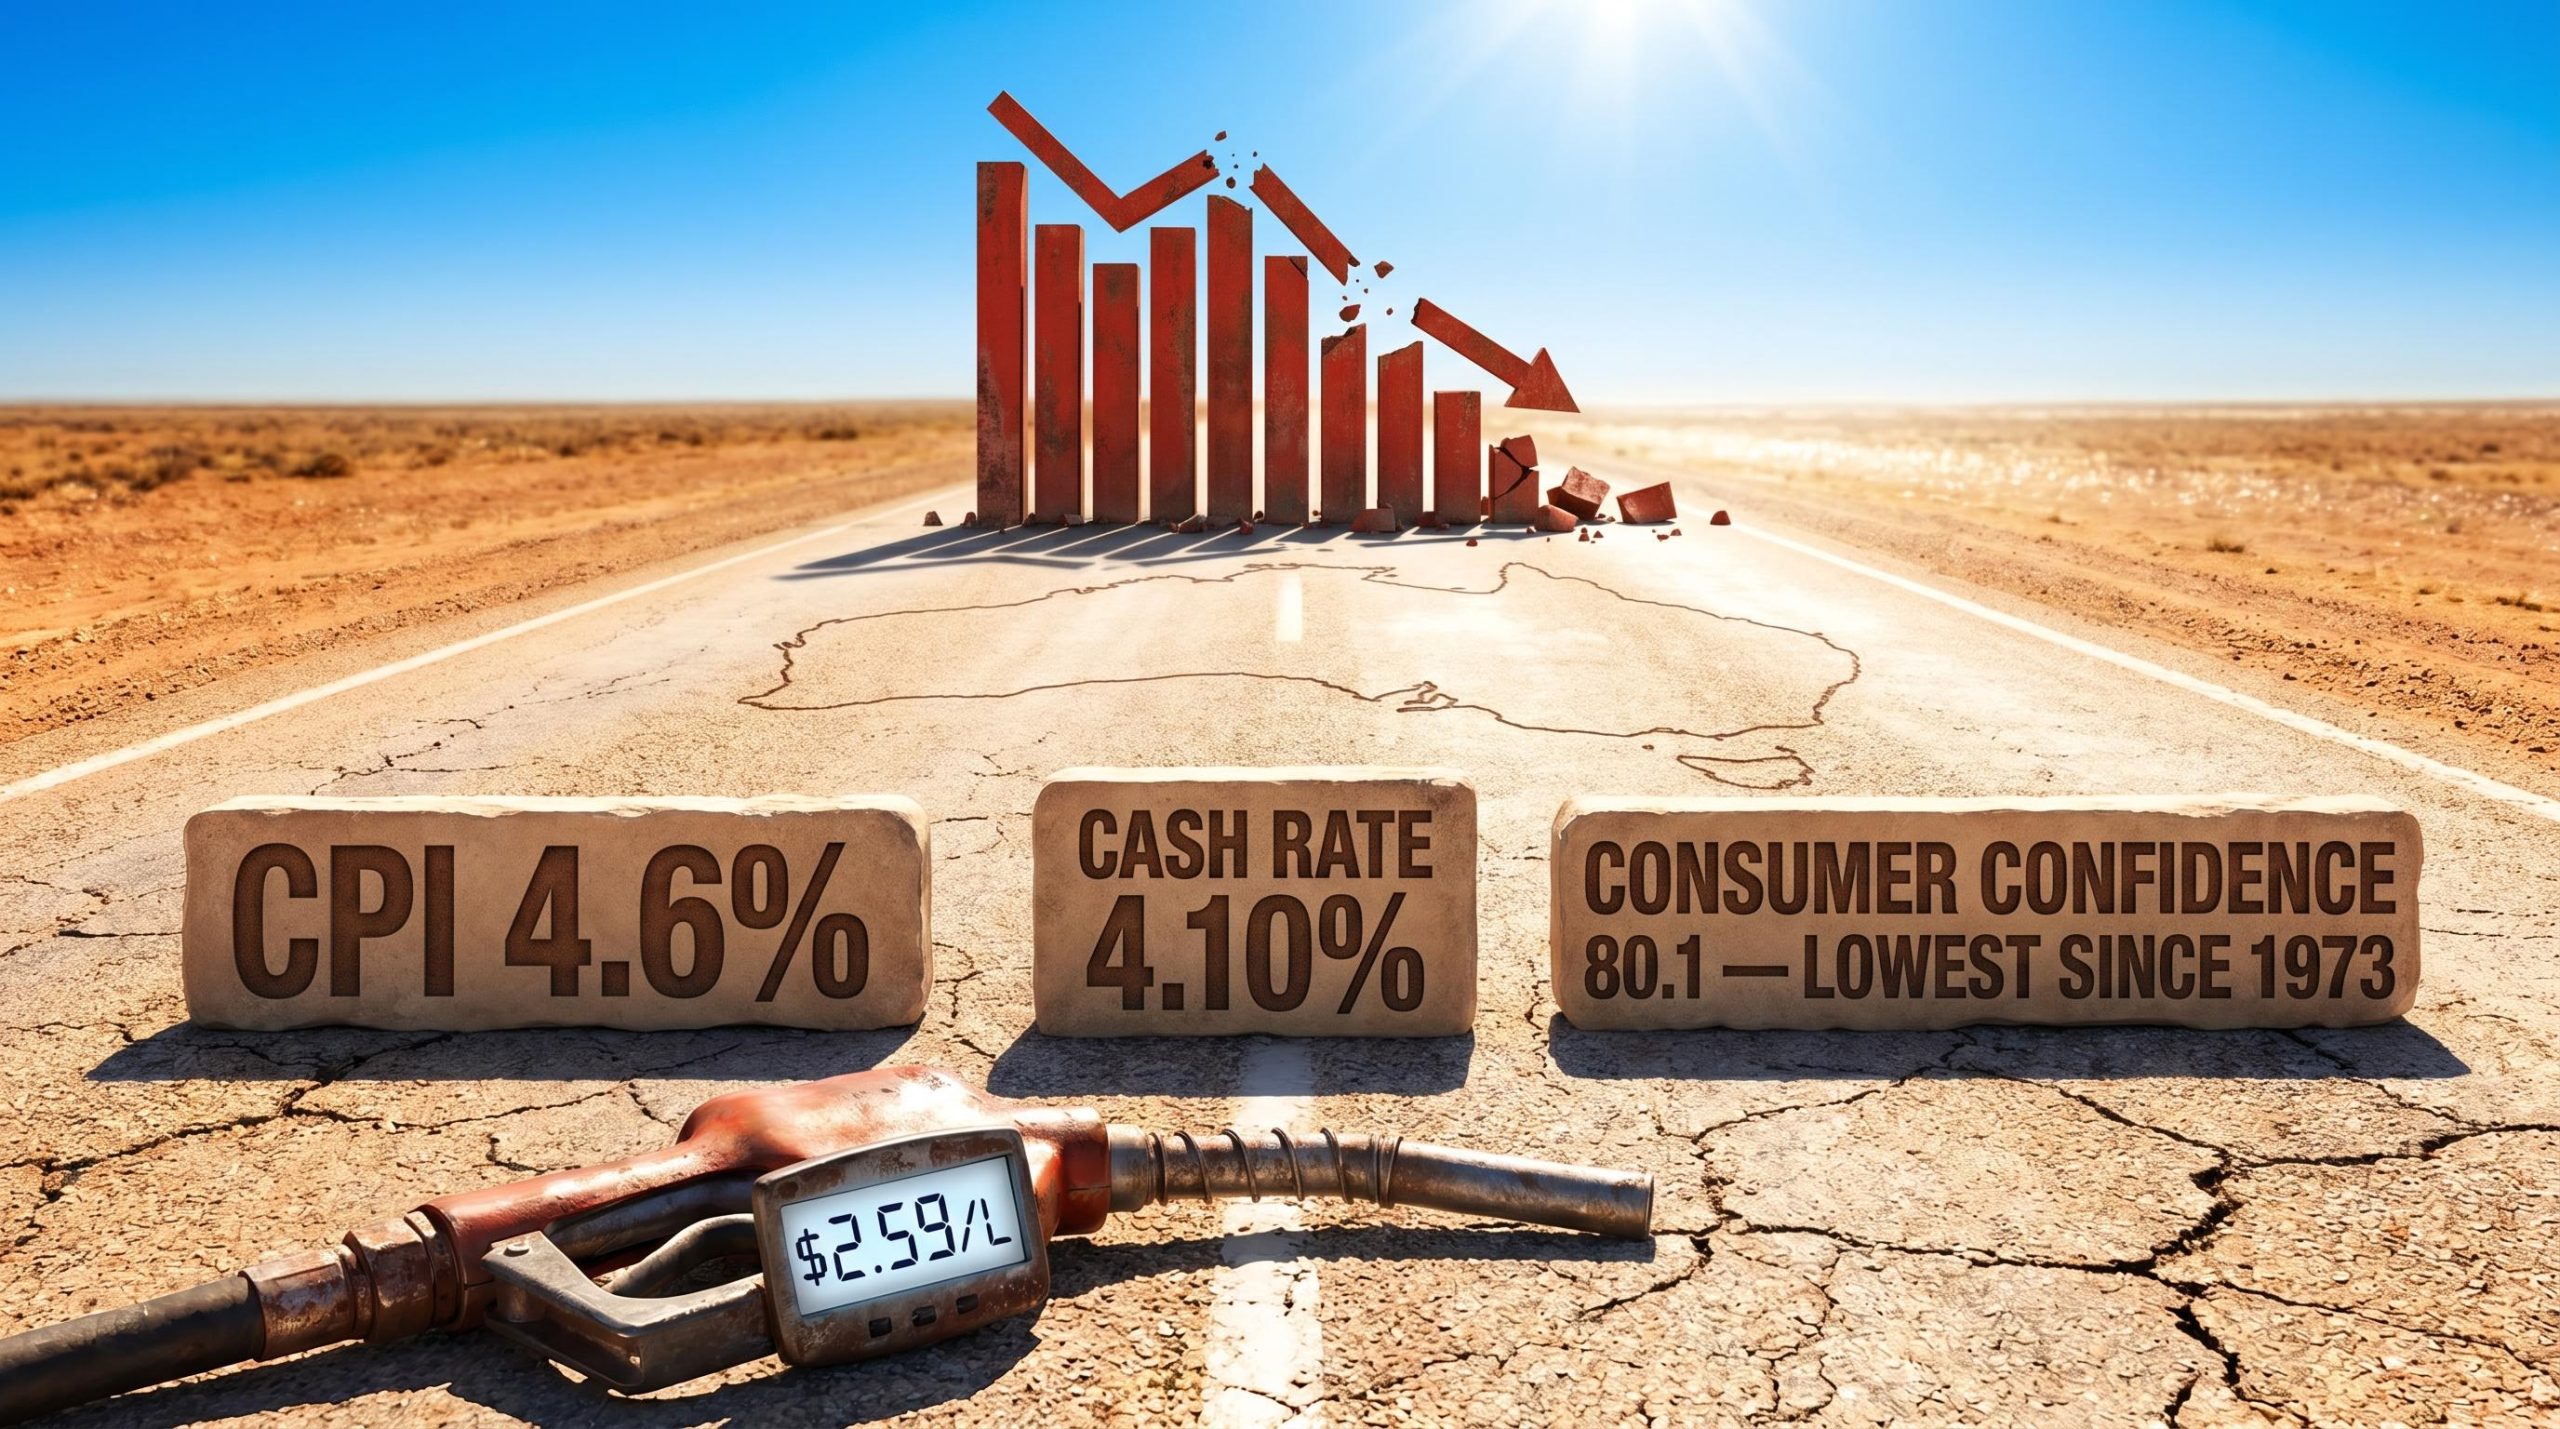
Australia’s consumer confidence index just posted its weakest reading since 1973. Diesel has nearly tripled in price since January 2026. The Reserve Bank of Australia (RBA) has raised rates twice in two months. Yet the most recent official gross domestic product (GDP) figures, from late 2025, still show 2.6% annualised growth.
Something does not add up. The gap between backward-looking economic statistics and the lived reality of Australian households has rarely been wider. A confluence of an Iran-linked energy shock, an aggressive rate-tightening cycle, and collapsing business and consumer confidence is producing conditions that economists are explicitly comparing to 1970s stagflation. What follows is an examination of each of these fault lines, why the official data flatters a picture that is deteriorating quickly, and what Australian households and investors should be watching in the weeks ahead.
Australia’s annualised GDP grew 2.6% in Q4 2025, the strongest pace in nearly three years. On its face, that figure suggests an economy with momentum. The trouble is that headline GDP measures the total size of the pie, not the size of each person’s slice.
When population growth outpaces economic output, the average individual’s share of that output shrinks even as the total expands. This is what economists call a per capita recession, and Australia has been in one for an extended period. The economy is technically growing; the standard of living for the median household is not.
The ABS national accounts for Q4 2025 confirm that while headline GDP grew 2.6% annually, GDP per capita rose only 0.4% in the December quarter, a figure that makes the per capita recession framing precise rather than rhetorical.
The temporal gap compounds the problem. GDP is a backward-looking measure, captured months before publication. More revealing real-time signals tell a different story:
April PMI cost inflation reached its highest level since August 2022, signalling that input prices are accelerating even as output barely holds above contraction territory.
The headline GDP figure describes where the economy was. These indicators describe where it is heading.
The numbers arrive at the petrol pump first. Australian diesel prices averaged approximately $0.90 per litre in January 2026. By 27 April 2026, that figure had reached $2.59 per litre, a near-tripling driven by the Strait of Hormuz closure triggered by US-Israeli strikes on Iran.
Australia sources approximately 80% of its fuel from overseas. Despite an 8 April ceasefire, maritime disruptions and a US naval blockade continue to suppress normalisation. Crude oil peaked near US$110 per barrel before retreating to approximately US$95 post-ceasefire, a level still well above pre-crisis pricing.
Research from fizz.org found that a $1 rise in petrol prices is equivalent to losing approximately $3,475 in monthly household income, capturing the cascading effect on transport, groceries, and discretionary spending power.
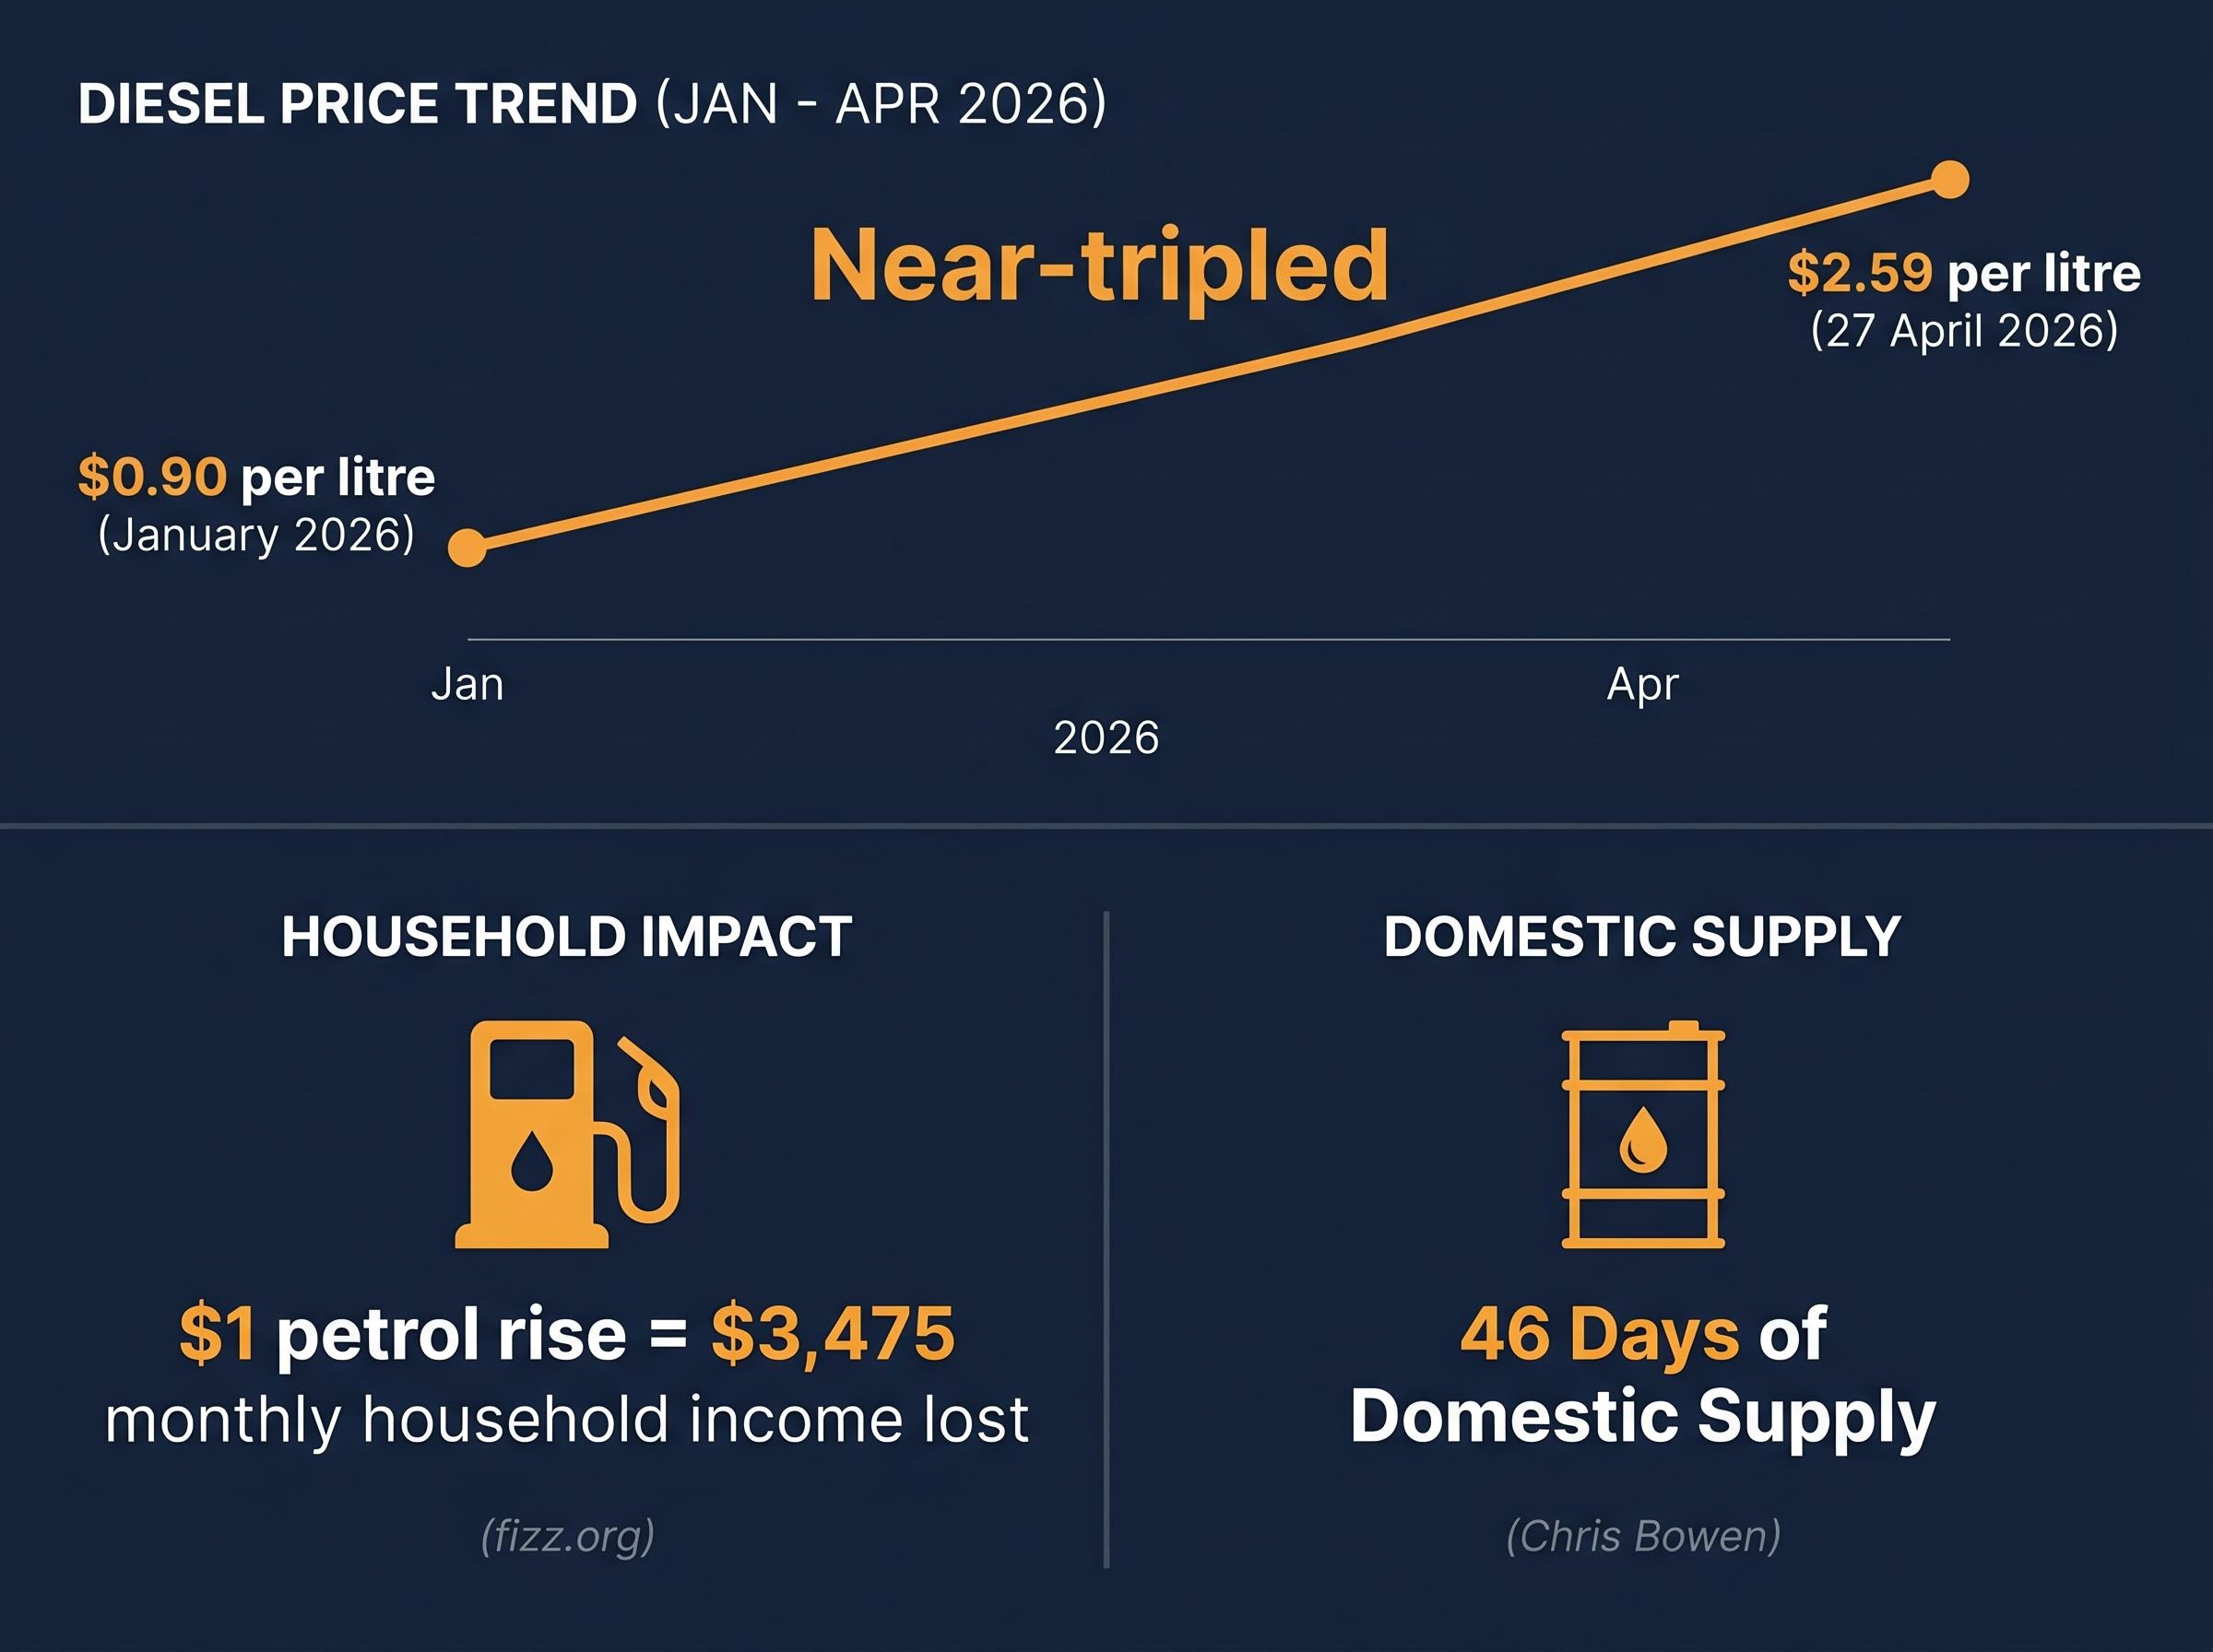
According to Westpac estimates, the fuel shock alone added more than 1 percentage point to headline inflation in March. Energy Minister Chris Bowen’s most recent statement placed Australia’s domestic petrol reserves at just 46 days of supply.
The pass-through extends well beyond the bowser. Fuel is an input cost for nearly everything Australians buy:
| Stage | Impact |
|---|---|
| Diesel price near-triples | Direct transport and logistics costs surge across all freight corridors |
| Fertiliser costs rise | Agricultural input prices increase, lifting farm-gate food prices |
| Food transport costs rise | Supermarket supply chains pass through higher freight charges |
| Grocery and construction prices climb | Households absorb compounding cost increases across multiple budget categories |
The fuel shock is not a single line item. It is an input multiplier rippling through the entire cost structure of Australian daily life.
Electricity and construction cost pressures compound the fuel shock in ways the petrol price headline does not capture: electricity costs rose 25.4% annually after the Energy Bill Relief Fund lapsed, and new dwelling construction costs accelerated to 0.48% month-on-month in March, more than triple February’s pace as oil-derived building materials absorbed the crude price surge.
Stagflation occurs when high inflation and weak or contracting economic growth arrive simultaneously. It is the condition central bankers fear most, because the standard tools for fighting one problem make the other worse. Raising interest rates to suppress inflation slows an economy that may already be stalling. Cutting rates to support growth risks entrenching inflation that is already running above target.
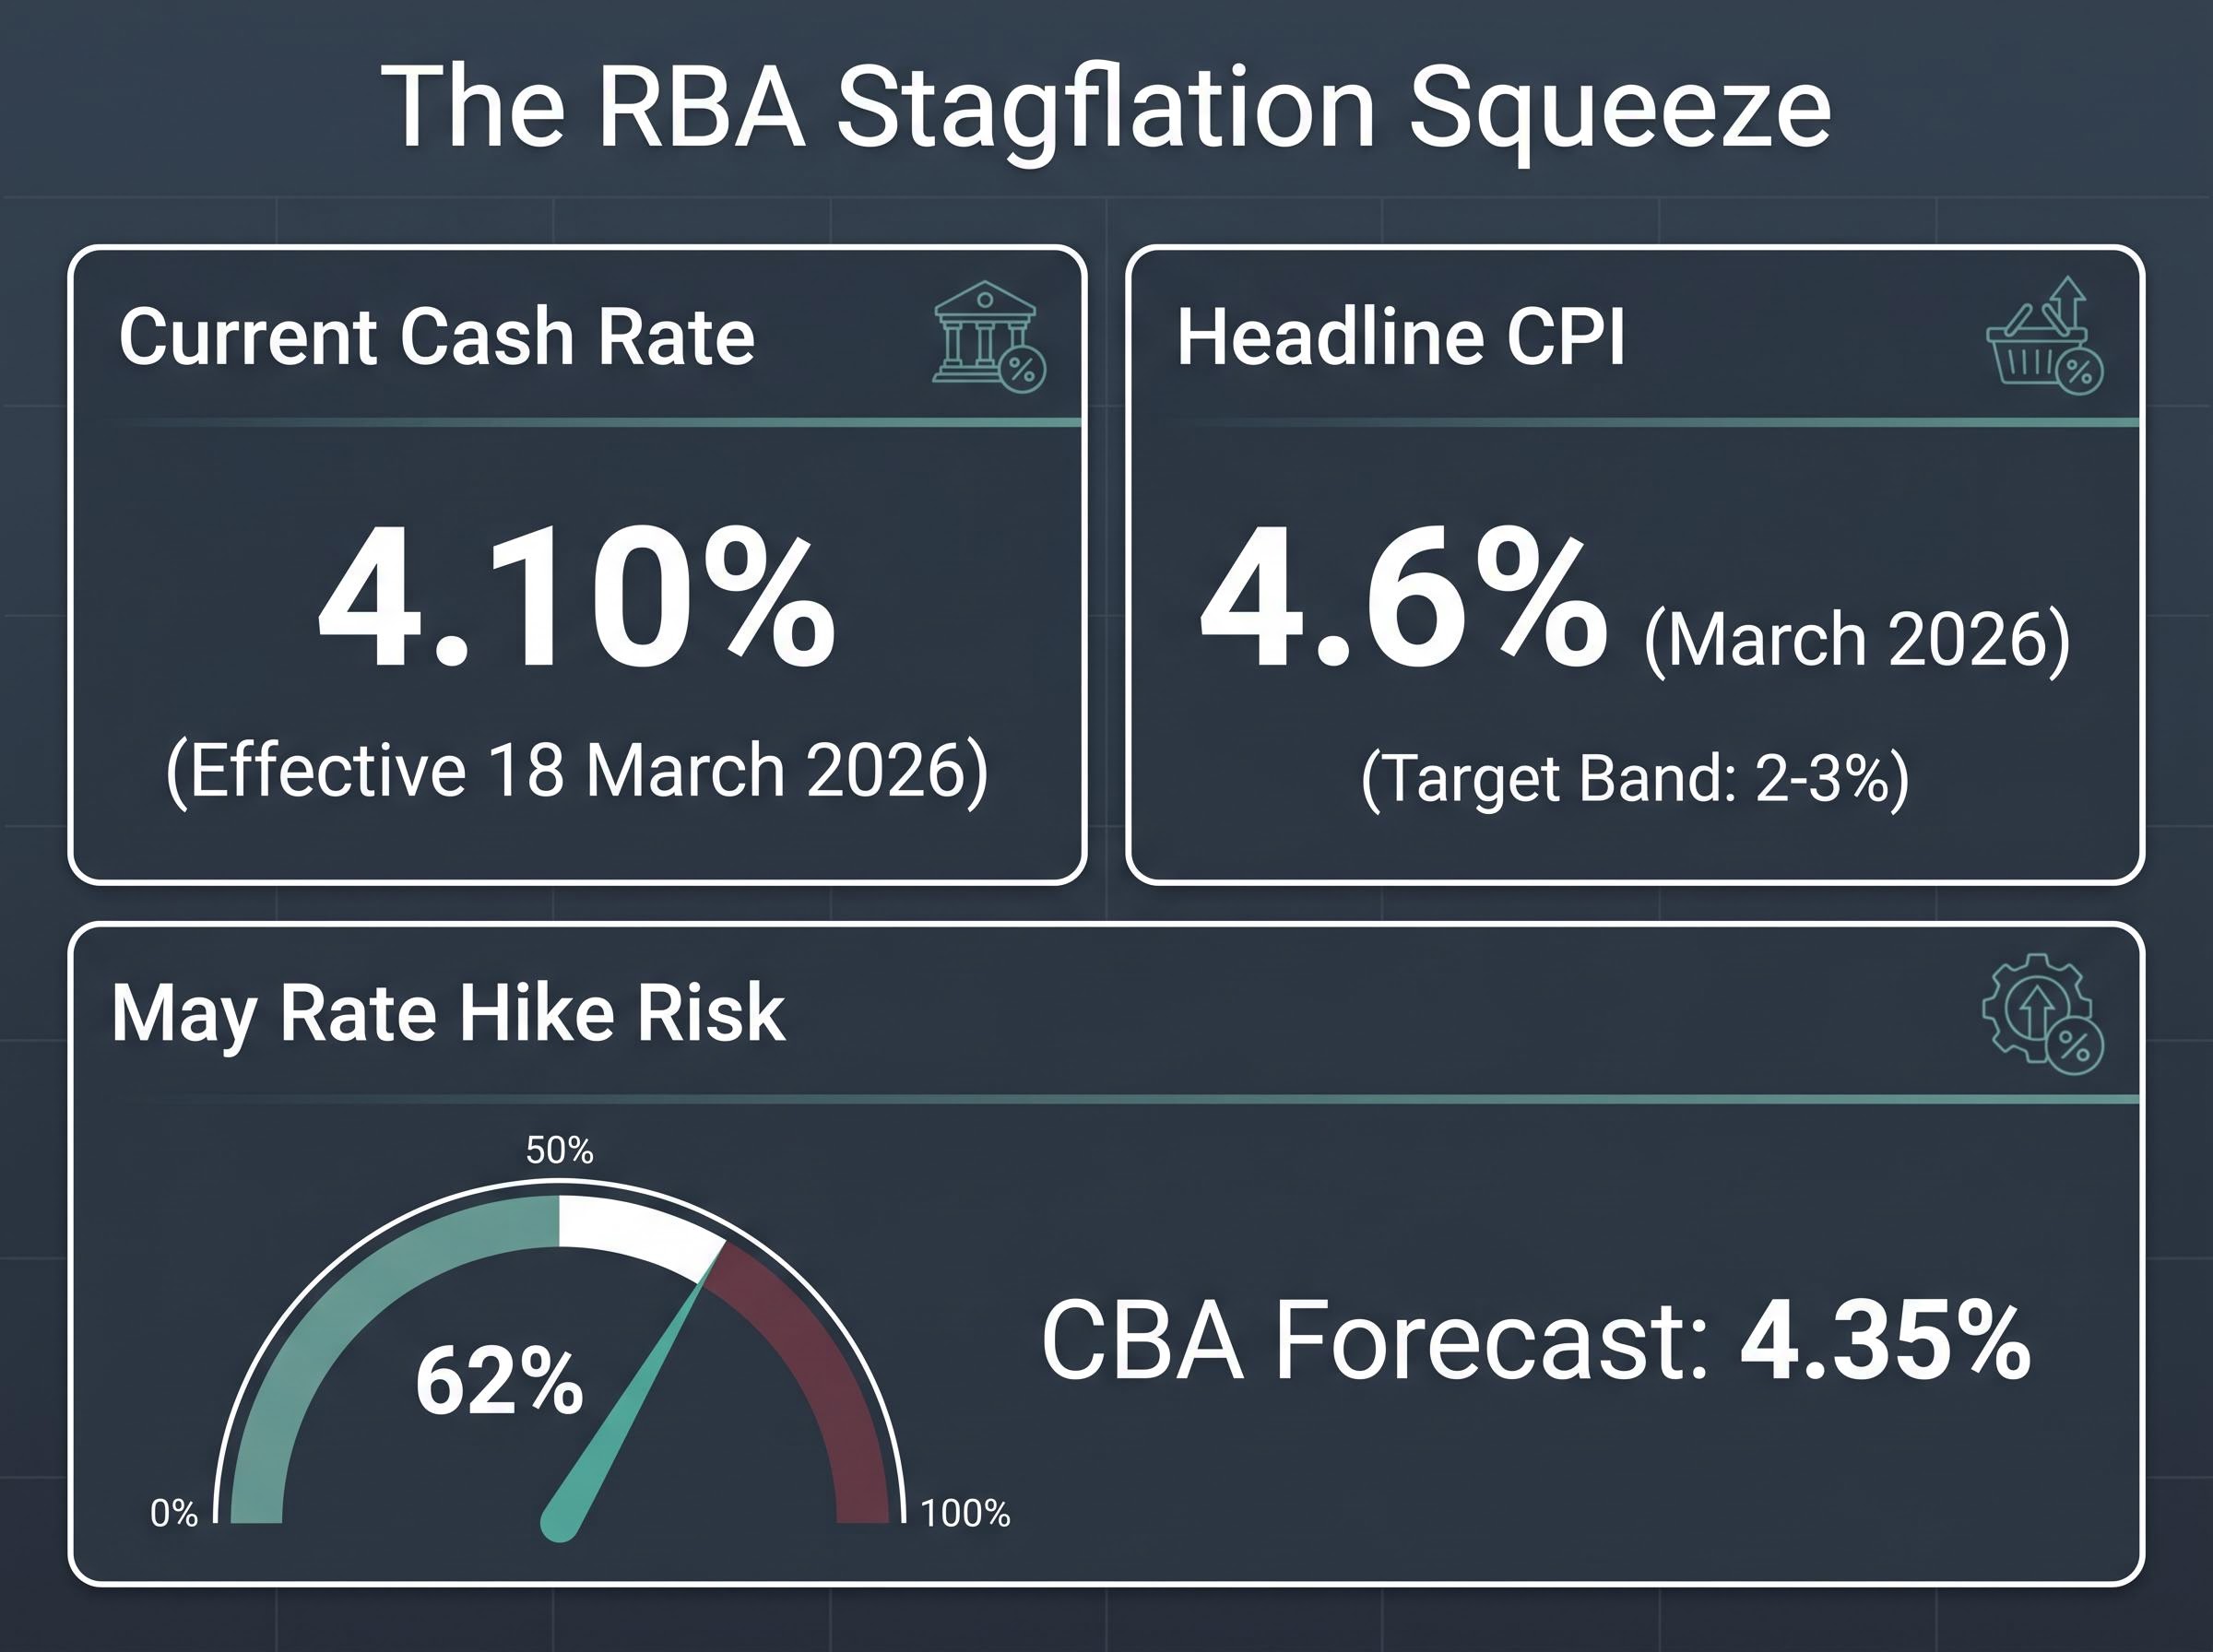
The RBA is living this dilemma in real time. The cash rate stands at 4.10%, effective since 18 March 2026, following two consecutive hikes in February and March. Headline consumer price index (CPI) inflation surged to 4.6% in March 2026, up from 3.7% in February, well above the RBA’s 2-3% target band. Trimmed mean inflation sits at approximately 3.5-4%, also above target.
RBA Deputy Governor Andrew Hauser described navigating stagflation as a “nightmare,” with the bank “feeling its way” through the crisis and uncertain whether rates at 4.10% are sufficient to contain inflation without tipping the economy into recession.
The policy dilemma breaks down into two equally unappealing paths:
Commonwealth Bank forecasts a potential third consecutive hike to 4.35% at the May 4-5 meeting, describing it as a “line-ball” decision. Market pricing assigns a 62% probability to a May rate increase. Every Australian with a variable-rate mortgage or business loan has a direct stake in the outcome.
For investors and mortgage holders trying to parse which CPI number actually drives RBA decisions, our dedicated guide to Australia’s headline versus trimmed mean inflation split examines why the 4.6% headline and the 3.3% trimmed mean tell such different policy stories, and what household inflation expectations reaching 5.9% could mean for second-round wage and price effects.
The severity of the confidence collapse is difficult to overstate. The Westpac-Melbourne Institute Consumer Sentiment Index fell 12.5% in April to 80.1, its lowest reading since the COVID-19 period.
The ANZ-Roy Morgan Consumer Confidence Survey recorded its weakest result since the survey’s inception in 1973, a benchmark that predates the 1990s recession, the global financial crisis, and the pandemic.
Two complementary surveys arriving at the same conclusion is not coincidence. It is confirmation.
The behavioural response is already visible:
Financial counsellors report mortgage stress as the leading concern at the National Debt Helpline, a signal that the rate hikes are translating directly into household-level distress.
Record-low confidence is not simply a mood indicator. It is the lead driver of the spending pullback that, if sustained, is the precise mechanism that converts a per capita recession into a technical one.
Australia’s unemployment rate held at 4.3% in both February and March 2026. That figure, taken in isolation, might suggest a labour market still providing a buffer against recession. The direction of movement tells a different story.
Unemployment has already begun trending higher rather than holding at a stable floor. More critically, the relationship between wages and prices has reversed:
Inflation has exceeded wage growth for the first time in two years as of early 2026, meaning Australian workers are receiving effective pay cuts without any change to their nominal salary. The brief period of real wage recovery has ended.
Three labour market signals, read together, paint a more complete picture than the headline unemployment rate alone:
CBA data shows households still absorbing higher petrol and utility costs rather than cutting back dramatically, suggesting the full adjustment phase may lie ahead rather than behind. Workers relying on low unemployment as a safety net face a risk that is already materialising through a different channel: the steady erosion of what their pay can actually buy.
The central view among analysts remains an extended period of very low growth rather than outright contraction. Total GDP can remain technically positive while per capita GDP continues to decline, a scenario in which the economy avoids the formal definition of recession while living standards continue to fall. This is the most likely path based on current data.
Three specific developments could convert the current slowdown into a technical recession, defined as two consecutive quarters of negative GDP growth:
Belinda Allen at CBA has drawn explicit comparisons to 1970s stagflation dynamics if oil prices persist at current levels. NAB forward orders are falling while purchase costs rise simultaneously, a combination that, according to the Bendigo Bank chief economist, raises the central policy question: whether the oil price shock will critically distort the supply-demand balance or whether the RBA can “look through” it without triggering recession.
Not all analysts accept that rates will remain elevated through mid-2027: oil futures backwardation signals the market views the Hormuz disruption as temporary, and historical supply shock cycles suggest a faster RBA policy pivot may follow within 6-12 months of a shock’s peak, particularly if Oxford Economics modelling of back-to-back GDP contractions in June and September 2026 proves accurate.
Past performance does not guarantee future results. These forward-looking assessments are subject to change based on market developments and geopolitical conditions.
Three forces are converging on Australian household budgets simultaneously: an energy shock that has nearly tripled diesel prices, a rate-tightening cycle that has lifted the cash rate to 4.10% with a potential third hike imminent, and a confidence collapse that is already reshaping spending behaviour. The result is a stagflationary squeeze with no easy policy exit.
The May 4-5 RBA meeting is the next major inflection point. CBA, ANZ, and NAB all project a further hike to 4.35%, and the market assigns a 62% probability to that outcome.
The indicators to monitor before and after the 5 May decision:
The official GDP figures will not tell the story in real time. These indicators will.
For investors who have absorbed the macro picture and want to translate it into portfolio positioning, our deep-dive into stagflation investing strategies for Australian portfolios examines why traditional safe havens are behaving differently in a supply-side shock, which asset classes are benefiting from the current environment, and how high cash buffers, hydrocarbon exporters, and short-duration fixed income fit together in a practical defensive allocation.
This article is for informational purposes only and should not be considered financial advice. Investors should conduct their own research and consult with financial professionals before making investment decisions.
Australia is not yet in a technical recession, but it has been in a per capita recession for an extended period, with GDP per capita rising only 0.4% in Q4 2025 even as headline GDP grew 2.6%. Analysts at Oxford Economics have modelled back-to-back GDP contractions in June and September 2026 as a plausible scenario if current conditions persist.
A per capita recession occurs when total economic output grows more slowly than the population, meaning the average person's share of national income shrinks even though the headline GDP figure remains positive. For Australian households, this means falling living standards despite official growth statistics that appear healthy on the surface.
Australian diesel prices rose from approximately $0.90 per litre in January 2026 to $2.59 per litre by 27 April 2026, a near-tripling driven by the closure of the Strait of Hormuz following US-Israeli strikes on Iran. Australia imports around 80% of its fuel, making it highly vulnerable to global oil supply disruptions.
Major banks including Commonwealth Bank, ANZ, and NAB are all forecasting a further rate hike to 4.35% at the May 4-5 RBA meeting, and market pricing assigns a 62% probability to that outcome. The decision hinges on whether the board believes inflation at 4.6% requires further tightening despite the risk of pushing an already weakening economy into recession.
Stagflation combines high inflation with weak economic growth, putting the RBA in a position where raising rates to fight inflation risks triggering a recession, while cutting rates risks entrenching inflation above its 2-3% target. For mortgage holders, this means prolonged periods of elevated repayments, while investors face a challenging environment where both equities and bonds can struggle simultaneously.