
Europe’s services sector just posted its weakest composite Purchasing Managers’ Index (PMI) reading in 31 months, while US manufacturing surged to 55.3 in the same flash release window. That divergence is not a rounding error; it is a structural signal worth interrogating.
The week of 19-26 May 2026 delivered a dense cluster of flash PMI prints, inflation readings, trade data, and labour market figures across the UK, Eurozone, Japan, and China. Taken individually, each number is a data point. Taken together, they reveal a global economy pulling in at least three distinct directions simultaneously, a pattern that rewards granular, region-by-region analysis rather than a single directional narrative.
What follows unpacks what the May 2026 data actually shows across major developed and emerging market economies, explains why the European services contraction is the most consequential single signal in the batch, and draws out the implications for investors holding internationally diversified portfolios.
Europe’s services sector just sent its clearest warning in over two years
The UK services PMI fell to 47.9 in May, down from 52.7 in April, a drop of 4.8 points that represents the largest single-month deterioration in the dataset. That is not a marginal softening. It is the kind of move that redraws the short-term growth picture for an economy where services account for roughly 80% of output.
The Eurozone confirmed this was not a UK-specific shock. Services PMI dropped to 46.4 in May from 47.6 in April, dragging the composite reading down to 47.5, a 31-month low.
The Eurozone composite PMI of 47.5 in May 2026 marks the lowest reading in 31 months, according to S&P Global’s flash PMI release.
Both readings crossed below 50 simultaneously. That threshold is mechanically significant: it marks the line between expansion and contraction. A reading of 49 signals slowdown. A reading of 47 signals outright shrinkage in activity.
The market-moving content of any PMI print is concentrated in its PMI surprise component rather than the absolute level, because equity markets typically pre-price directional PMI trends 3-30 months before the official survey release; the UK services drop of 4.8 points in a single month is therefore more analytically significant than the absolute reading of 47.9.
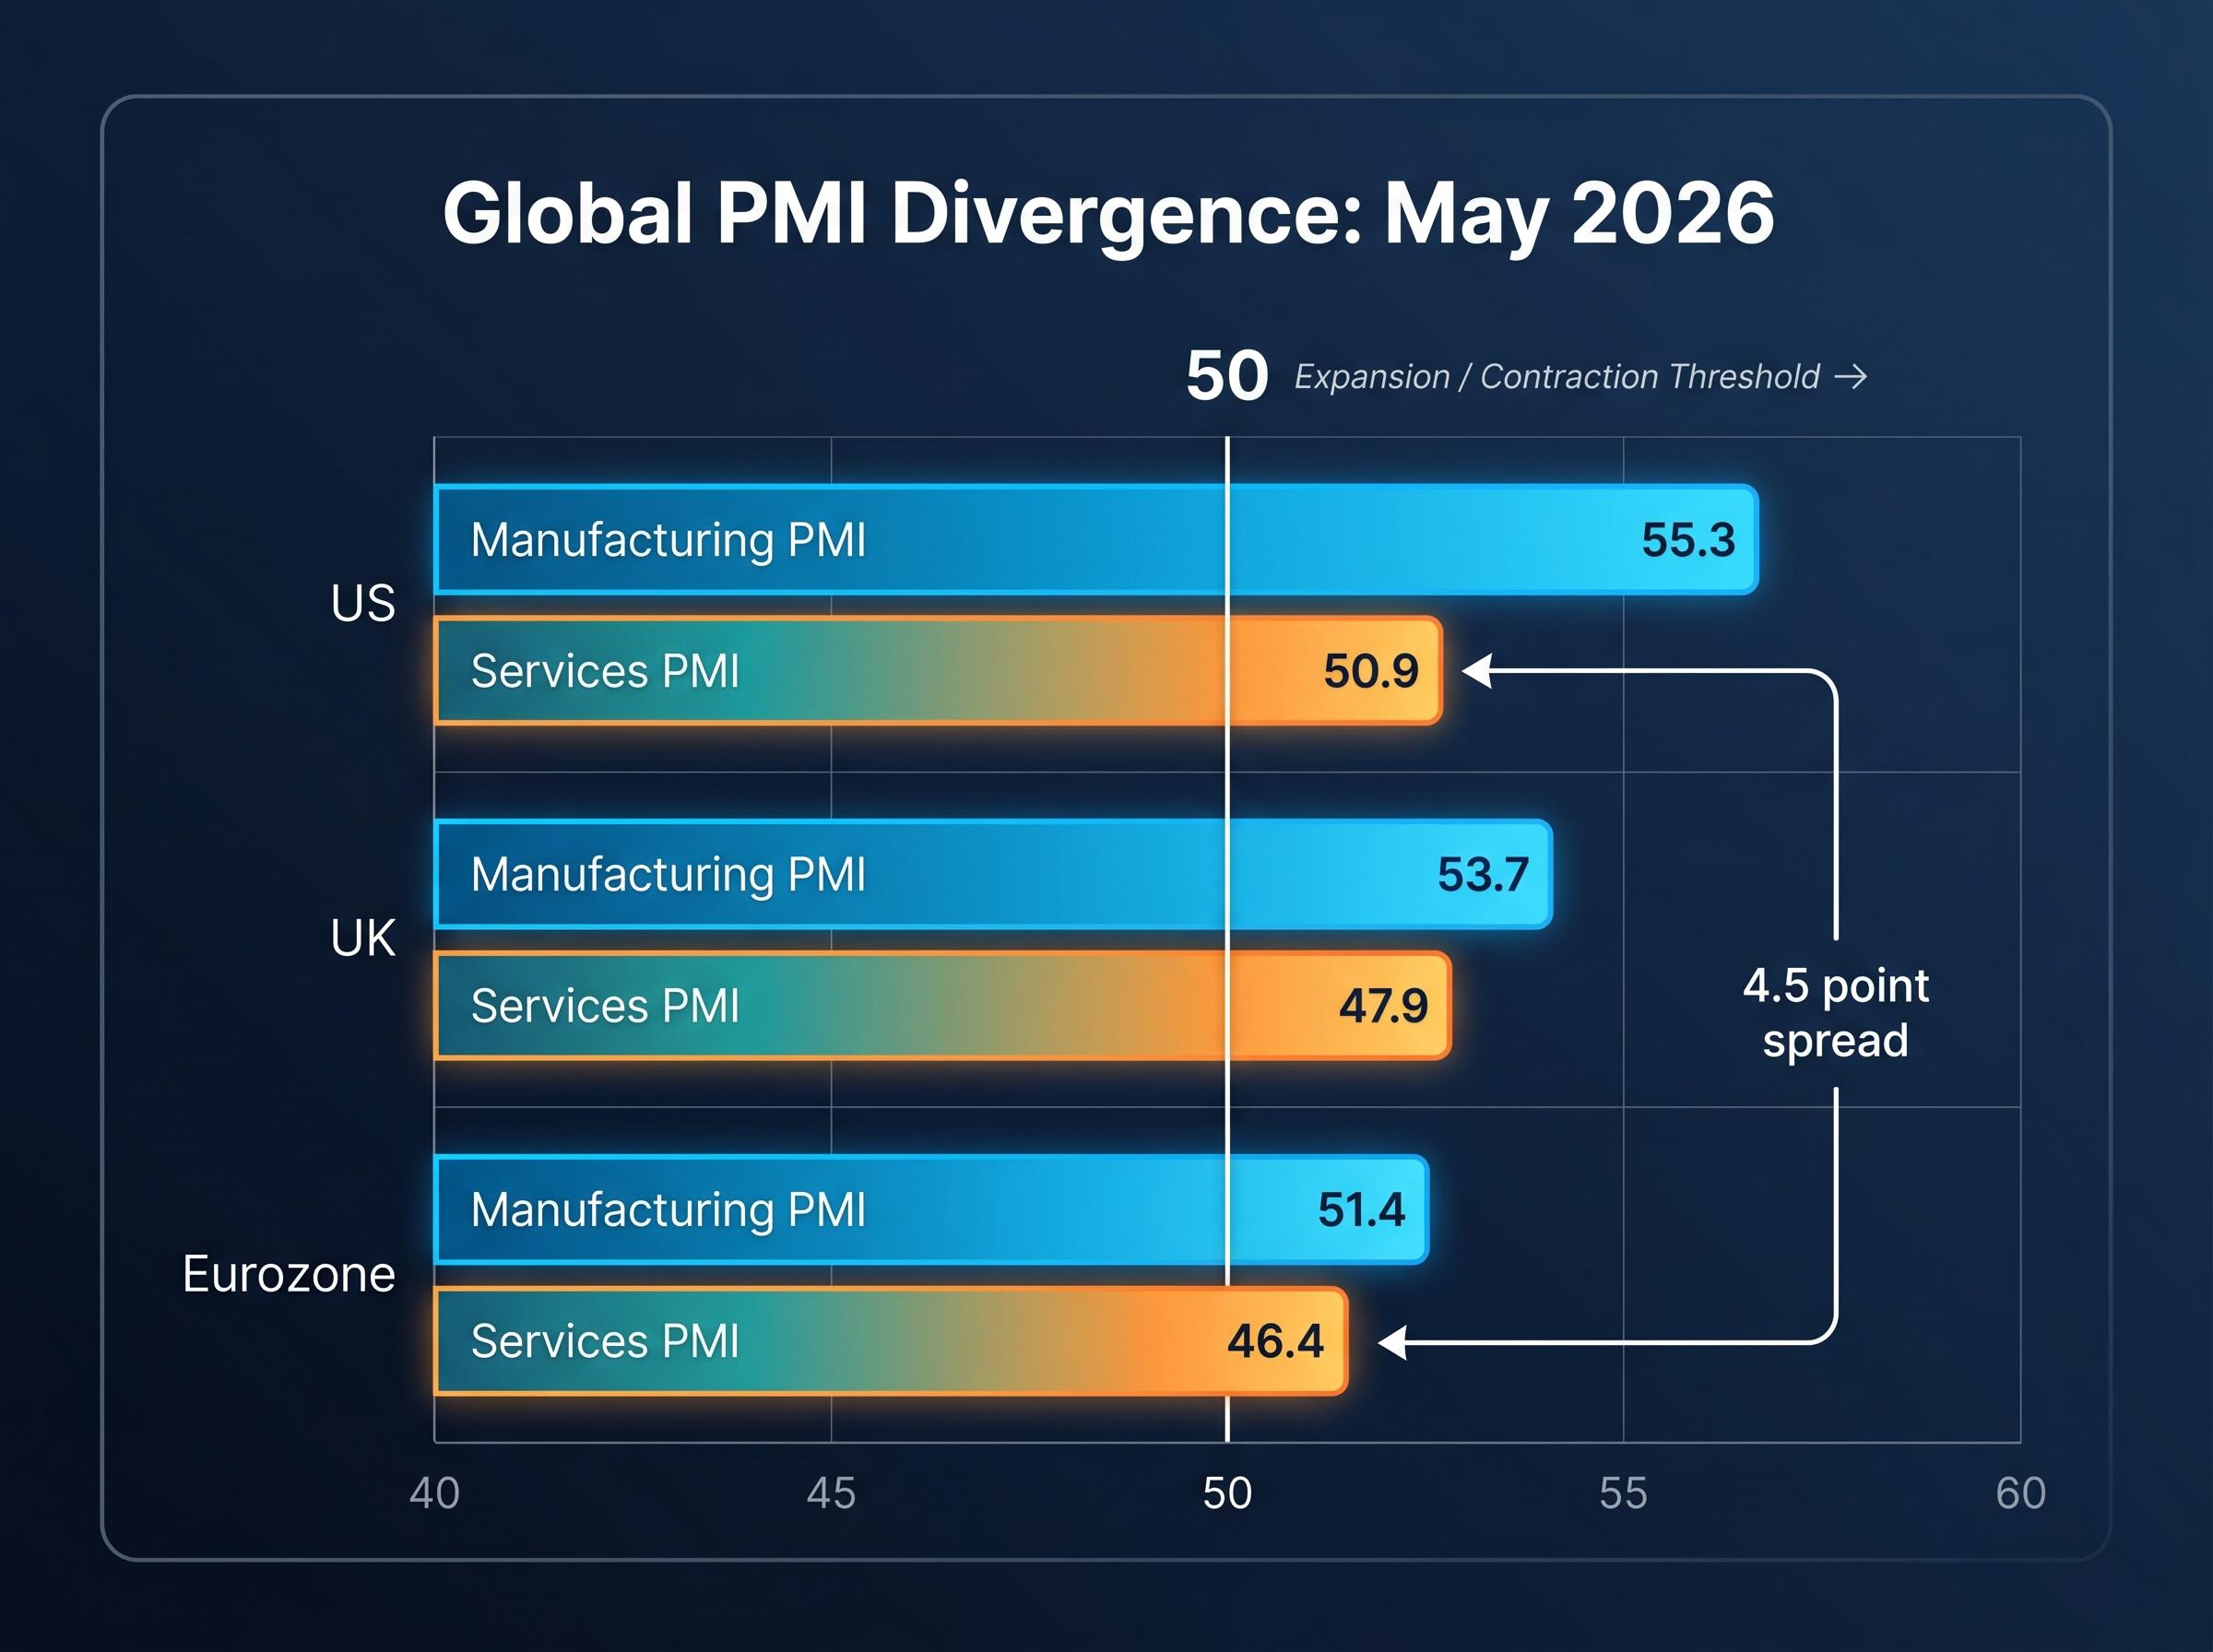
What makes this more specific is the sector split. UK manufacturing PMI held at 53.7, firmly in expansion. Eurozone manufacturing printed 51.4. The contraction is services-led in both economies, which means the weakness is concentrated in the sector that generates the majority of GDP.
| Indicator | April 2026 | May 2026 | Change |
|---|---|---|---|
| UK Services PMI | 52.7 | 47.9 | -4.8 |
| UK Manufacturing PMI | — | 53.7 | — |
| Eurozone Services PMI | 47.6 | 46.4 | -1.2 |
| Eurozone Manufacturing PMI | — | 51.4 | — |
| Eurozone Composite PMI | 48.8 | 47.5 | -1.3 |
For investors with European equity exposure, a simultaneous sub-50 services reading in both the UK and Eurozone carries more weight for earnings expectations than a manufacturing dip of equivalent size.
When big ASX news breaks, our subscribers know first
Why services inflation makes this contraction harder to resolve than it looks
The surface observation is straightforward: activity is contracting. The complication sits one layer beneath it.
PMI data captures more than output direction. Sub-components track input costs and selling prices alongside activity levels. In both the UK and Eurozone, the May services contraction is occurring alongside elevated input cost inflation in the same sector. That specific configuration, contracting output paired with rising costs, is what makes a clean policy response difficult. Central banks facing pure demand weakness can cut rates to stimulate activity. Central banks facing weak demand and sticky price pressures simultaneously face a narrower set of options.
The inflation data from April reinforces this tension:
- Eurozone headline CPI: 1.0% month-over-month, 3.0% year-over-year (in line with consensus)
- Eurozone core CPI: 2.2% year-over-year
- UK headline CPI: 0.7% month-over-month, 2.8% year-over-year (below analyst estimates)
- UK core CPI: 0.7% month-over-month, 2.5% year-over-year
The Bank of England’s narrow path
The UK presents the sharper version of the dilemma. Services PMI fell 4.8 points in a single month, yet services inflation remains above the 2% target zone. Unemployment moved to 5.0% in April (in line with consensus), and retail sales fell 1.3% month-over-month, adding labour market softening and consumer retrenchment to the picture. S&P Global’s commentary on the flash release noted that this combination “complicates” the Bank of England’s rate path. Growth is deteriorating fast enough to argue for cuts; prices are not falling fast enough to permit them freely.
The Bank of England Monetary Policy Report published in April 2026 flagged that services inflation had come in higher than expected, a finding that sits directly behind the institution’s reluctance to move quickly on rates despite deteriorating activity indicators.
The ECB’s easing case, with caveats
The Eurozone case is slightly different. A composite PMI at a 31-month low makes the strongest macro argument for easing that the ECB has faced in over two years. S&P Global noted that the data “reinforced expectations” of further easing. The caveat: services inflation in parts of the bloc continues to run above target, which limits the pace of any cutting cycle. Core CPI at 2.2% year-over-year is closer to target than headline 3.0%, but neither figure gives the ECB unconstrained room to move.
The distinction matters directly for bond and currency positioning. Central banks constrained by sticky services inflation produce a different rate environment from those with clear room to ease.
Central bank rate paths across the UK, Eurozone, Japan, and the US were already under pressure heading into this data release, with UK gilt yields having surged more than 25 basis points in the prior week alone, a move equivalent to a full standard rate adjustment compressed into five trading sessions.
The ECB April 2026 press conference confirmed the central bank’s continued focus on returning inflation to its 2% target sustainably, with policymakers acknowledging that services inflation across the bloc remained a complicating factor in calibrating the pace of any easing cycle.
Japan: Steady at the threshold, but not breaking through
Japan’s data tells a different story from Europe’s, neither alarming nor encouraging. The pattern is consistent: readings that hold their ground without generating upside momentum.
The macro backdrop is positive but modest. Q1 2026 GDP came in at 0.5% quarter-over-quarter and 0.6% year-over-year on a preliminary basis. The flash PMI data for May added a mixed signal: manufacturing at 54.5 (below expectations but solidly expansionary) and services at exactly 50.0, sitting precisely on the expansion-contraction boundary.
A services PMI of 50.0 is analytically distinct from Europe’s clear sub-50 prints. It is not contraction. But it is a below-forecast miss that suggests domestic demand is not accelerating.
- Q1 2026 GDP: 0.5% quarter-over-quarter, 0.6% year-over-year (preliminary)
- May flash manufacturing PMI: 54.5 (below expectations, solidly expansionary)
- May flash services PMI: 50.0 (exactly at threshold, below expectations)
- April exports: up 14.8% year-over-year
- April imports: up 9.7% year-over-year
- April headline CPI: 0.1% month-over-month, 1.4% year-over-year
- April core-core CPI (excludes fresh food and energy): 1.9% year-over-year
- March retail sales: up 1.4% month-over-month
- March industrial production: down 0.4% month-over-month, up 2.4% year-over-year
Japan’s April exports rose 14.8% year-over-year, the standout positive datapoint in the Japan dataset and a signal of underlying industrial competitiveness even as services momentum stalls.
That export figure, combined with contained inflation and a manufacturing PMI of 54.5, suggests Japan’s external-facing industrial sector is performing well. For investors considering Japanese equity exposure, the divergence between Japan’s manufacturing strength and Europe’s services contraction may represent a meaningful sector allocation distinction.
China holds steady, but the detail is in what did not beat expectations
China’s April data sketches an economy performing in line with, or just short of, what the market expected. The signal is not in the direction of growth but in its quality.
- April retail sales: up 1.9% year-over-year (in line with consensus)
- April industrial production: up 4.1% year-over-year (below expectations)
- April unemployment rate: 5.2% (slightly below consensus)
- April manufacturing PMI: 50.3 (most recent available reading)
Retail sales meeting consensus is a genuine positive for the domestic demand story. Industrial production underperforming is the more telling signal: the manufacturing engine is not accelerating. The unemployment rate at 5.2%, marginally below consensus, provides a mildly positive labour market backdrop without meaningfully shifting the broader picture.
One data gap warrants attention: China’s May 2026 official PMI figures had not been published as of 26 May 2026. The China analysis here relies on April data, making it lagged relative to the flash PMI readings available for Europe and Japan. Investors should treat this section accordingly.
An industrial production miss alongside in-line retail sales suggests domestic consumption is holding but export-driven manufacturing momentum is softening. For globally diversified portfolios, that distinction shapes expectations for commodity demand and Asian supply chain stability.
The US as global counterweight: expansion where others are contracting
The US flash PMI data provides the sharpest contrast in the May 2026 global dataset.
US flash manufacturing PMI printed at 55.3 in May 2026, the strongest single-economy manufacturing signal in the global dataset and a clear counterpoint to Europe’s 31-month low composite reading.
Services PMI came in at 50.9, holding above 50 at a time when both the UK (47.9) and Eurozone (46.4) have fallen into contraction. The US is expanding in both manufacturing and services simultaneously, while Europe contracts in its dominant sector. That is not a marginal gap. The US-Eurozone services PMI spread of 4.5 points captures the divergence in a single number.
The FOMC dissent at the April 29 decision, where four committee members split publicly over the appropriate rate path, means the Federal Reserve enters the May data cycle with an unusually fractured internal posture; incoming US PMI strength at 55.3 in manufacturing and 50.9 in services gives the hawkish majority more empirical support to resist any premature pivot.
The framing here matters for portfolio construction, not just US domestic economic analysis. A US economy expanding against a Eurozone at a 31-month composite low creates conditions for continued US dollar strength and raises questions about European equity valuations relative to earnings risk.
Three upcoming US data releases could either reinforce or complicate the expansion narrative:
- US Q1 GDP estimate
- April durable goods orders
- April new home sales
These were scheduled for release in the week following 22 May 2026 and will provide the next layer of confirmation or complication for the US growth picture.
What the divergence means for portfolios positioned across these markets
The May 2026 data batch presents a global economy operating in distinct modes: Europe contracting in services with constrained central bank responses, Japan steady but below forecast with strong export performance, China meeting modest expectations without acceleration, and the US expanding in both manufacturing and services.
For investors holding internationally diversified portfolios, the analytical consequence is a set of diverging central bank trajectories. The ECB and Bank of England face constrained easing cycles where sticky services inflation limits how aggressively they can cut into weakening growth. The Bank of Japan remains at an inflation inflection point with core-core CPI at 1.9%. The Federal Reserve’s posture will be clarified by incoming Q1 GDP data.
The US-Eurozone services PMI gap (50.9 versus 46.4) is the clearest single numerical expression of the divergence and its potential implications for relative equity and currency performance.
Several forward-looking signals will shape the next iteration of this analysis:
- China’s May official PMI (expected imminently)
- Japan’s April industrial production data
- US Q1 GDP estimate
- ECB forward guidance at the next policy meeting
Investors who treat the global economy as a single directional story risk misreading the current environment. The data released in the week of 19 May 2026 collectively argues for a more granular, region-by-region approach to assessing equity and fixed income exposure across developed and emerging markets.
A global economy in three gears: how to read what comes next
The May 2026 data batch is not a single global economic story. It is three distinct gear settings operating simultaneously: Europe contracting in services, Asia holding without breaking higher, and the US expanding with manufacturing leading the way.

The most consequential single data point in the batch is the Eurozone composite PMI at a 31-month low of 47.5. For forward-looking investors, that reading deserves more analytical weight than headline inflation figures because it captures real-time activity deterioration in the bloc’s dominant sector.
The week ahead brings two releases that could deepen or complicate the Asia-Pacific portion of this picture: China’s May PMI and Japan’s April industrial production. If both print below expectations, the “Asia holding” gear shifts closer to “Asia softening,” and the US expansion story becomes an even more isolated bright spot.
The framework for reading what comes next is regional divergence, not global consensus. Position accordingly.
For US-based investors assessing how much European and Asian exposure to hold against the backdrop of this divergence, our full explainer on US equity home bias risk examines the structural overweight most US portfolios carry versus global benchmarks, quantifies the valuation gap between US and non-US markets, and outlines the institutional reallocation away from domestic large-caps that is already underway.
This article is for informational purposes only and should not be considered financial advice. Investors should conduct their own research and consult with financial professionals before making investment decisions.