The sector that spent the better part of a decade being ignored while technology rewrote the rules of modern investing now carries the highest valuation in the world. The sector is Industrials.
Goldman Sachs strategists, led by Peter Oppenheimer, have identified a capital expenditure super cycle that extends well beyond the technology industry, one that is structurally lifting the investment appeal and valuations of sectors most portfolios have underweighted for years. The forces feeding it, AI infrastructure buildout, energy transition spending, reshoring, and defence budgets, are multi-year, policy-supported commitments. This is not a sentiment-driven rotation. It is a structural repricing of what the global economy needs to build.
Here is what the data actually tells you about how the capex super cycle is rewarding capital-intensive sectors, what that means for portfolios still concentrated in U.S. mega-cap tech, and where the analytical limits of the thesis sit at current valuations.
Why AI turned into an infrastructure story, not a software story
Most investors still think of AI as a software story: algorithms, data, large language models. The most economically consequential phase of the current AI cycle tells a different story. It is physical. Data centres, electrical grid upgrades, cooling systems, specialised construction, and engineering capacity are where the spending is actually flowing.
Goldman Sachs captures this through its HALO framework, which stands for Heavy Assets, Low Obsolescence. The framework identifies asset-heavy, infrastructure-rich businesses with low obsolescence risk as the primary beneficiaries of the AI spending wave. These are the companies building the physical layer that makes AI possible.
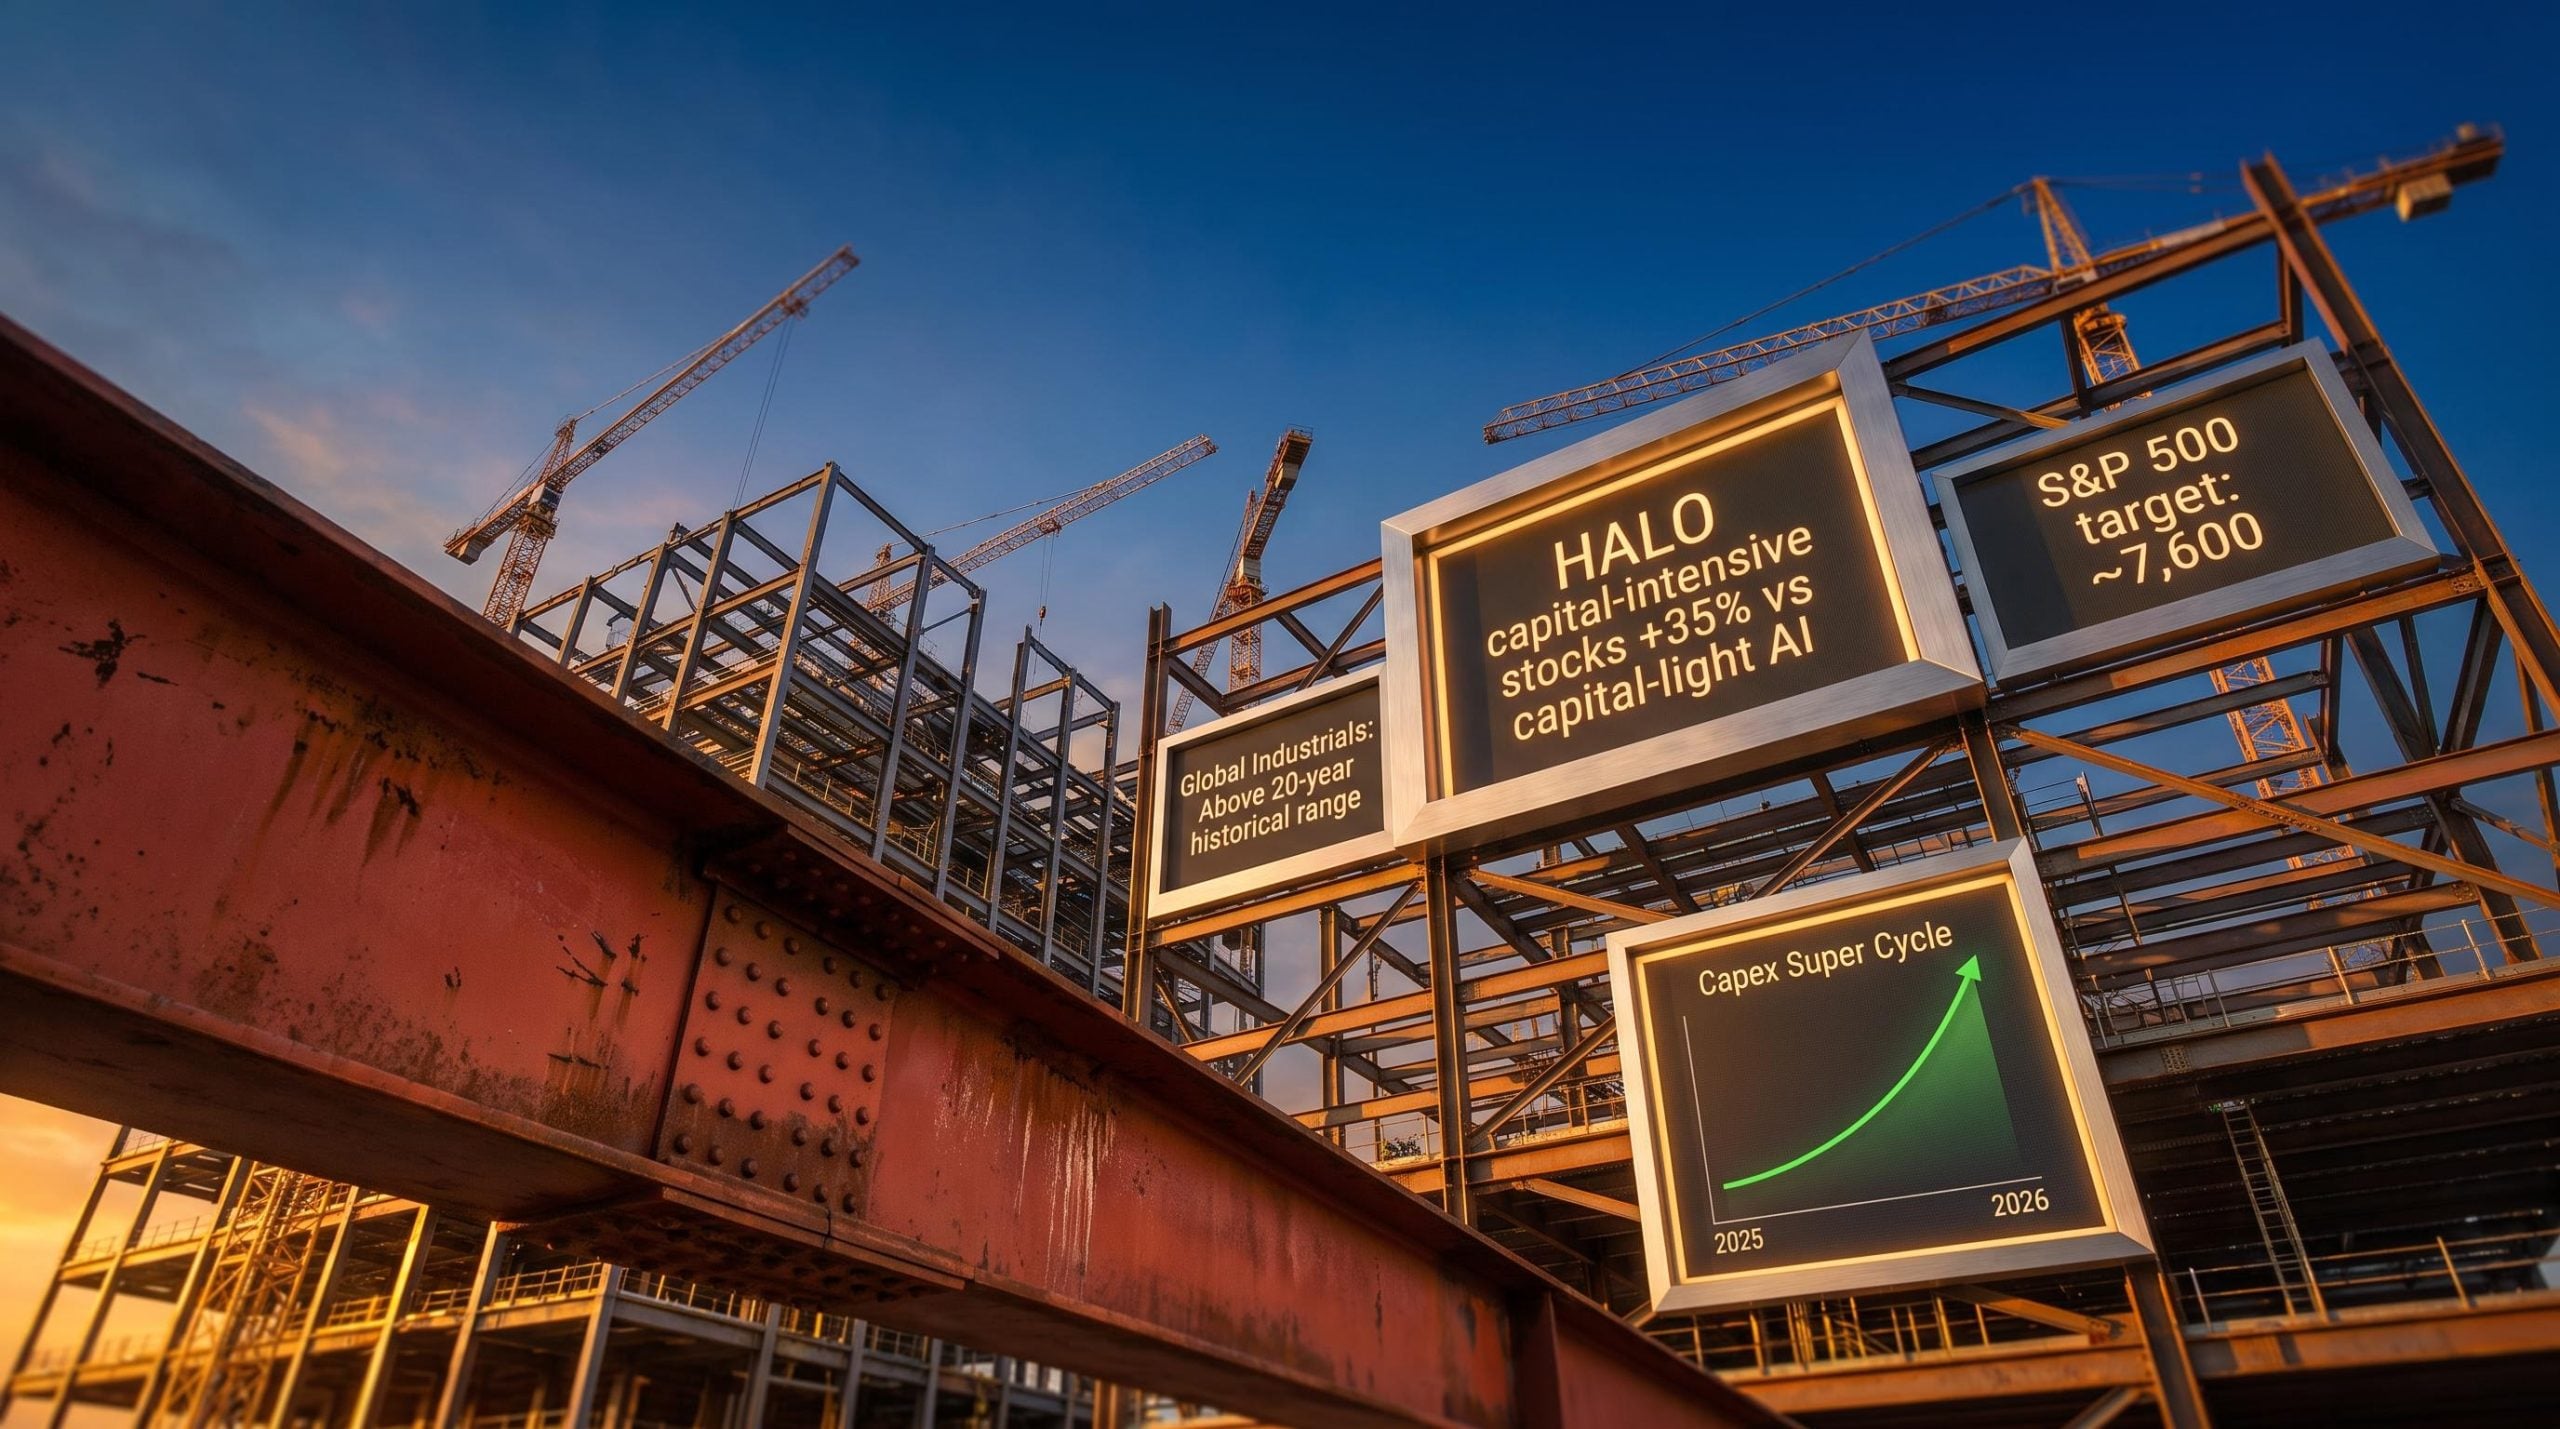
The performance gap makes the case empirically. A basket of HALO capital-intensive stocks has beaten a capital-light AI and software group by approximately 35% since early 2025. That is not a marginal difference. For investors who stayed concentrated in software-layer AI names, that 35% gap is the cost of misreading which part of the AI cycle the market was pricing.
HALO beneficiaries span a wide range of physical infrastructure:
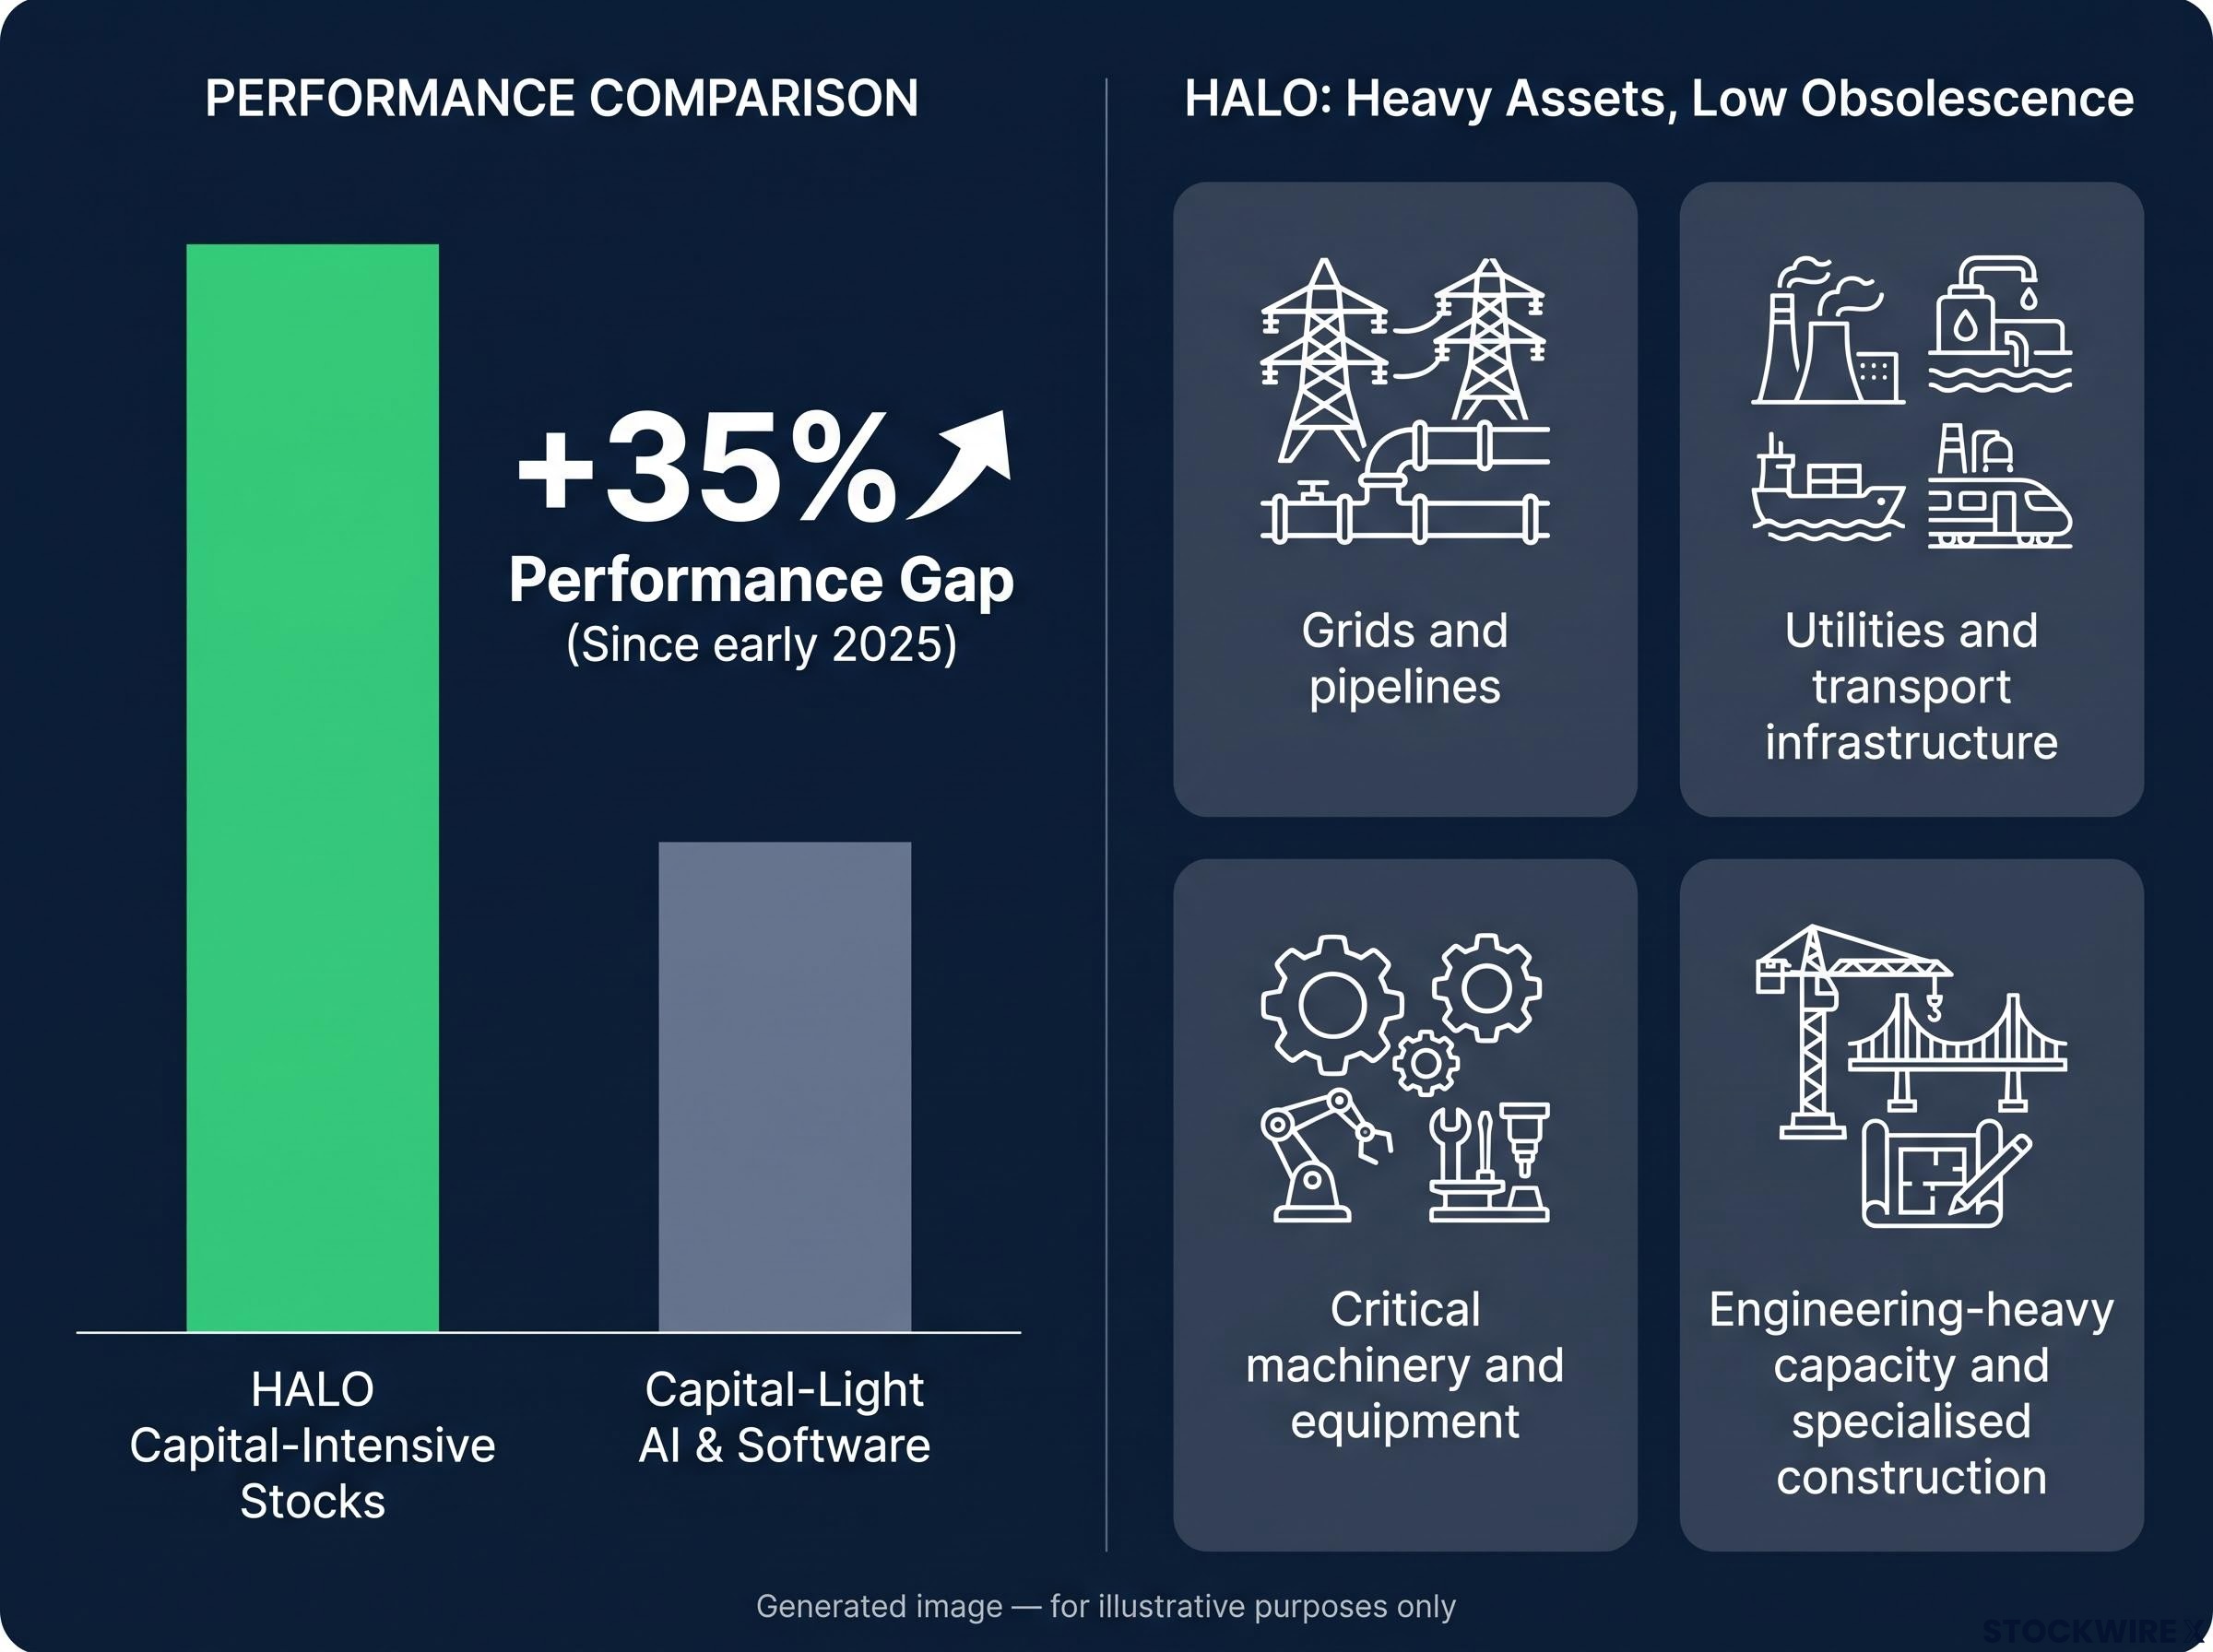
- Grids and pipelines
- Utilities and transport infrastructure
- Critical machinery and equipment
- Engineering-heavy capacity and specialised construction
Goldman Sachs’s HALO note states that software names tied to labour-intensive workflows are “absorbing the pain of a deliberate and deepening sell-off,” while asset-heavy businesses are being rewarded.
The distinction matters because it reframes the entire AI investment thesis. The winners are not the companies writing the code. They are the companies pouring the concrete, pulling the cable, and upgrading the grid.
AI infrastructure stocks positioned at the cycle’s physical bottlenecks, power availability, cooling density, and grid interconnection timelines, follow the same compounding logic as the railroad operators and telegraph companies that captured durable value in previous technology revolutions rather than the headline technology providers themselves.
When big ASX news breaks, our subscribers know first
The four forces feeding the cycle
The capex super cycle is not a single trade. It is four overlapping spending waves, each with independent policy support and multi-year duration. That convergence is what gives the thesis its structural character, because no single policy reversal or macro shift can shut down all four simultaneously.
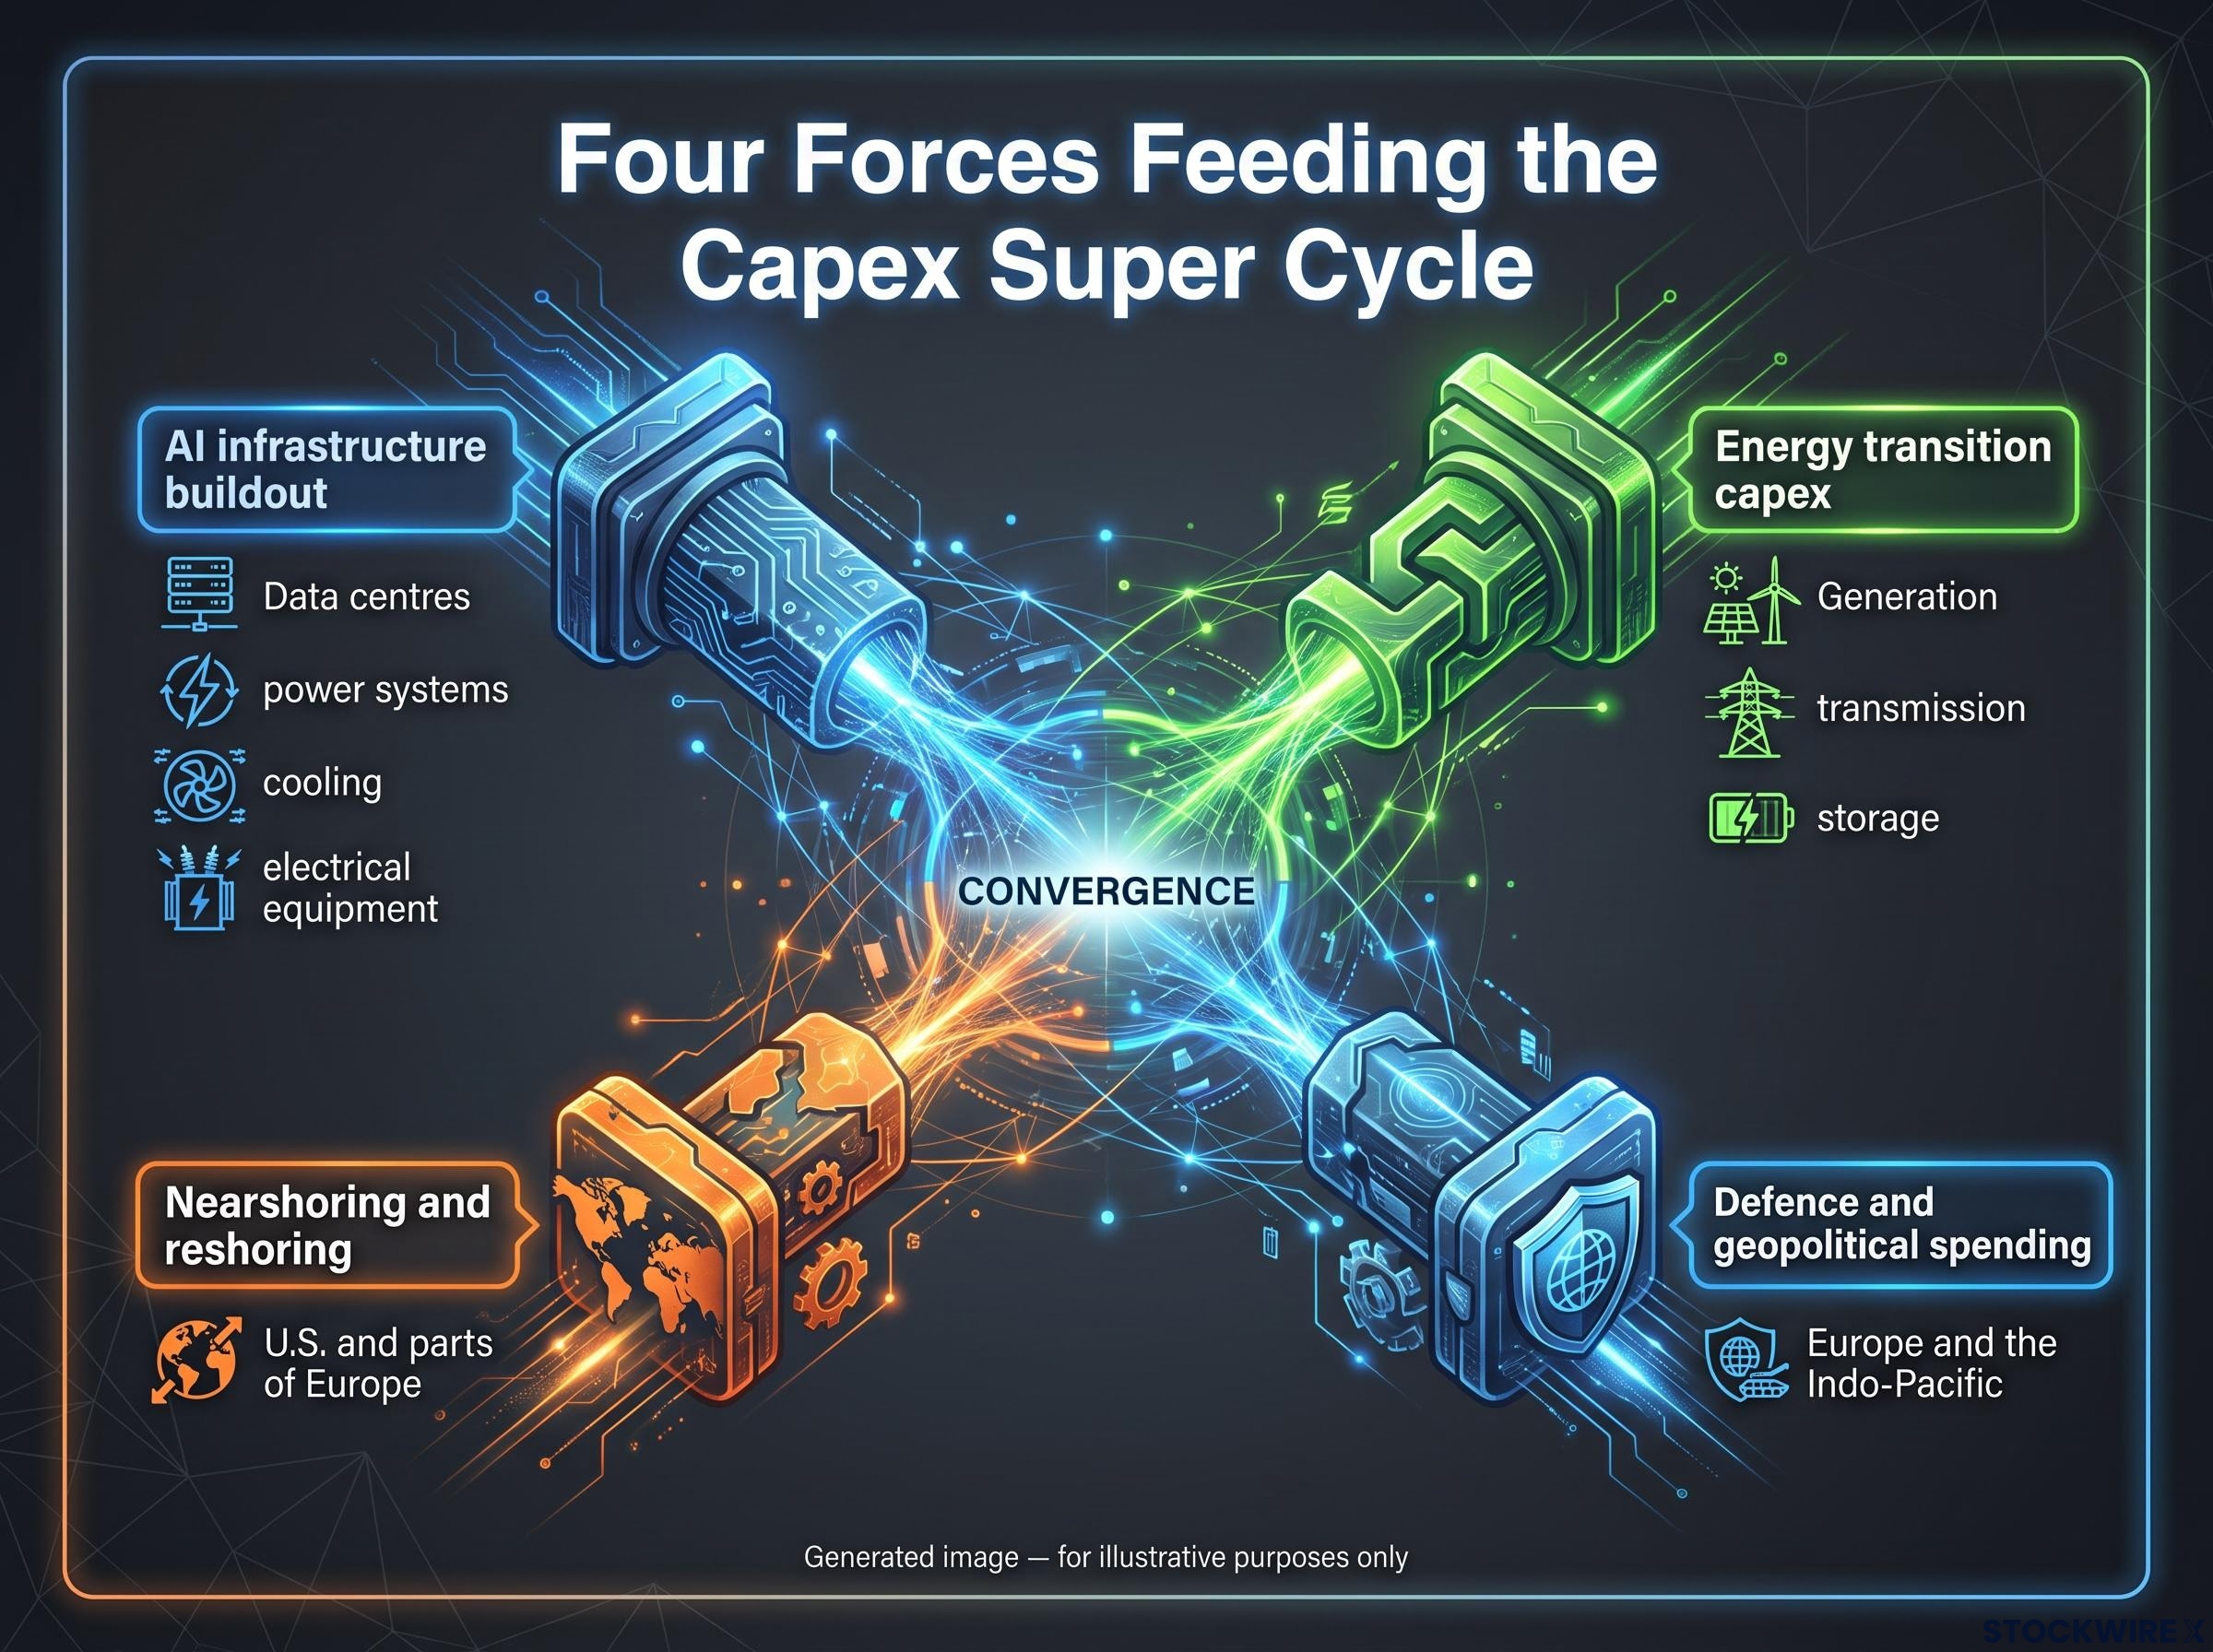
- AI infrastructure buildout: Data centres, power systems, cooling, electrical equipment, and specialised construction and engineering. This wave alone has rewritten demand forecasts for industrial capacity across multiple regions.
- Energy transition capex: A multi-trillion-dollar investment theme spanning generation, transmission, and storage. Utilities, equipment makers, and industrials are the direct beneficiaries of what amounts to a wholesale rebuild of energy systems.
- Nearshoring and reshoring: A resurgence in domestic manufacturing and factory construction across the U.S. and parts of Europe. This is structural support for industrials and cyclicals that did not exist five years ago.
- Defence and geopolitical spending: Elevated defence budgets and aerospace-defence demand, particularly in Europe and the Indo-Pacific, are providing sustained order books for parts of the industrial complex.
Each wave has its own economic and policy logic. AI infrastructure spending is driven by corporate investment plans already committed. Energy transition capex is backed by legislation and regulatory mandates. Reshoring responds to supply chain security concerns that are bipartisan in the U.S. and consensus across the EU. Defence spending reflects geopolitical realities that are unlikely to reverse in the near term.
Hyperscaler capex commitments for 2026-2028 are running materially above Wall Street consensus, with Barclays modelling a combined figure near $1.1 trillion by 2028 and projecting that the physical power requirement alone, 21 GW of new capacity by 2028, makes utilities and grid infrastructure durable beneficiaries regardless of how AI monetisation ultimately plays out.
What this means for the reader assessing the durability of the rotation is straightforward: even if one driver disappoints, say nearshoring slows, the remaining three sustain industrial demand. That structural resilience is exactly why Goldman Sachs and broader Wall Street sell-side research for 2026 treat this differently from a typical late-cycle catch-up trade.
What the industrials valuation tells you about how far the rotation has gone
The rotation has worked. The question now is whether the easy money is behind the investors who made it early.
Peter Oppenheimer’s team at Goldman Sachs, writing in August 2026, found that global Industrials has moved above its own 20-year historical valuation range, placing it at the top of all sectors worldwide on that measure. Technology, meanwhile, has come back to earth, with its valuation now sitting in line with its own long-run average rather than commanding a premium.
Attribution note: The “world’s most expensive sector” and “above 20-year range” characterisations originate from Goldman Sachs’s August 2026 research. An independently supported framing is that valuations in global industrial and infrastructure-linked names have moved into the higher end of their historical ranges and, on some measures, now trade at premiums to the broader market.
| Sector | Valuation status (as of August 2026) |
|---|---|
| Industrials | Above 20-year historical range; highest globally (per Goldman Sachs) |
| Technology | At long-run historical average |
It is worth noting that valuation comparisons across global sectors depend on the metric used, whether price-to-earnings, EV/EBITDA, price-to-book, or forward versus trailing measures, and on how sectors are classified across different regions. The comparison is most defensible when attributed directly to Goldman Sachs’s own sector valuation tables.
For your allocation decisions, the implication is specific: an industrials sector trading above its own 20-year range is not the signal to initiate a new overweight at full size. It is the signal to understand what is already priced in, because the margin for error has narrowed considerably since this trade was cheap.
The geography shift: why the world outside the U.S. is catching up
In their August 2026 research note, Peter Oppenheimer’s team at Goldman Sachs pointed out that the U.S. equity market had trailed all other major global regions during the period under review, even as global equities as a whole performed well. Before interpreting that as bearish U.S. commentary, it is important to separate equity market performance from economic fundamentals. Goldman projects U.S. GDP growth of approximately 2.6%, above the approximately 2.0% consensus. The U.S. economy is not weak. Its equity market has simply stopped being the sole engine of global returns.
The S&P 500 price target sits at approximately 7,600, with a mid-single to low-double digit total return forecast for 2026. Those are positive numbers. They are just no longer exceptional relative to non-U.S. markets.
Three structural factors explain why markets outside the U.S. have caught up:
- Lower starting valuations: Non-U.S. markets had more room for multiple expansion as growth prospects improved.
- Sector composition: European and parts of Asian indices carry higher weights in industrials, energy, and financials, the exact sectors receiving overweight calls across major banks.
- Dollar dynamics: Goldman expects the U.S. dollar to gradually weaken, which improves returns on foreign assets for dollar-based investors.
For a reader whose portfolio is largely U.S.-listed, especially in mega-cap tech, this section delivers a specific message. The structural reason your familiar holdings have lagged is not idiosyncratic to those companies. It is a geographic and sector composition effect that is likely to persist as long as capital-intensive sectors lead. Geographic diversification in this environment is not a defensive move. It is an offensive one.
For investors wanting to understand the geographic rotation in quantified terms, our full explainer on international equity outperformance covers the specific valuation gap between U.S. and non-U.S. markets and the geopolitical catalyst that could extend the divergence through the remainder of 2026.
What a broadening market means for active stock selection
In its August 2026 research, Goldman Sachs noted that stock correlations across major markets have been declining, a trend the firm views as a return to normal market functioning following years in which both market capitalisation and performance had become unusually concentrated. That falling correlation pattern is what makes the current environment structurally different for portfolio construction.
During the concentration phase, owning a “diversified” portfolio often delivered very little actual diversification benefit. Most positions moved together regardless of how they were labelled, because a single dominant factor, U.S. mega-cap tech combined with rates sensitivity, drove nearly everything. Lower correlations mean that owning a well-diversified portfolio now actually delivers diversification benefit again. That is a fundamental change in how portfolios behave.
Strategists use “S&P 493,” the S&P 500 excluding the Magnificent Seven, as shorthand for the broadening of earnings and performance leadership beyond the narrow tech cohort. Earnings growth among cyclicals and quality compounders is widening.
Goldman has identified several themes that the new market structure rewards:
- Compounders: Quality growth names outside AI baskets, offering durable earnings at more reasonable valuations and low correlation to AI-linked trades
- Consumer experience stocks: Beneficiaries of spending patterns that are less tied to technology cycles
- M&A candidates: Companies positioned as potential consolidation targets in sectors with fragmented ownership
Goldman Sachs’s “Tech Tonic” outlook characterises 2026 as a broadening bull market, not a bear market for technology. The distinction matters: this is a widening of leadership, not a collapse of the prior winners.
February 2026 Wall Street strategy updates saw Financials and Industrials moved to Overweight at multiple major banks, reinforcing that this broadening is an institutional consensus view, not a contrarian call.
Sizing the opportunity without overpaying for yesterday’s trade
The asymmetry facing most readers is straightforward. The investors who needed to hear about this rotation most, those heavily concentrated in U.S. growth, are now hearing about it after industrials valuations have already moved above their 20-year historical range, according to Goldman Sachs’s August 2026 research.
That does not make the thesis wrong. It changes the entry point.
Cyclical sector allocation decisions carry a different risk profile when the sector in question is trading above its 20-year historical valuation range, because the entry point relative to the cycle phase determines whether the structural tailwind is already fully priced or still compounding into future returns.
Goldman’s base case for the super cycle is conditional on three factors continuing:
- AI diffusion remaining as broad and persistent as current project pipelines suggest
- Energy transition policy maintaining legislative and regulatory support
- Favourable financing conditions persisting to fund the capital-intensive buildout
If any of these falters, the rotation could reverse. Historical precedent shows that cyclical overweights have unwound before when macro conditions or policy regimes shifted.
The moderate, widely supported institutional position is: reduce extreme concentration in U.S. mega-cap tech and AI baskets, increase exposure to cyclicals and capital-intensive sectors, but size positions in context of current valuations, not 2025 valuations. Goldman’s own “Tech Tonic” framing is useful here: this is a broadening bull market, not a zero-sum rotation where technology loses so industrials can win.
The practical implication is not “sell tech, buy industrials now.” It is to assess whether your current allocation still reflects a 2023 thesis about what drives markets, because the structure has changed and a portfolio audit is warranted.
This article is for informational purposes only and should not be considered financial advice. Investors should conduct their own research and consult with financial professionals before making investment decisions. Past performance does not guarantee future results. Financial projections are subject to market conditions and various risk factors.