
The same week the US Federal Reserve held rates steady and the Bank of Japan declined to move, China’s manufacturing and services sectors both slipped into contraction. That simultaneous trio of signals, arriving in the final days of July 2026, captures the tension defining the global economic outlook right now: central banks paused, regional momentum diverging, and the world’s second-largest economy flashing warning signs.
Mid-2026 has produced a string of data releases that resist a single narrative. The US missed GDP consensus. The eurozone beat it. Japan’s industrial output surged while consumer spending sagged. None of this is noise; these divergences are the data. For investors, understanding which divergences are cyclical and which are structural is the difference between a repositioning opportunity and a value trap.
This piece works through the regional data systematically, identifies the cross-cutting themes connecting them, and lands on the specific signals worth monitoring in the months ahead. The goal is a clear-eyed framework for where the global economy actually stands, not where consensus assumed it would be six months ago.
A world of divergences, not a single global story
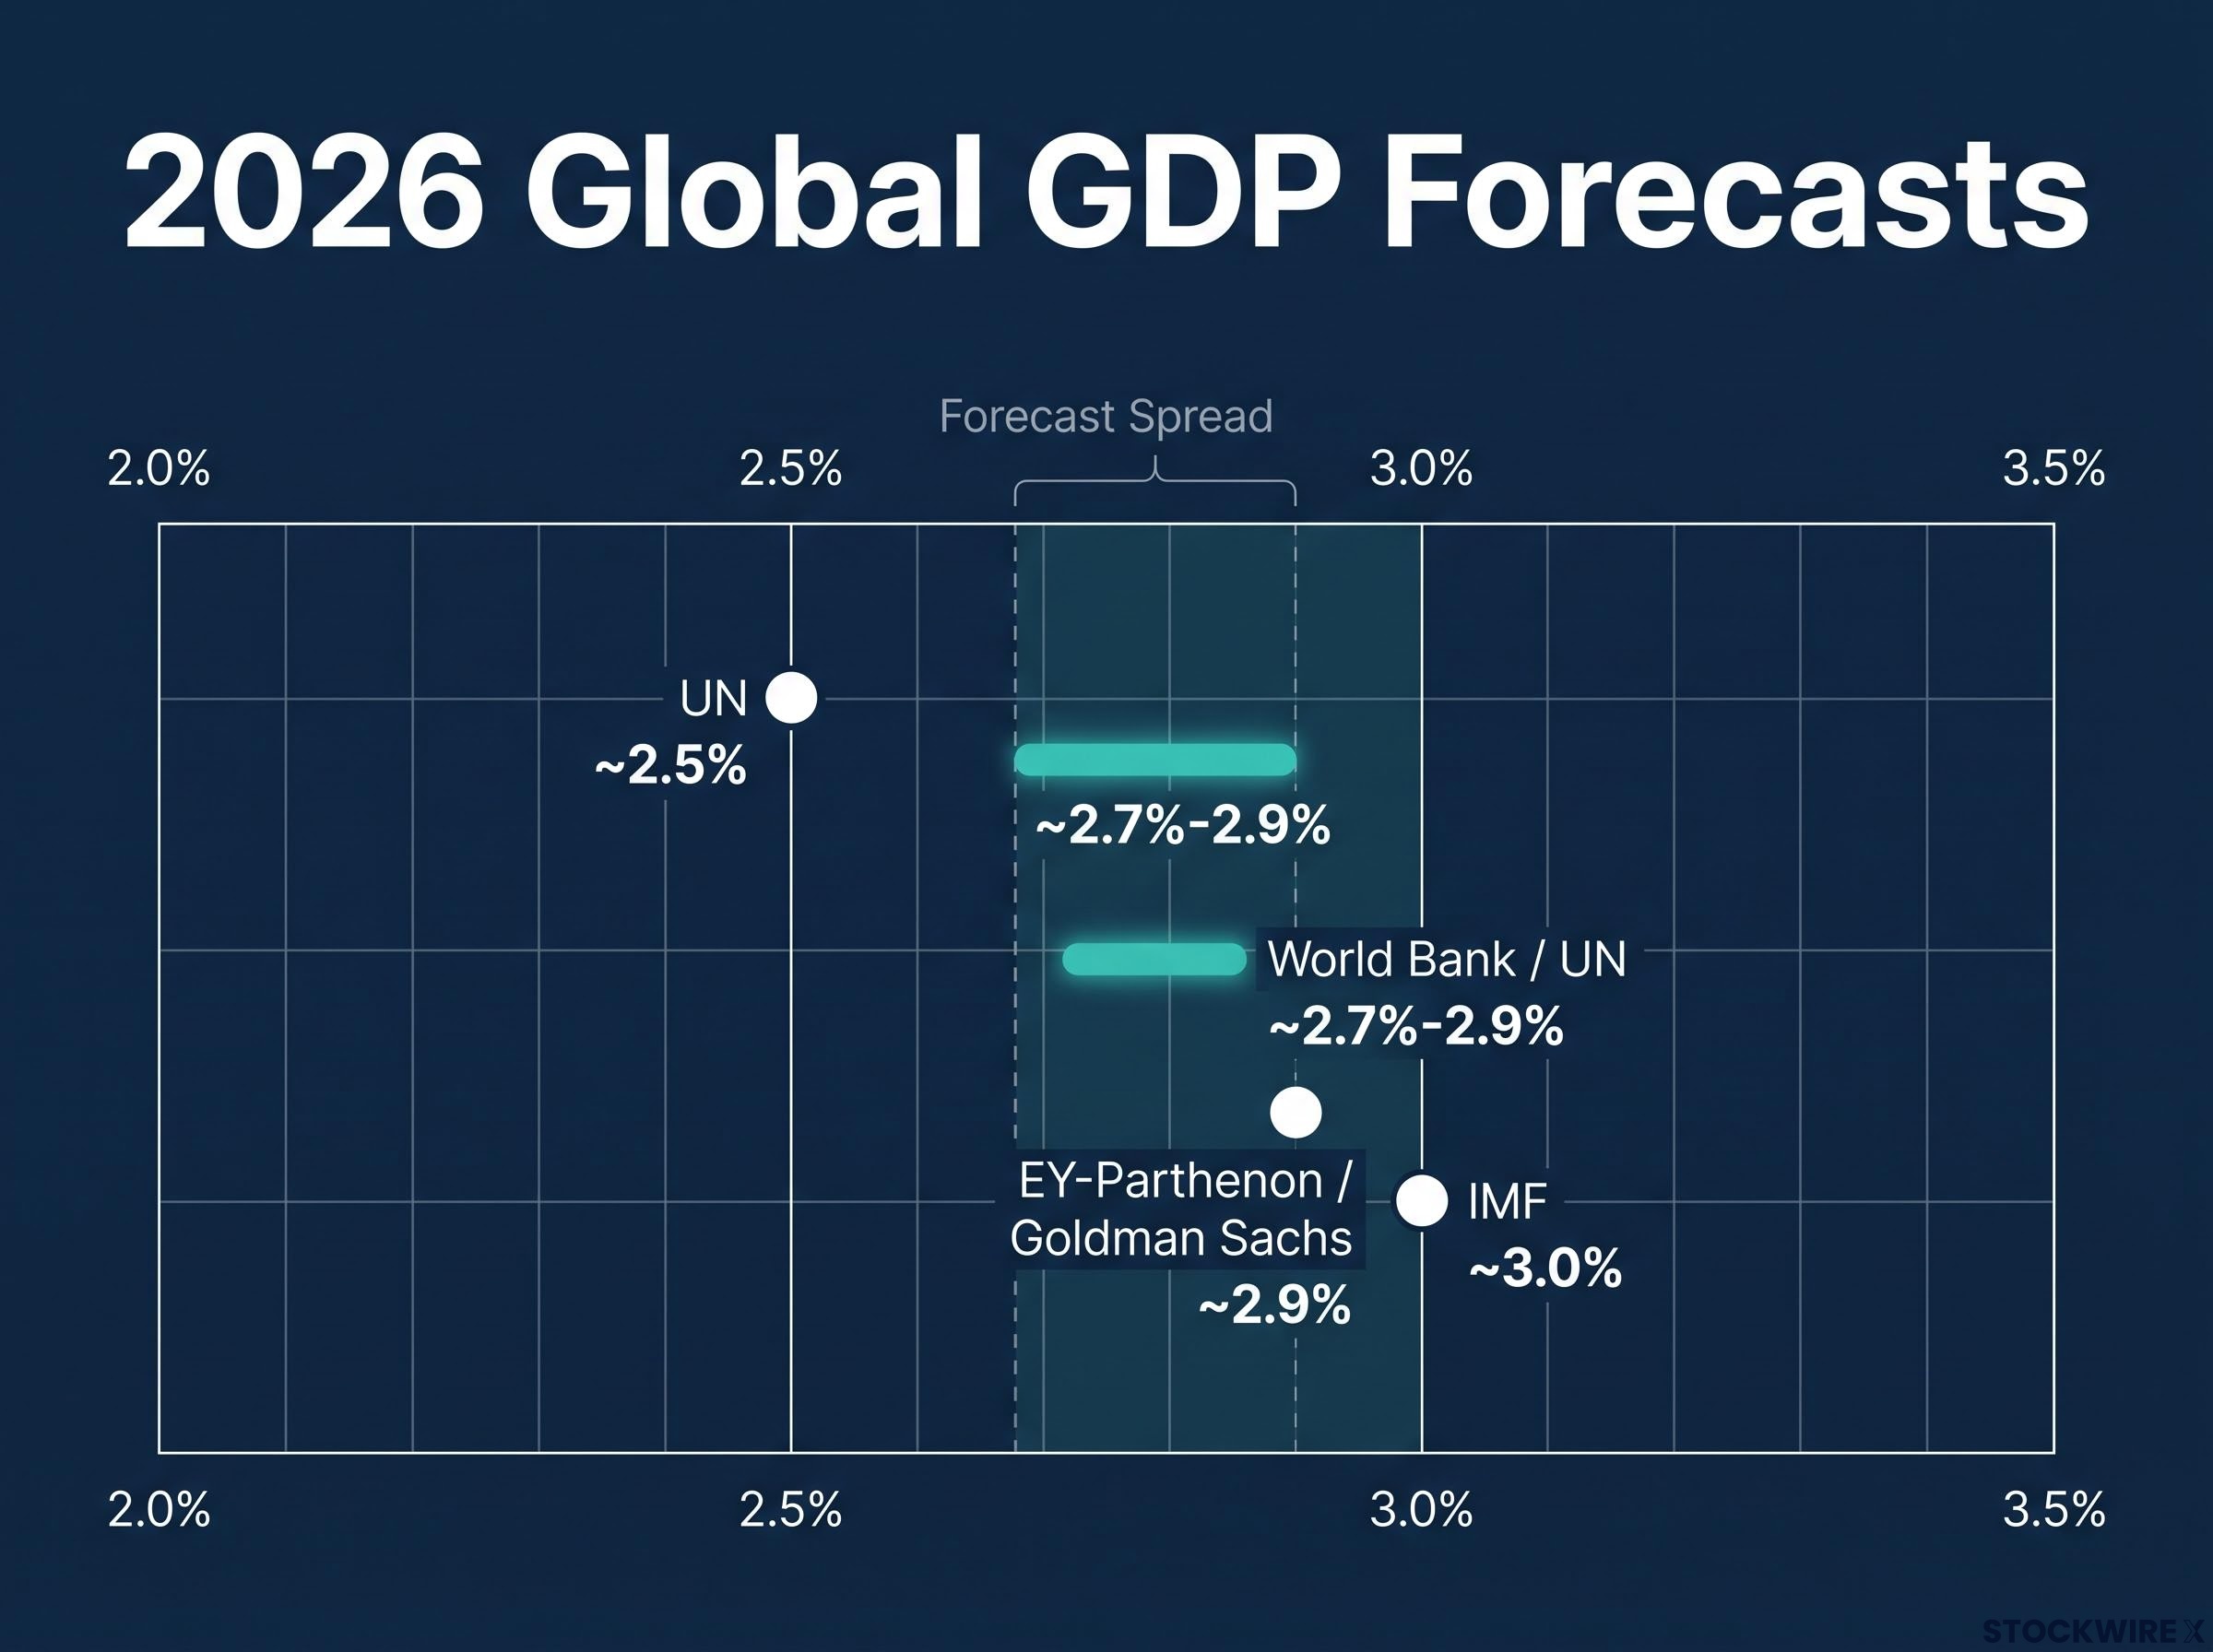
Ask four major institutions what global GDP growth looks like in 2026, and you get four different answers. The spread between them is the first thing worth paying attention to.
| Institution | 2026 Global GDP Forecast |
|---|---|
| UN (mid-2026 update) | ~2.5% |
| IMF (July 2026 update) | ~3.0% |
| World Bank / UN (earlier projection) | ~2.7%-2.9% |
| EY-Parthenon / Goldman Sachs | ~2.9% |
The half-point gap between the UN’s 2.5% and the IMF’s 3.0% is not a rounding error. It reflects genuine disagreement about how trade fragmentation and policy divergence will resolve, and it should make you sceptical of anyone offering a single confident number for global growth.
That contested aggregate also conceals sharply different regional stories arriving in the same reporting window: a US softening, a eurozone surprise, a Japan outlier print, and a China contraction signal. Advanced economy inflation sits at approximately 2.9% for 2026 according to the UN, with services and wage costs keeping core readings sticky even as goods and energy prices have normalised.
The global number, in short, masks the specific dynamics that actually drive portfolio returns. Understanding that is the prerequisite for every regional and thematic call that follows.
The earlier divergence pattern, in which Europe contracted while US manufacturing surged and Japan showed split signals across industrial output and domestic demand, makes the July configuration more legible; the cross-regional fault lines visible in May did not close, they shifted.
When big ASX news breaks, our subscribers know first
Where data beat expectations and where they missed
Advanced economies: selective strength
The pattern across the US, eurozone, Japan, and UK in this data window inverts market expectations in several places. The most-scepticised region outperformed. The assumed growth anchors underwhelmed.
| Economy | Indicator | Result | vs Consensus |
|---|---|---|---|
| US | Q2 2026 GDP (annualised) | 1.5% | Miss |
| US | June durable goods orders (m/m) | +0.3% | Miss |
| Eurozone | Q2 2026 GDP (q/q / y/y) | 0.4% / 0.9% | Beat |
| Eurozone | July flash CPI (headline / core) | 2.9% / 2.5% | In-line |
| Japan | June industrial production (m/m / y/y) | +1.3% / +4.2% | Beat |
| Japan | June retail sales (m/m) | -4.1% | Miss |
| UK | June M4 money supply (m/m) | +0.8% | Beat |
| Eurozone | June unemployment | 6.3% | Miss (held steady) |
The eurozone’s Q2 GDP beat is striking precisely because expectations were so low. Political fragmentation, weak sentiment, and persistent scepticism toward Europe’s growth model meant the 0.4% quarter-over-quarter print arrived into a vacuum of optimism. Japan’s +4.2% year-over-year industrial production surge tells a similarly counter-consensus story, but its -4.1% monthly retail sales drop signals a consumer that is not keeping pace with the factory floor.
The US, meanwhile, delivered the opposite surprise. Q2 GDP of 1.5% annualised fell short of consensus, reinforcing a modest-but-below-expectations tone rather than the soft-landing resilience markets had been pricing.
China: a PMI double-miss that changes the risk calculus
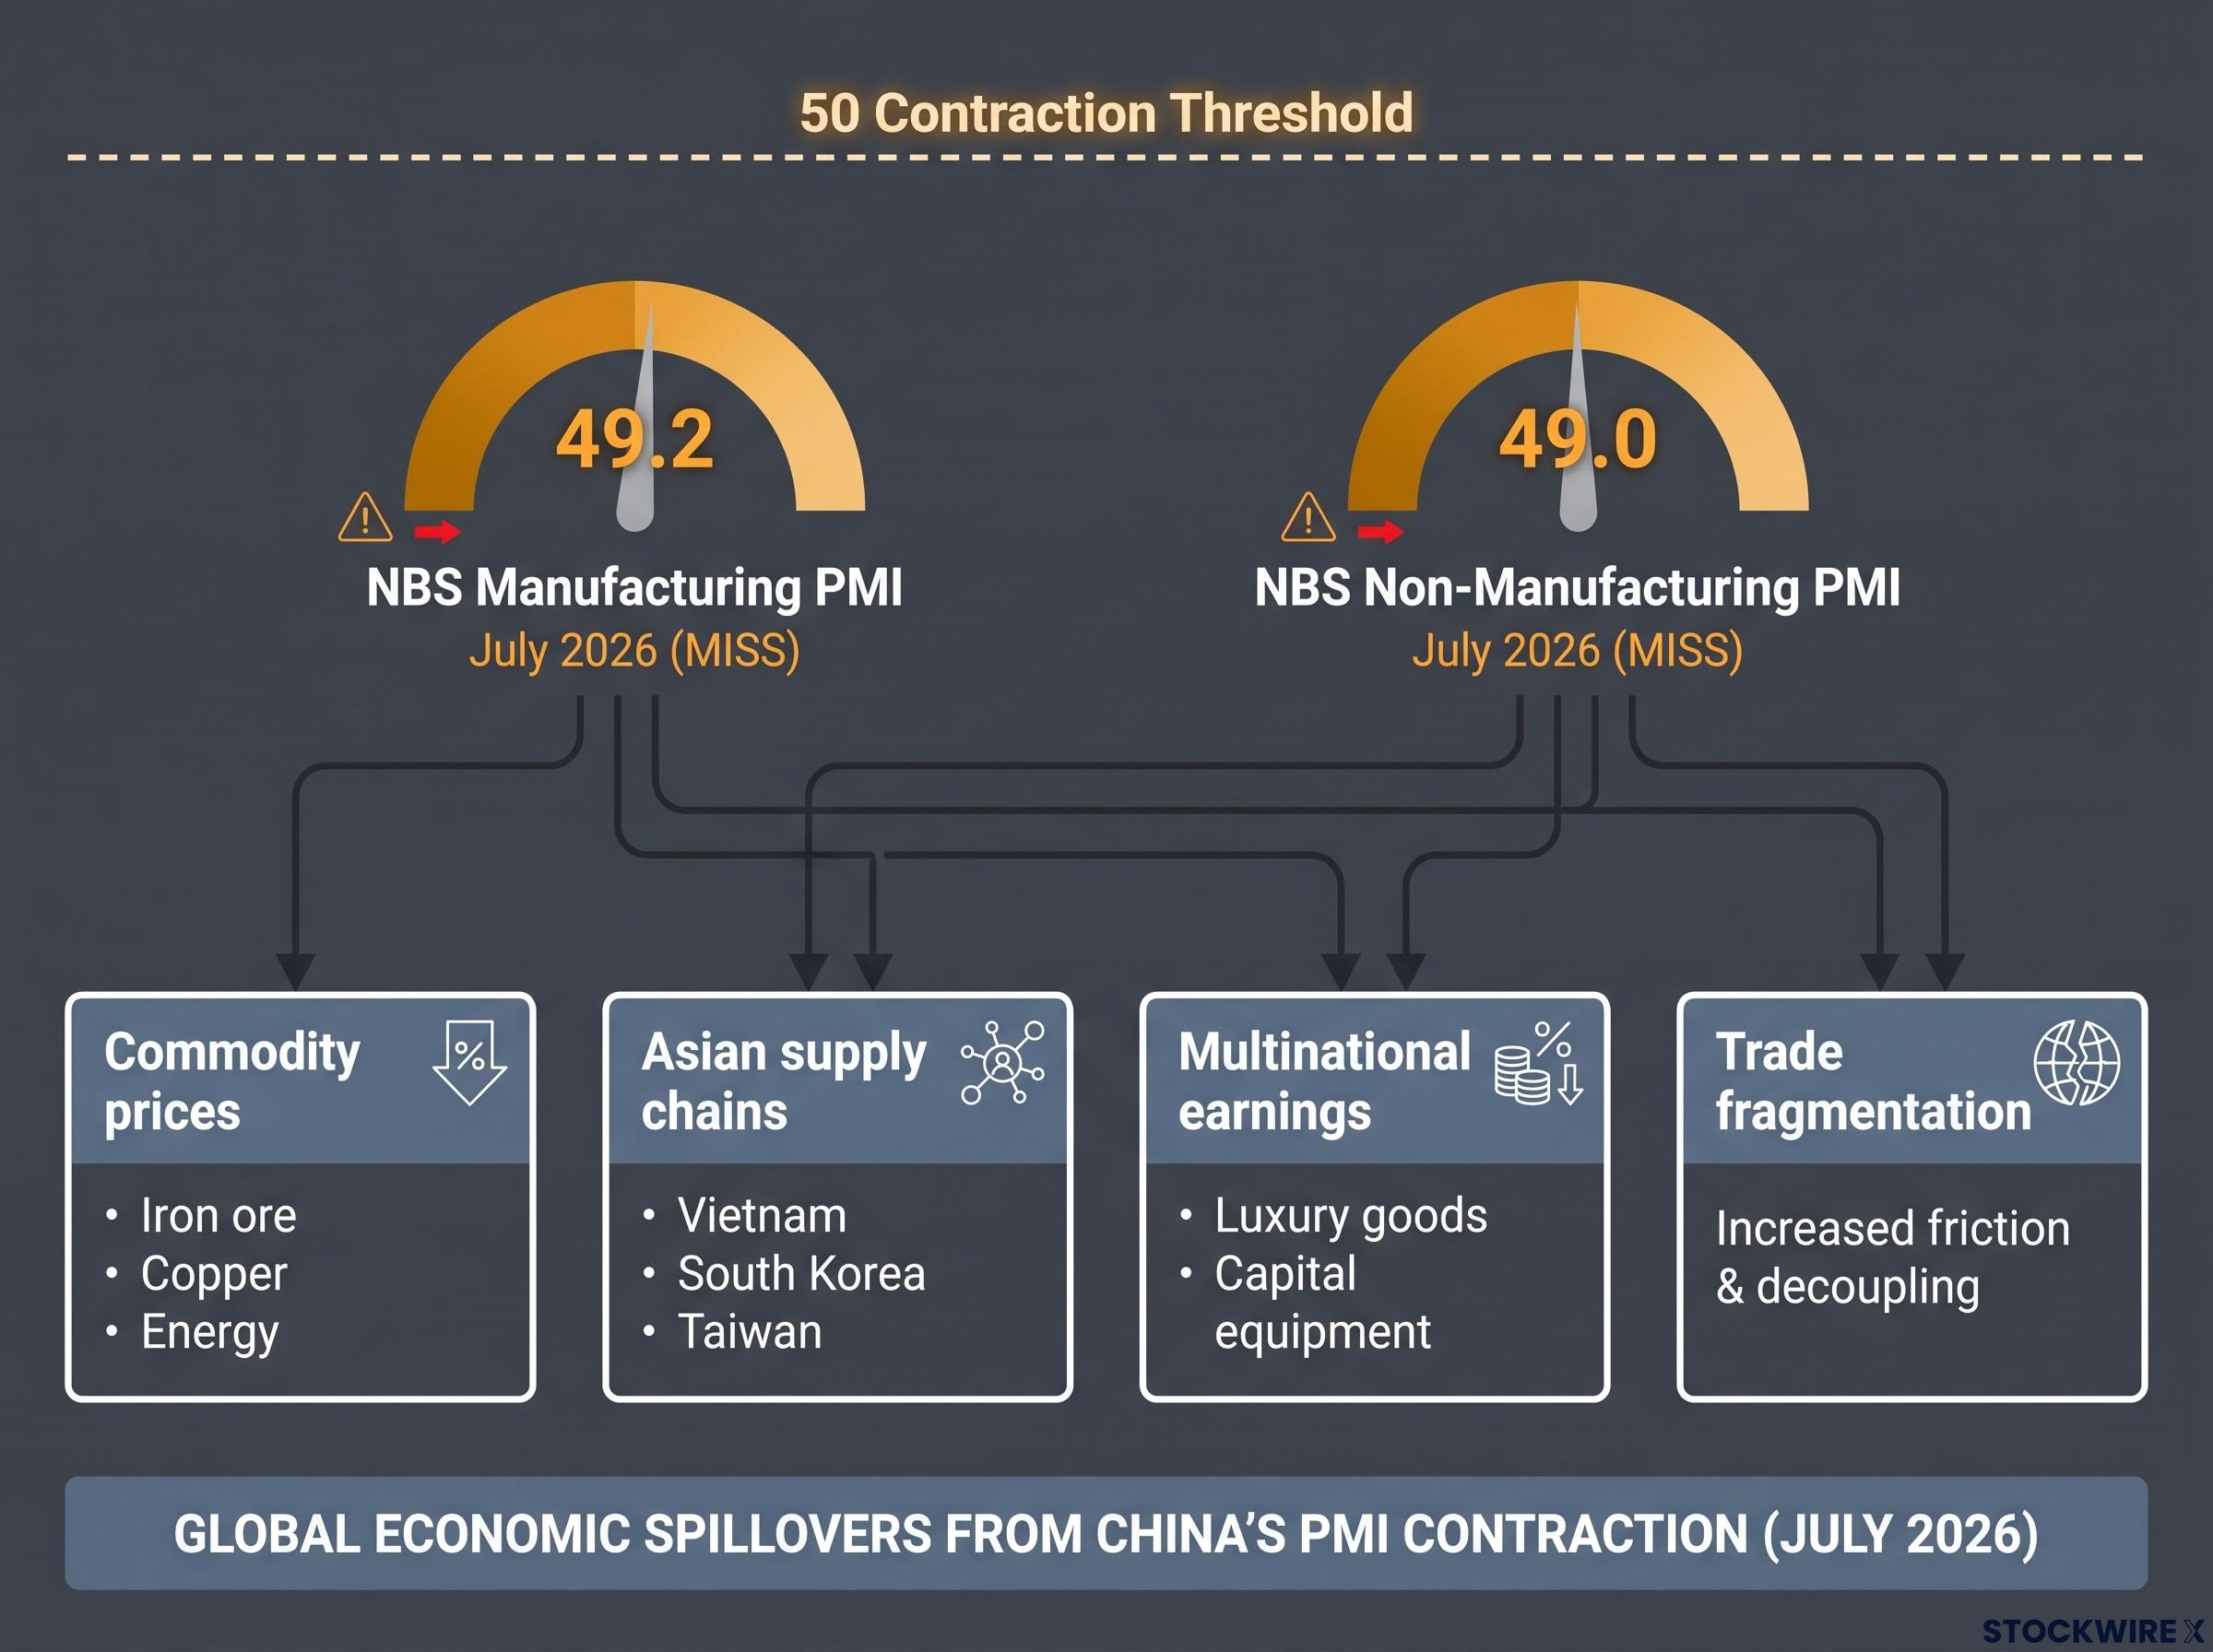
China’s July 2026 readings stand apart. July’s NBS Manufacturing PMI printed at 49.2, falling short of both the expansion threshold and analyst forecasts. The PMI is a monthly activity gauge where any reading under 50 points to contraction in the sector being measured. The NBS Non-Manufacturing PMI came in at 49.0, likewise undershooting expectations and sitting in contraction territory.
PMI market pricing dynamics explain why the July NBS prints moved sentiment even before the official headline crossed wires; equity markets pre-price survey trends months in advance, compressing the actionable window to the surprise component relative to consensus rather than the absolute level.
Both manufacturing and services contracting simultaneously is analytically significant. The NBS surveys primarily cover larger state-owned enterprises, meaning the readings may actually understate private-sector weakness. What this tells you is that consensus positioning, which still broadly assumes China as a growth engine, may be mispriced.
What the China contraction signal actually means
The PMI double-miss is not a one-month blip sitting in an otherwise healthy economy. It arrives atop structural drags that have been compounding for over a year: property-sector weakness, high local-government debt, subdued private investment, and external headwinds from technology-export controls and slower global trade.
July 2026 NBS PMIs: Manufacturing 49.2, Non-Manufacturing 49.0. Both below the contraction/expansion threshold. Both below consensus. The first simultaneous contraction signal across manufacturing and services this cycle.
GDP forecasts for China in 2026 range from approximately 4.1% (World Bank) to 4.8% (Goldman Sachs), all well below the high-growth norms of the 2010s. Beijing is deploying targeted fiscal and credit support rather than broad stimulus, a deliberate choice reflecting concerns about financial stability and the risks of re-inflating the property bubble.
The global spillover channels from a sustained China slowdown are specific and traceable:
- Commodity prices: Weaker Chinese industrial demand directly pressures iron ore, copper, and energy
- Asian supply chains: Manufacturing hubs in Vietnam, South Korea, and Taiwan face reduced orders
- Multinational earnings: Consumer-facing companies with significant China revenue exposure, particularly luxury goods and capital equipment, face margin compression
- Trade fragmentation: Firms accelerate production diversification away from China, reshaping global value chains
For investors with exposure to any of those channels, the simultaneous contraction in both Chinese manufacturing and services is not a data point to monitor passively. It is a prompt to stress-test those positions against a scenario where Beijing’s targeted approach does not arrest the deceleration.
Central banks on hold, and what that means for asset positioning
Policy posture: why cuts are later and more gradual than expected
Three major central banks held rates in the same week. The Federal Reserve stayed at 3.50%-3.75%. The Bank of England held at 3.75%. The Bank of Japan held at 1.0%. The simultaneity is not coincidence; it reflects a shared analytical conclusion.
The Fed’s no-pivot stance was articulated explicitly when Chair Kevin Warsh told Congress on 14 July 2026 that the FOMC is unanimous in its commitment to price stability, closing the interpretive gap on whether the June hold was a soft signal and repricing the Fed put to a more distant strike.
The common driver is straightforward: services inflation and wage costs remain sticky even as goods and energy prices have normalised. The UN projects advanced economy inflation at approximately 2.9% in 2026, with eurozone core CPI at 2.5%, still above the European Central Bank’s 2% target. Central banks are reluctant to ease because the inflation they still face, in services and wages, is the kind that rate cuts risk re-igniting.
Three structural reasons underpin the hold posture:
- Sticky services inflation that has proven resistant to goods-price normalisation
- Resilient labour markets keeping wage pressures elevated across all three economies
- Financial stability concerns about easing prematurely and being forced to reverse course
Asset implications of a higher-for-longer regime
Three major central banks holding simultaneously in the same week signals that the window for anticipating near-term rate cuts has narrowed materially. If you are positioned for easing-driven equity or credit rallies, the timeline needs reassessing.
Portfolio construction logic changes when real rates are positive and staying there. Cash flows, balance sheet strength, and pricing power become the qualities that compound returns. Leverage and duration become more punishing. Rate-sensitive sectors, consumer discretionary, small caps, and real estate face the most direct headwind from this regime persisting longer than consensus expected six months ago.
The structural themes cutting across every region
The regional divergences are partly expressions of deeper forces that will matter more over a 12-24 month horizon than any single quarter’s GDP print.
- Trade fragmentation and near-shoring: Supply-chain realignment is creating winners (near-shoring hubs, defence, advanced manufacturing) and losers (trade-dependent economies without policy flexibility). The IMF and S&P Global warn this is gradually eroding global trade growth.
- AI and productivity uplift: EY’s midyear outlook explicitly names AI adoption as a key upside force for corporate profitability, even in a slower macro environment. Companies deploying automation to protect margins may outperform regardless of their home market’s GDP growth rate.
- Industrial policy capital flows: Government subsidies for clean energy, semiconductors, and re-shoring are redirecting investment in ways that do not align neatly with traditional regional allocations.
- Emerging market selectivity: Advanced economies are growing approximately 1.5%-1.8% versus 4%-plus for emerging and developing economies (World Bank, IMF), but the internal variation is enormous. India and parts of ASEAN look structurally different from commodity-dependent economies or China itself.
Research on trade fragmentation and supply chain realignment identifies India, Vietnam, Indonesia, and Mexico as the principal beneficiaries of production diversification away from China, a pattern that is accelerating as firms respond to technology-export controls and elevated geopolitical risk.
EY’s midyear outlook frames AI adoption and strategic adaptation as the upside forces most likely to raise corporate profitability in a world of sub-trend macro growth. The equity opportunities that outperform in this environment may be more thematic than geographic.
What this tells you is that regional GDP forecasts alone are an increasingly poor guide to equity opportunity. Companies positioned on the right side of these structural forces, deploying AI, benefiting from industrial policy, or capturing near-shoring demand, may outperform irrespective of their home market’s headline growth.
The data slate that could shift this picture before year-end
Scheduled data releases: the calendar risk
The coming weeks carry a disproportionate amount of information about whether the current divergences are stabilising or widening. Five data triggers deserve the closest attention, ranked by potential market impact:
- China inflation and trade figures (expected in the near term): if CPI data confirms deflationary pressure alongside the PMI contraction, the probability of assertive policy intervention from Beijing rises sharply, and that single development would move commodity markets, Asian equities, and global risk sentiment more than any data point from the US or Europe in the same window
- July PMI releases across all five major regions (scheduled for the week following 31 July 2026): confirmation or reversal of the current divergence pattern
- Eurozone retail sales (upcoming): a test of whether the GDP beat is translating into consumer demand or remains investment-led
- Corporate earnings and margins across cyclical sectors: the first real signal of whether macro softness is translating into profit stress
- US employment and CPI data: the primary inputs for the Fed’s next decision window
Policy and geopolitical triggers: the asymmetric tail risks
Beijing’s policy response is the single highest-stakes variable. The July PMI double-miss raises the urgency: if China chooses broader stimulus over targeted support, commodity markets and Asian equities would reprice rapidly. If it stays the current course and deceleration deepens, the spillover channels identified earlier activate with greater force.
Beyond China, geopolitical and trade developments carry asymmetric tail risk. Any escalation or resolution in tariff regimes or technology-export controls could materially alter trade flows in either direction, and these events are, by nature, the hardest to predict and the most punishing to be wrong about.
What mid-2026’s divergences actually tell investors
The aggregate global growth number is less useful right now than the variance beneath it. The beat-or-miss pattern in recent data is already pointing to specific mispricings in consensus positioning. Three takeaways carry the highest conviction:
- China is the dominant downside risk. The simultaneous PMI contraction across manufacturing and services raises the stakes for monitoring Beijing’s policy response and stress-testing China-linked exposures across commodities, luxury goods, and Asian equities.
- The higher-for-longer central bank posture is confirmed, not speculative. Three concurrent hold decisions in the same week mean portfolios built around near-term easing need recalibrating toward cash-flow strength, balance sheet quality, and pricing power.
- Structural themes outweigh regional GDP as equity guides. AI adoption, industrial policy beneficiaries, and near-shoring demand are more reliable signals for forward returns than any single country’s growth forecast.
You do not need to call a single global macro outcome. You need a portfolio architecture resilient across the two or three most plausible scenarios for how China, central banks, and trade fragmentation resolve over the next 12 months. The data window just narrowed the range of those scenarios, and that is where the actionable signal sits.
For readers wanting to translate the structural themes identified here into a durable portfolio framework, our full explainer on post-60/40 portfolio construction examines how the breakdown in stock-bond correlation during inflation shocks changes the diversification logic across economic environments.
This article is for informational purposes only and should not be considered financial advice. Investors should conduct their own research and consult with financial professionals before making investment decisions. Past performance does not guarantee future results. Financial projections are subject to market conditions and various risk factors.