
The typical US investor holds 70-76% of their equity portfolio in domestic stocks. The US represents roughly 63-64% of the MSCI ACWI by market capitalisation. That gap, somewhere between 9 and 15 percentage points, is not a rounding error. It is a structural bet, and in 2026, it has become an increasingly concentrated one.
For most of the past decade, home bias rewarded US investors handsomely. The macro regime has shifted. Inflation is stickier than central banks expected, geopolitical fragmentation is reshaping supply chains, and US equity indices have quietly become a leveraged wager on a single AI capital expenditure cycle rather than a diversified slice of the global economy.
This analysis, drawing on research from Bridgewater Associates, BlackRock, Goldman Sachs, JPMorgan, and others, explains why standard portfolio allocation strategy assumptions are structurally misaligned with the current environment, what the overexposure actually consists of beneath the surface, and what a more resilient allocation looks like in practice.
How concentrated US portfolios really are (and why the numbers are worse than they look)
The overweight is not a vague intuition. It is a precise, measurable gap. According to Morningstar data from June 2024, the average US investor holds 76% of their equity portfolio in domestic stocks. Charles Schwab reported in January 2025 that the typical US investor holds 75% or more in US equities, against a global capitalisation weight of approximately 61% at the time. Vanguard places the figure at roughly 70%.
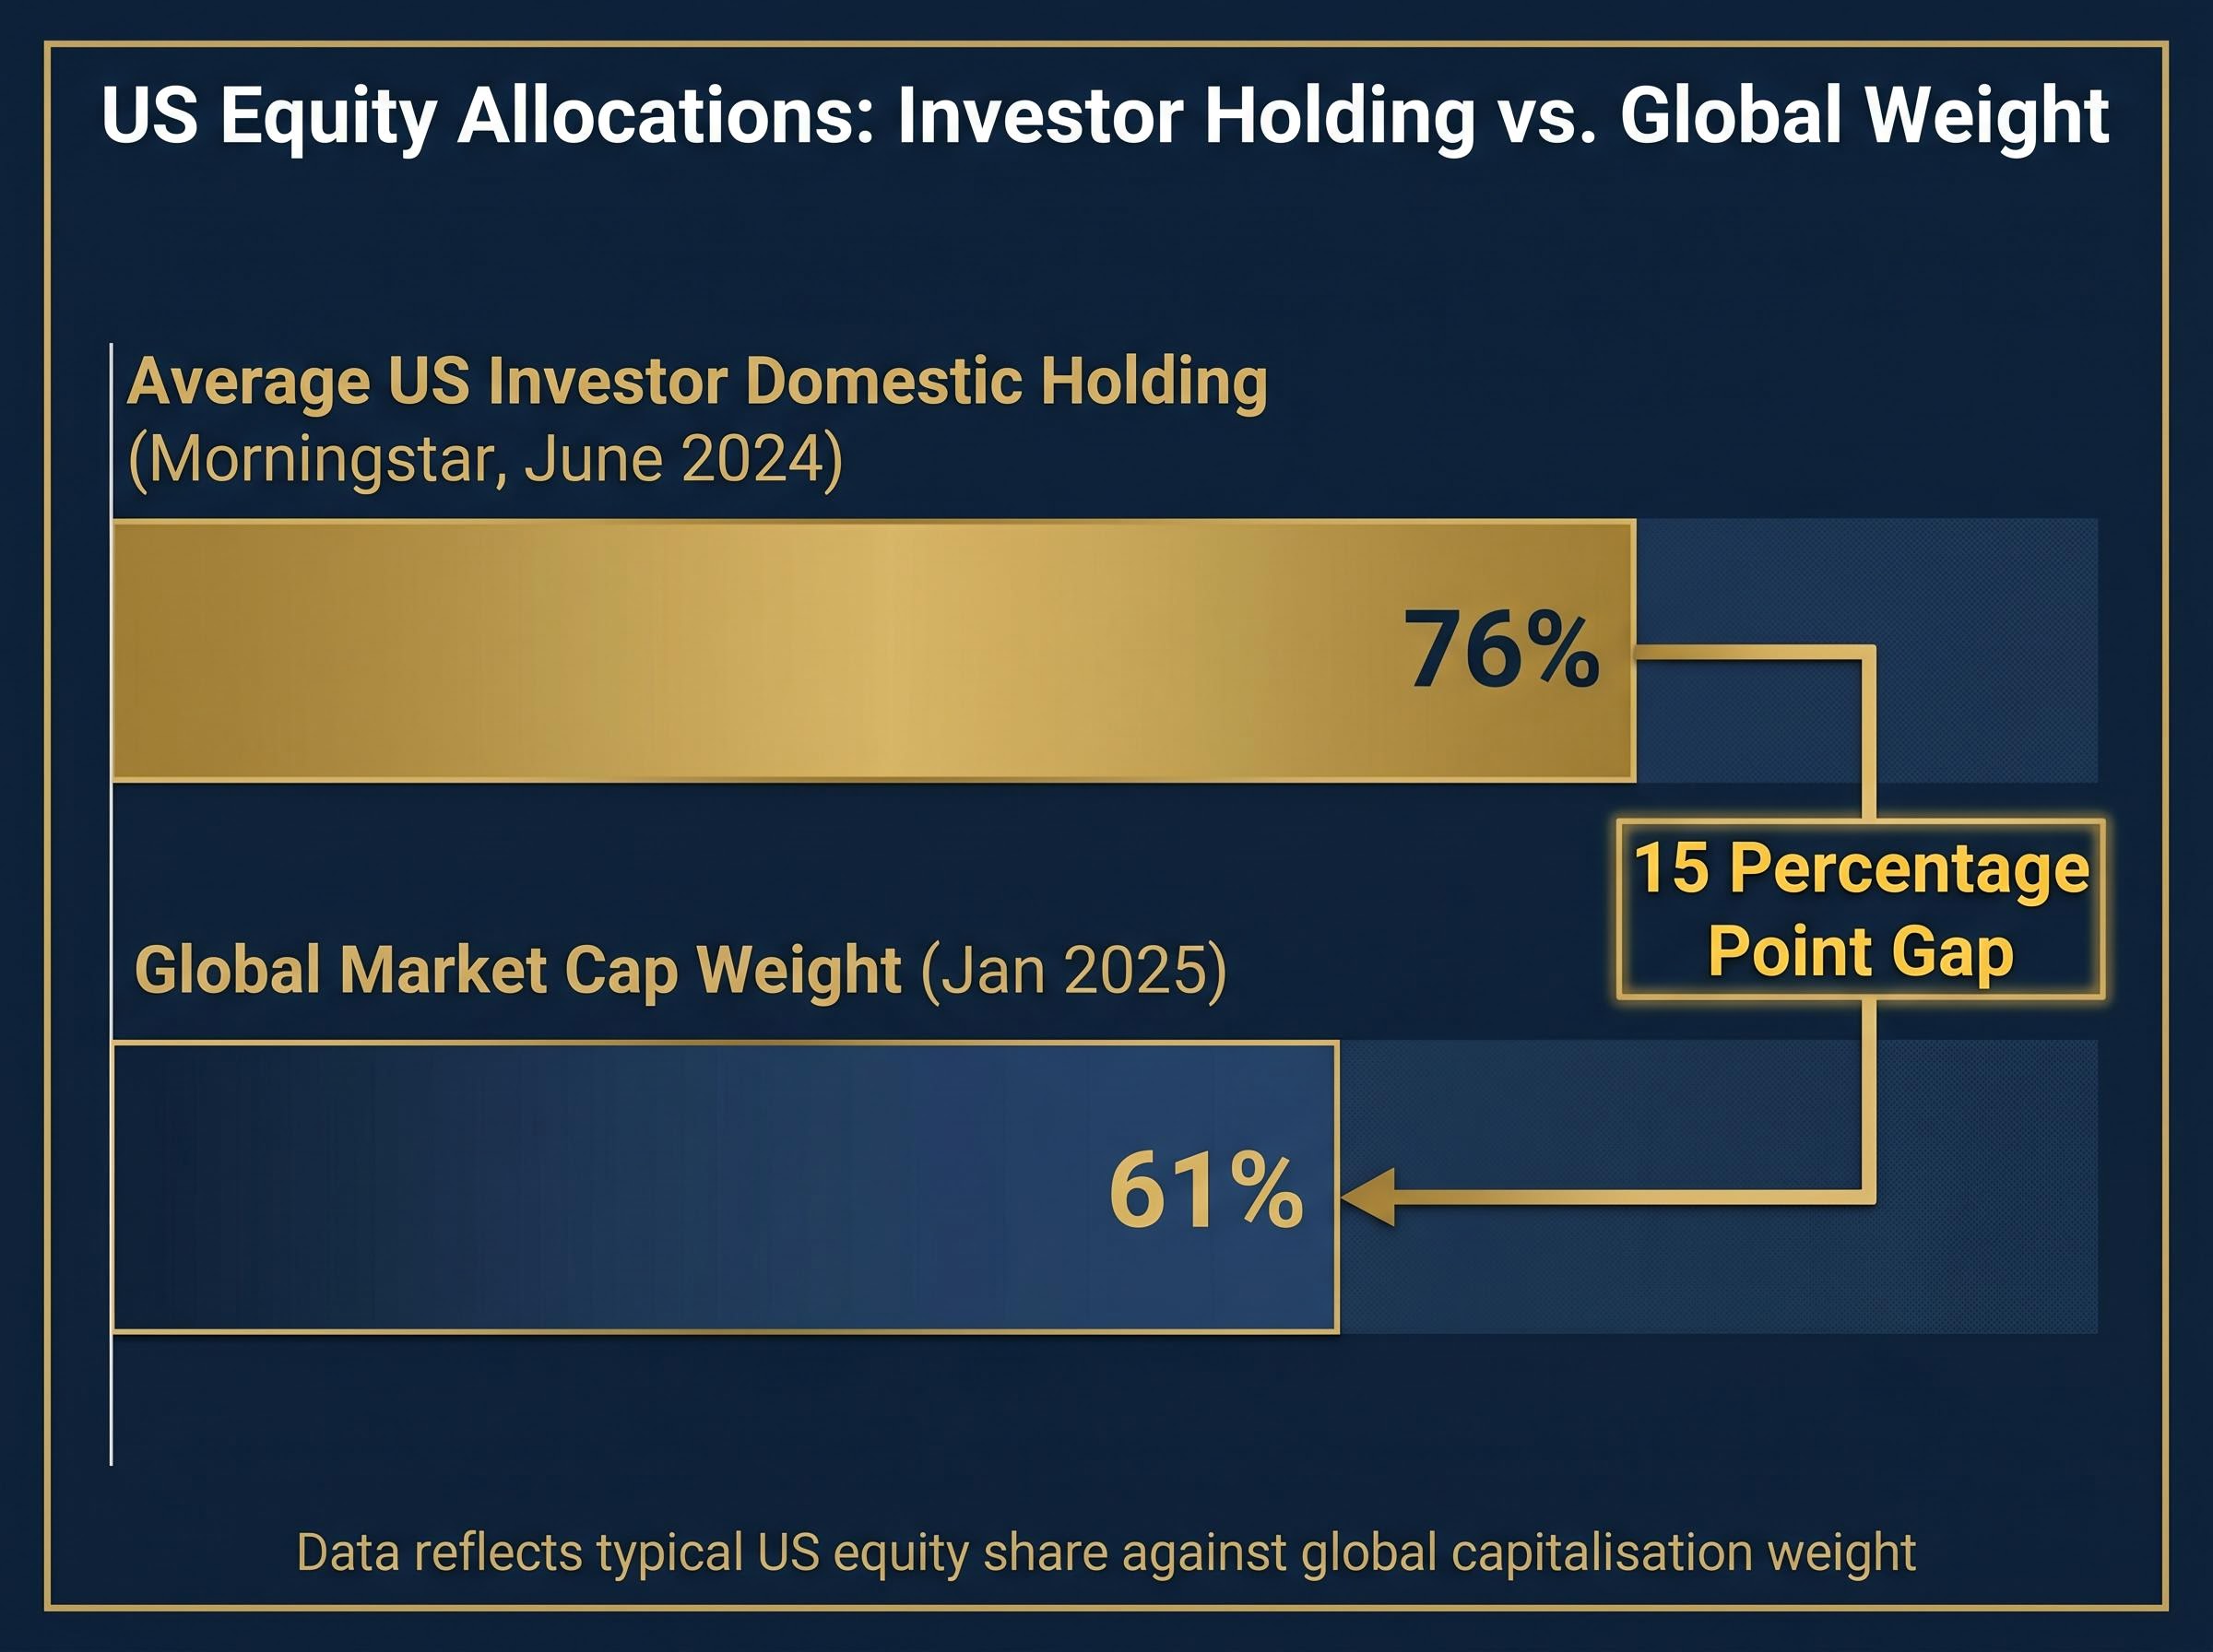
“The average US investor holds 76% of their equity portfolio in domestic stocks, against a global cap weight of roughly 60%.”
The overweight is not uniform across investor types. Retail investors skew highest. Institutional portfolios are somewhat better diversified in absolute terms, but still US-tilted in their equity sleeves.
| Investor Type | Typical US Equity Share | Total Public Equity Allocation | Implied Overweight vs. ACWI |
|---|---|---|---|
| Retail / 401(k) | 75-76% | 75% average (Vanguard 2025) | ~12-13 pp |
| Corporate Pension | US-tilted within equity sleeve | 36% of total fund (Milliman 2025) | Lower absolute exposure, still US-heavy |
| Endowment | US-tilted within equity sleeve | 46% of total fund (NACUBO 2024) | Partially offset by alternatives |
Here is the detail that makes the gap worse than it appears: investors who did nothing actively over the past decade now hold more US exposure than ever. US outperformance has mechanically increased the country’s weight in any market-cap-indexed portfolio. The overweight widened without a single active decision to increase it.
Vanguard research on home bias quantifies the structural gap precisely, finding that US investors hold roughly 29 percentage points more in domestic equities than the US share of global market capitalisation would imply, a figure that has widened passively as US outperformance mechanically inflated US weights in cap-indexed portfolios over the past decade.
When big ASX news breaks, our subscribers know first
The macro regime that makes this concentration dangerous
A static snapshot of portfolio composition tells one story. The environment those portfolios now operate in tells another.
What changed in the macro regime
Bridgewater’s Bob Prince and Greg Jensen argued in May 2025 that the world has shifted from a disinflationary boom to a reflationary environment. Inflation is structurally stickier, driven not by demand surges that central banks can cool with rate hikes, but by supply-side constraints and government spending to reduce strategic vulnerabilities.
Karen Karniol-Tambour, Bridgewater’s co-chief investment officer, extended this framing at the Milken Institute 2026 Global Conference. Her thesis: nations are collectively spending to reduce economic and strategic dependencies, a pattern she described as “modern mercantilism.” This spending is inherently inflationary, and structural rather than cyclical.
The modern mercantilism thesis, articulated by Bridgewater Co-CIO Bob Prince at the HSBC Global Investment Summit in May 2026, holds that nation-states are collectively spending to reduce strategic and economic dependencies, a pattern that is structurally inflationary and reshapes the return profile of passive equity exposure in ways that standard asset-class labels do not capture.
BlackRock’s December 2024 global outlook described a “regime of higher macro volatility” driven by the same forces. The structural drivers converge:
- Geopolitical fragmentation and re-regionalisation of supply chains
- Energy transition requiring sustained capital investment
- Demographic pressure constraining labour supply in developed economies
- Persistent fiscal deficits across major economies
- Supply-chain re-regionalisation raising input costs
Why long-duration growth equities lose their edge in a reflationary world
The mechanical relationship is straightforward. Higher, stickier inflation raises discount rates, which compresses the present value of future earnings. This effect is disproportionate for growth stocks, whose valuations depend heavily on earnings projected years into the future.
US large-cap technology, which dominates the S&P 500, is the asset class most sensitive to this discount-rate mechanism. The disinflationary regime of 2010-2021 was tailored to reward precisely this positioning. The reflationary regime that has taken shape since 2022 structurally disadvantages it.
What the AI capex cycle means for investors holding broad US equity
The concentration runs deeper than sector labels suggest. Beneath the surface, broad US market exposure is a concentrated bet on a single capital expenditure cycle still in its infrastructure phase.
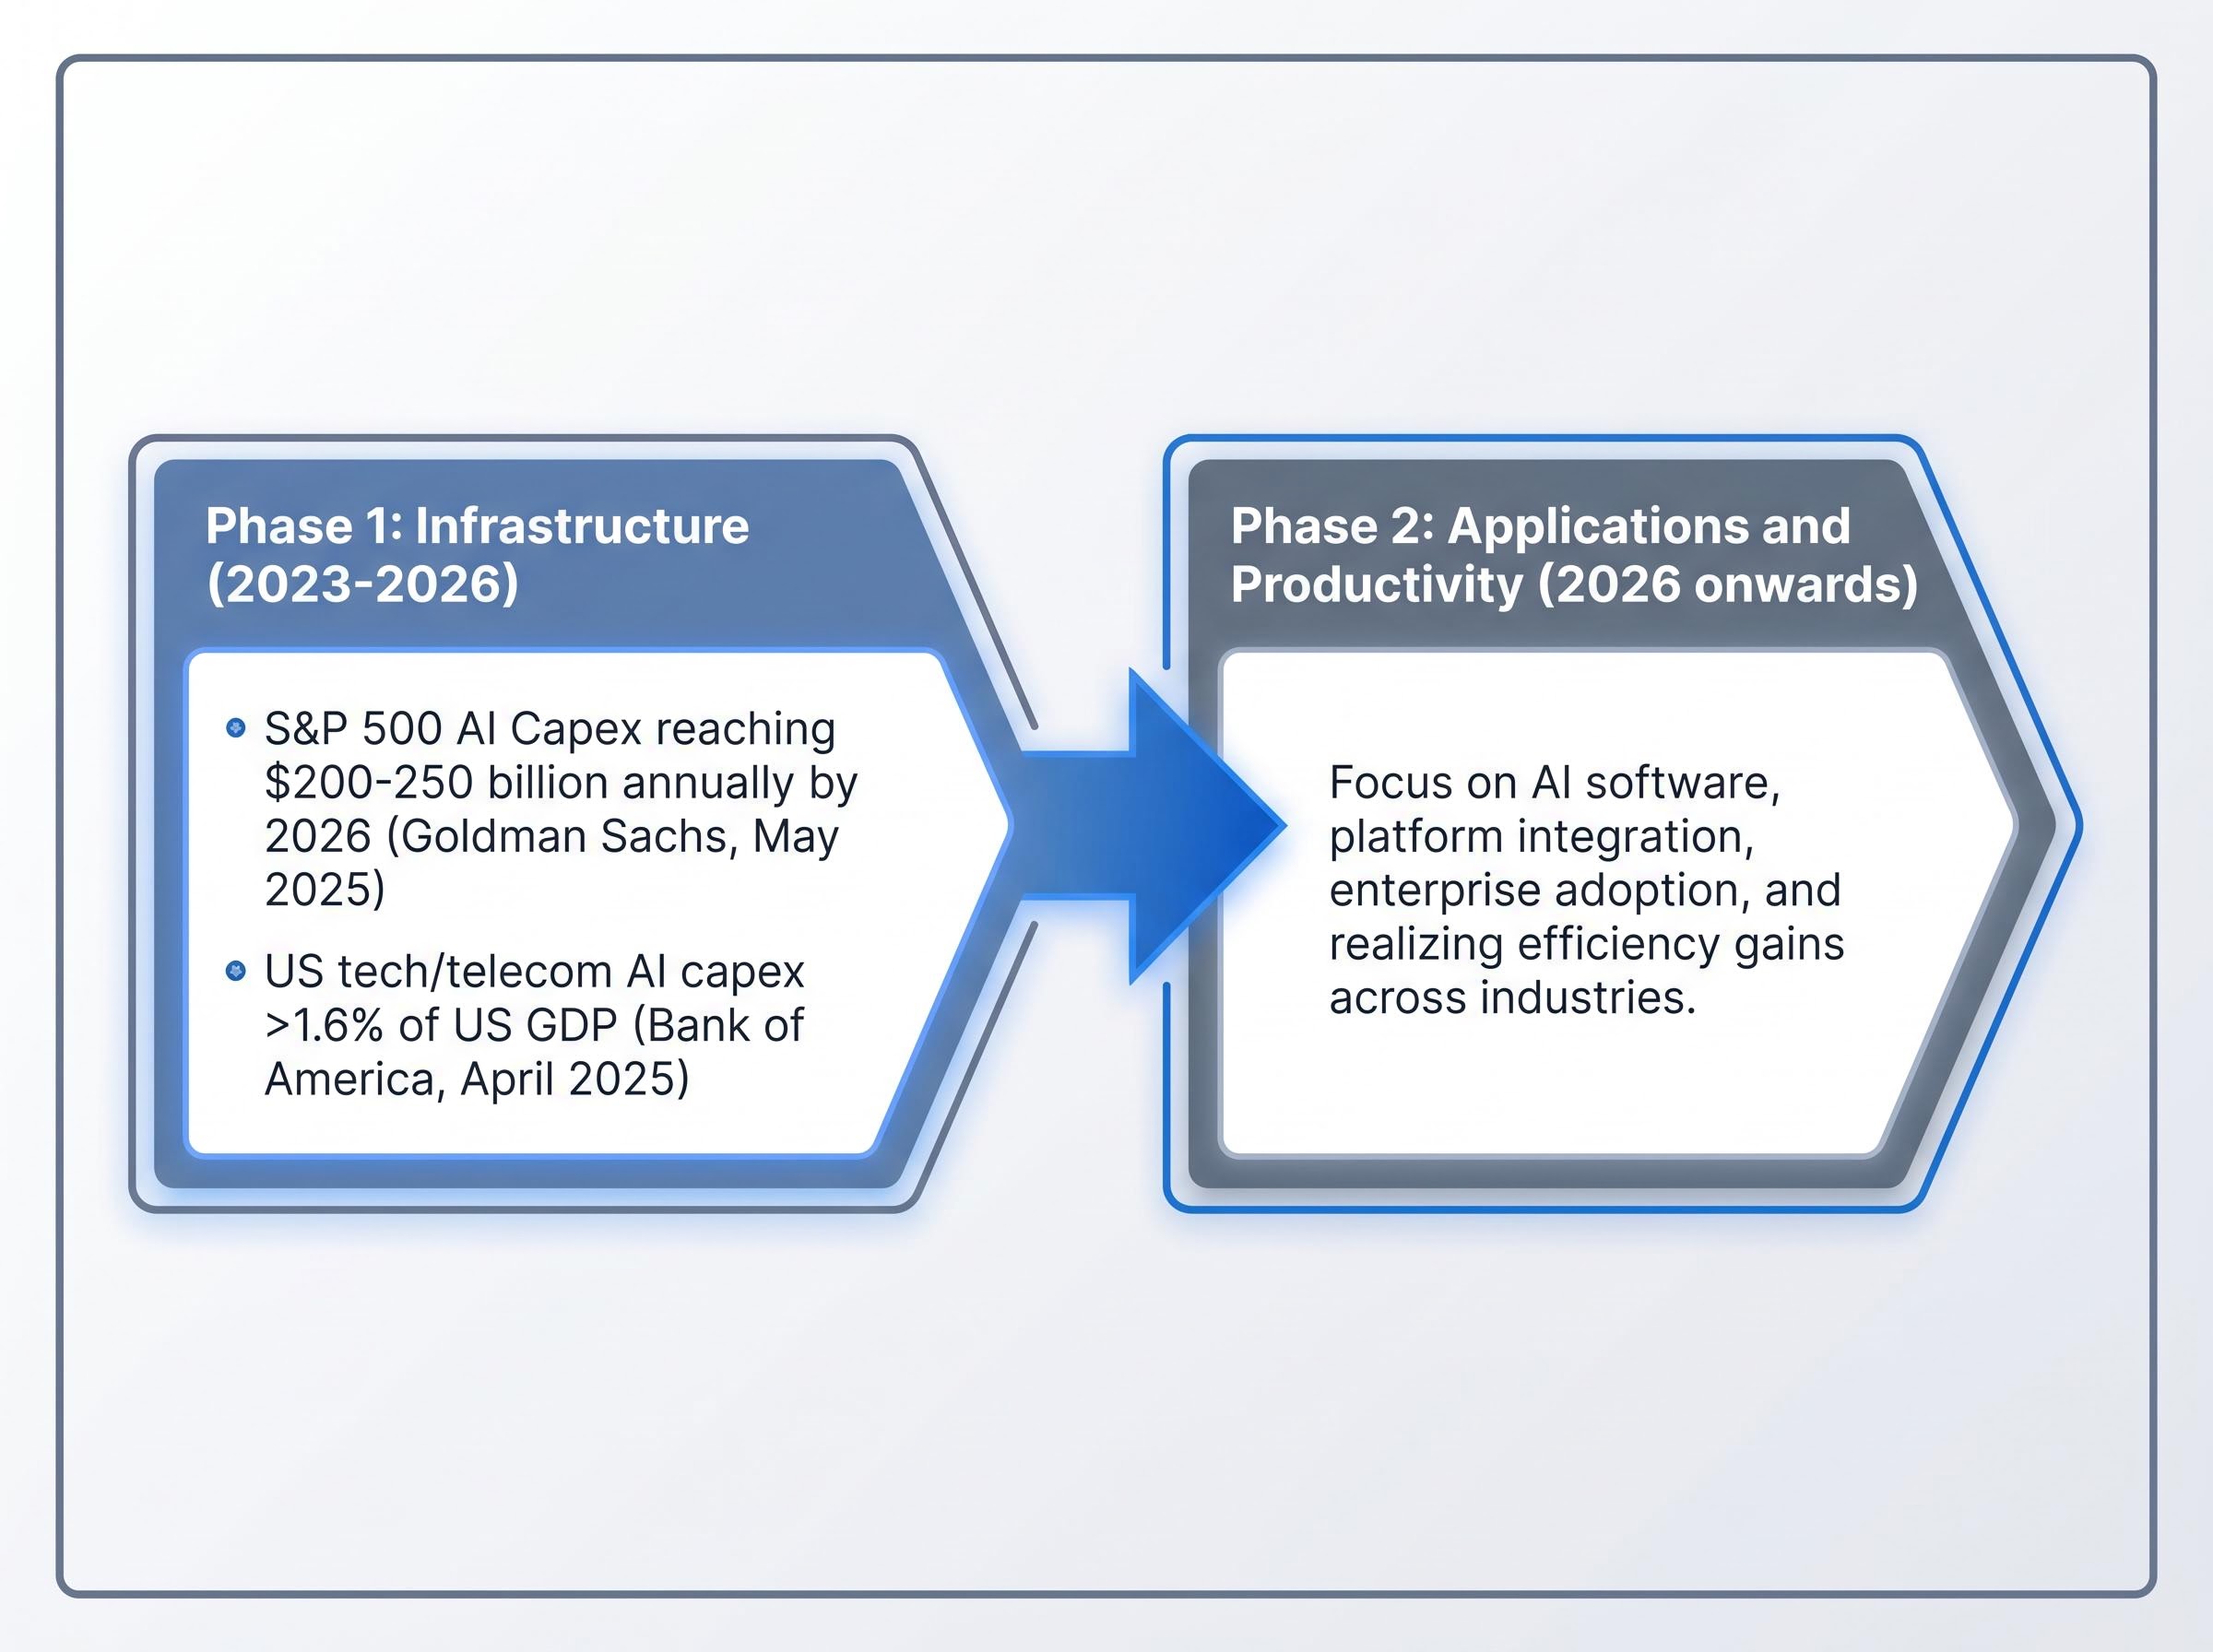
Bank of America reported in April 2025 that AI-linked capital expenditure by US technology and telecom companies exceeded 1.6% of US GDP. Goldman Sachs estimated in May 2025 that AI-related capex by S&P 500 companies would reach $200-250 billion annually by 2026, primarily in data centres and semiconductors. The index’s earnings growth forecasts for 2025-2027 are, as Goldman’s David Kostin noted, “disproportionately reliant on a small number of AI-exposed firms.”
“A slowdown in AI investment or delays in productivity gains could lead to substantial repricing in equity markets.” — IMF Global Financial Stability Report, April 2025
The IMF Global Financial Stability Report from April 2025 identified AI-linked capital concentration as an explicit equity market risk, warning that a slowdown in AI investment or delays in productivity gains could trigger substantial repricing across indices where hyperscalers and infrastructure suppliers represent a disproportionate share of earnings growth.
Morgan Stanley’s Edward Stanley distinguished Phase 1 of the AI investment cycle (infrastructure, 2023-2026) from Phase 2 (applications and productivity, 2026 onwards) in a June 2025 note. The S&P 500 and Nasdaq 100 are “highly leveraged to Phase-1 capex,” with data-centre REITs, GPU suppliers, and hyperscalers accounting for nearly all AI-related earnings upgrades. Phase 2, the period in which AI spending translates into measurable productivity gains, has not yet materialised as a growth driver. Karniol-Tambour made the same observation at Milken 2026.
Three specific conditions could stall this cycle:
- A capex cliff if AI-driven revenue fails to materialise at the pace embedded in current valuations
- Regulatory intervention targeting data usage, energy consumption, or market concentration among hyperscalers
- A faster-than-expected shift to Phase 2 that commoditises the infrastructure leaders currently capturing earnings upgrades
An investor who believes they hold diversified US equity exposure may in practice hold a concentrated bet on AI infrastructure spending continuing uninterrupted, a risk that is not visible at the index level.
AI investment cycle concentration in the S&P 500 has reached a scale with no historical precedent: US IT hardware and software spending hit 4.9% of GDP in Q1 2026, surpassing both the dot-com peak of approximately 4.2% and the cloud buildout peak of approximately 3.8%, with the rewards flowing primarily to the infrastructure and energy layer rather than to the broader index.
What real assets actually are, and why they belong in a portfolio now
Real assets is a broad category that covers four distinct asset classes, each with a different mechanical role in a portfolio. Commodities (energy, metals, agriculture) tend to rise when supply constraints push input costs higher. Infrastructure (toll roads, utilities, data centres) generates income tied to usage and regulated pricing, often with inflation-linked contracts. Real estate (direct and listed) provides returns linked to rental income and replacement costs, both of which rise with inflation. Inflation-linked bonds, known as TIPS (Treasury Inflation-Protected Securities) in the United States, adjust their principal value in line with the Consumer Price Index, directly hedging purchasing-power erosion.
Inflation-linked asset allocation in practice means distinguishing between assets with direct CPI pass-through, such as TIPS, and assets with softer inflation sensitivity, such as real estate, where rental income adjusts over time but replacement-cost dynamics vary significantly by geography and property type.
| Asset Class | Inflation Sensitivity | Growth Correlation | Portfolio Role |
|---|---|---|---|
| Commodities | High (direct input cost link) | Moderate (cyclical) | Supply-shock and inflation hedge |
| Infrastructure | Moderate-High (regulated pricing) | Low (defensive income) | Stable income with inflation pass-through |
| Real Estate | Moderate (rental income, replacement cost) | Moderate | Real income generation, diversification |
| TIPS | Direct (CPI-linked principal) | Low | Explicit inflation protection |
The core mechanical case is that real assets produce returns correlated with inflation and supply-side dynamics rather than monetary-policy expectations. This makes them structurally complementary to equity-heavy portfolios in a reflationary regime.
The underallocation is substantial. JPMorgan noted in February 2025 that typical balanced portfolios hold less than 10% in real assets. Bridgewater’s backtesting shows that adding 15-20% in inflation-linked assets improves drawdown and real-return outcomes in scenarios resembling the 1970s stagflationary period. State Street found in March 2025 that even a modest 5% commodities plus 5% listed infrastructure allocation would have improved Sharpe ratios in the post-2020 environment. Goldman Sachs model portfolios include 5-10% commodities and 10-15% overall real assets.
“Adding 15-20% in inflation-linked assets improves drawdown and real-return outcomes in scenarios resembling the 1970s stagflationary period.” — Bridgewater Associates, May 2025
Reducing home bias through regional allocation across a fragmented world
Geographic rebalancing and real-asset rebalancing are not two separate strategies. They are two sides of the same structural thesis.
Karniol-Tambour’s modern mercantilism framing at Milken 2026, and BlackRock’s December 2024 outlook, both describe a world in which industrial policy is producing distinct, investable regional ecosystems. The US, Europe, Japan, and emerging market Asia are developing separate supply-chain architectures, separate energy-transition strategies, and separate technology regulatory frameworks. Cross-regional exposure becomes a structural necessity rather than an optional enhancement.
Major managers have identified four distinct geographic allocations:
Global capital flow patterns in 2026 reveal a more nuanced picture than a simple US-versus-rest rotation: semiconductor ETFs have posted record gains driven by AI supply chain positioning, while European equities face structural headwinds from elevated energy costs and sluggish eurozone growth, making country-level precision more important than a monolithic developed ex-US allocation.
- European industrials and financials, benefiting from energy-transition spending and governance reform
- Japan, following corporate governance reforms that are improving shareholder returns
- Emerging market Asia, particularly AI hardware supply chain beneficiaries in Korea and Taiwan
- Broad developed ex-US equity as a market-cap-weight anchor to reduce home bias
Valuation gaps provide a supporting tailwind. Goldman Sachs noted in February 2025 that valuation spreads between US and non-US markets are historically wide, with Europe and emerging markets trading at notable discounts on forward price-to-earnings ratios. This is a tailwind to the thesis, not its foundation.
The institutional rotation is already visible. CalPERS raised international public equity from 23% to 27% in July 2025, citing reduced concentration in US technology stocks. Q1 2025 saw approximately $24 billion in net inflows into US-listed developed ex-US equity ETFs, according to State Street Global Advisors. European equity funds took in $12 billion in the first two months of 2025, per EPFR data.
CalPERS, the largest US public pension fund, raised international public equity from 23% to 27% of its total fund in July 2025, explicitly citing “greater global diversification and reduced concentration in U.S. technology stocks.”
The portfolio for a fragmented, inflationary world looks nothing like the one most people are holding
The analysis implies three adjustments. First, reduce passive US equity concentration, particularly growth-heavy large-cap exposure that embeds the AI capex bet. Second, build a real-asset sleeve of 10-15% drawn from commodities, infrastructure, TIPS, and listed real estate. Third, raise international equity allocation toward global market-cap weights as a baseline, which implies approximately 36-37% in non-US equity as of mid-2026, according to Vanguard’s neutral starting point.
Three accessible implementation steps apply within standard retail account structures:
- Review international equity weight against the global capitalisation benchmark; if non-US equity is below 30% of equity holdings, the gap is material
- Assess real-asset exposure as a percentage of total portfolio; if below 10%, the portfolio is underweight relative to major manager recommendations
- Identify TIPS funds, commodity ETFs, or listed infrastructure ETFs available within existing 401(k) or brokerage account structures
Most 401(k) menus have limited real-asset options. TIPS funds and international equity index funds are the most commonly available entry points. Commodity and infrastructure ETFs are more readily accessed through brokerage accounts.
Building for multiple regimes, not betting on one
The goal is not to predict which scenario materialises. It is to hold a portfolio whose construction logic remains sound across multiple macro regimes: continued disinflation, stagflation, or a reflationary boom.
The current US-heavy, real-asset-light default is optimised almost exclusively for the disinflationary, US-technology-led growth regime that characterised 2010-2021. Bridgewater’s 15-20% inflation-linked asset target represents the upper end of the recommended range. CalPERS and the endowment data from NACUBO-TIAA (endowments already hold 12% in real assets) show that sophisticated allocators are already positioned ahead of typical retail portfolios.
Structural misalignment is a slow-moving risk, not a crisis to time
The argument is not that US equities will crash this year. It is that the portfolio construction logic inherited from the 2010s is no longer well-suited to the macro environment that has taken shape since 2022.
The distinction between structural reallocation and market timing is worth making explicit:
- Time horizon: Structural reallocation operates over years; market timing operates over weeks or months
- Decision trigger: Structural reallocation responds to regime change; market timing responds to price movements
- How to evaluate success: Structural reallocation is measured by risk-adjusted returns over a full cycle; market timing is measured by whether the entry or exit was correctly timed
The shift is already visible in institutional behaviour. CalPERS, endowment allocators, and Q1 2025 ETF flows all point in the same direction. The consensus of major asset managers, including BlackRock, Bridgewater, Goldman Sachs, JPMorgan, PIMCO, and State Street, provides a durable foundation for the reallocation case independent of short-term market moves. Vanguard’s research shows that non-US equities tend to outperform when the dollar weakens or when growth leadership rotates away from the US.
The appropriate response is a gradual, deliberate rebalancing toward global market-cap weights in equities and a meaningful real-asset sleeve, reviewed annually. Not a reactive repositioning driven by the next data release or the next Federal Reserve meeting.
Every month of inaction compounds a structural mismatch. That is not a reason to panic. It is a reason to start.
This article is for informational purposes only and should not be considered financial advice. Investors should conduct their own research and consult with financial professionals before making investment decisions. Past performance does not guarantee future results. Financial projections are subject to market conditions and various risk factors.