Goldman Sachs published research today arguing that the biggest risk in tech stocks is not what most investors are watching. Valuations have actually compressed, dramatically in some cases. According to Goldman’s strategy team led by Peter Oppenheimer, the real vulnerability lies in the earnings projections that current prices are built upon.
This reframing matters because it changes which metrics you should be tracking and what a stress scenario actually looks like. A correction driven by overstretched valuations looks different from one driven by an earnings-disappointment cycle. The distinction has direct consequences for how a portfolio handles a tech drawdown.
Here is what Goldman actually found, what their dividend discount model analysis reveals about tech-sector-specific earnings expectations, and which signals would tell you the earnings story is starting to break down. This is not a summary of a research note; it is the framework for understanding whether the reassurance you have been relying on still applies.
The shift Goldman is calling: from overpriced to over-expected
There are two ways a stock price can be wrong. The first is paying too much per dollar of earnings a company is generating today. That is a valuation bubble, the kind most investors instinctively watch for. The second is more subtle: the price may look reasonable on today’s earnings, but it implicitly assumes a rate of future earnings growth that may not materialise. That is an earnings-expectations bubble.
Growth stock valuation mechanics explain why the earnings-expectations risk Goldman identifies is structurally different from a classic valuation bubble: high P/E ratios on growth names reflect the market pricing future earnings through discounted cash flow rather than overpaying for current profits, which means the entire investment case collapses if projected growth fails to arrive.
Goldman’s core claim is that recent tech gains have been earnings-driven, not multiple-expansion-driven. Forward price-to-earnings ratios (the price investors pay per dollar of expected profit) have not expanded meaningfully in 2026, even as share prices have climbed. Earnings estimates have risen in tandem with prices.
Goldman Sachs strategists describe the current situation as a “potential earnings bubble” within the technology sector, based on research published 3 August 2026 and led by Peter Oppenheimer.
Goldman explicitly does not declare an outright bubble in U.S. equities in aggregate. The warning is narrower and more specific: earnings-expectation risk in the tech sector is the vulnerability to monitor. For you, the practical implication is straightforward. The usual reassurance (“valuations are not that stretched”) no longer addresses the actual risk Goldman is identifying, because the risk has migrated upstream into the earnings forecasts themselves.
When big ASX news breaks, our subscribers know first
What the dividend discount model reveals about tech earnings expectations
A dividend discount model (DDM) is a tool that works backwards from a stock’s current price. Instead of asking “is this stock expensive?”, it asks “what rate of future earnings growth does this price imply investors expect?” A one-stage DDM takes the current price, the current dividend or earnings payout, and a discount rate, then solves for the long-term growth rate that would justify the price. It is a way of making implicit market expectations explicit.
The dividend discount model is most precisely described as a reverse-engineering tool: rather than projecting future earnings forward to a target price, it works backwards from the current market price to solve for the growth rate investors must implicitly believe in to justify paying that price.
Goldman applied this model to the technology sector specifically. The result, published in the 3 August 2026 research note, is that the 10-year earnings growth CAGR embedded in tech sector prices has now pushed well past what the 2000 dot-com peak implied.
That is the tech-sector-specific figure. The aggregate market picture is different. Market-implied long-term earnings growth for the S&P 500 overall currently sits at approximately 10%, clearly below the 2000 peak of approximately 16% and below 2021’s approximately 13%.
The distinction matters. The claim that implied earnings growth has “surpassed dot-com levels” applies to the tech sector DDM analysis, not the broad market.
How today’s numbers compare to the dot-com era
| Metric | Current level | 2021 level | 2000 dot-com peak |
|---|---|---|---|
| Implied long-term earnings growth (aggregate market) | ~10% | ~13% | ~16% |
| Implied 10-yr CAGR (tech sector, DDM) | At or beyond 2000 peak | N/A | Reference threshold |
| Forward two-year P/E, leading large-cap tech | ~20x | N/A | ~52x |
The structural difference is that today’s leading names, Nvidia, Apple, Alphabet, Microsoft, and Amazon, are highly profitable, dominant franchises. Many dot-com-era names were not. That is precisely why the earnings-expectations lens matters more than the price-to-earnings comparison alone. The valuations are not extreme. The growth that justifies those valuations may be.
Why valuations compressed and what it actually means
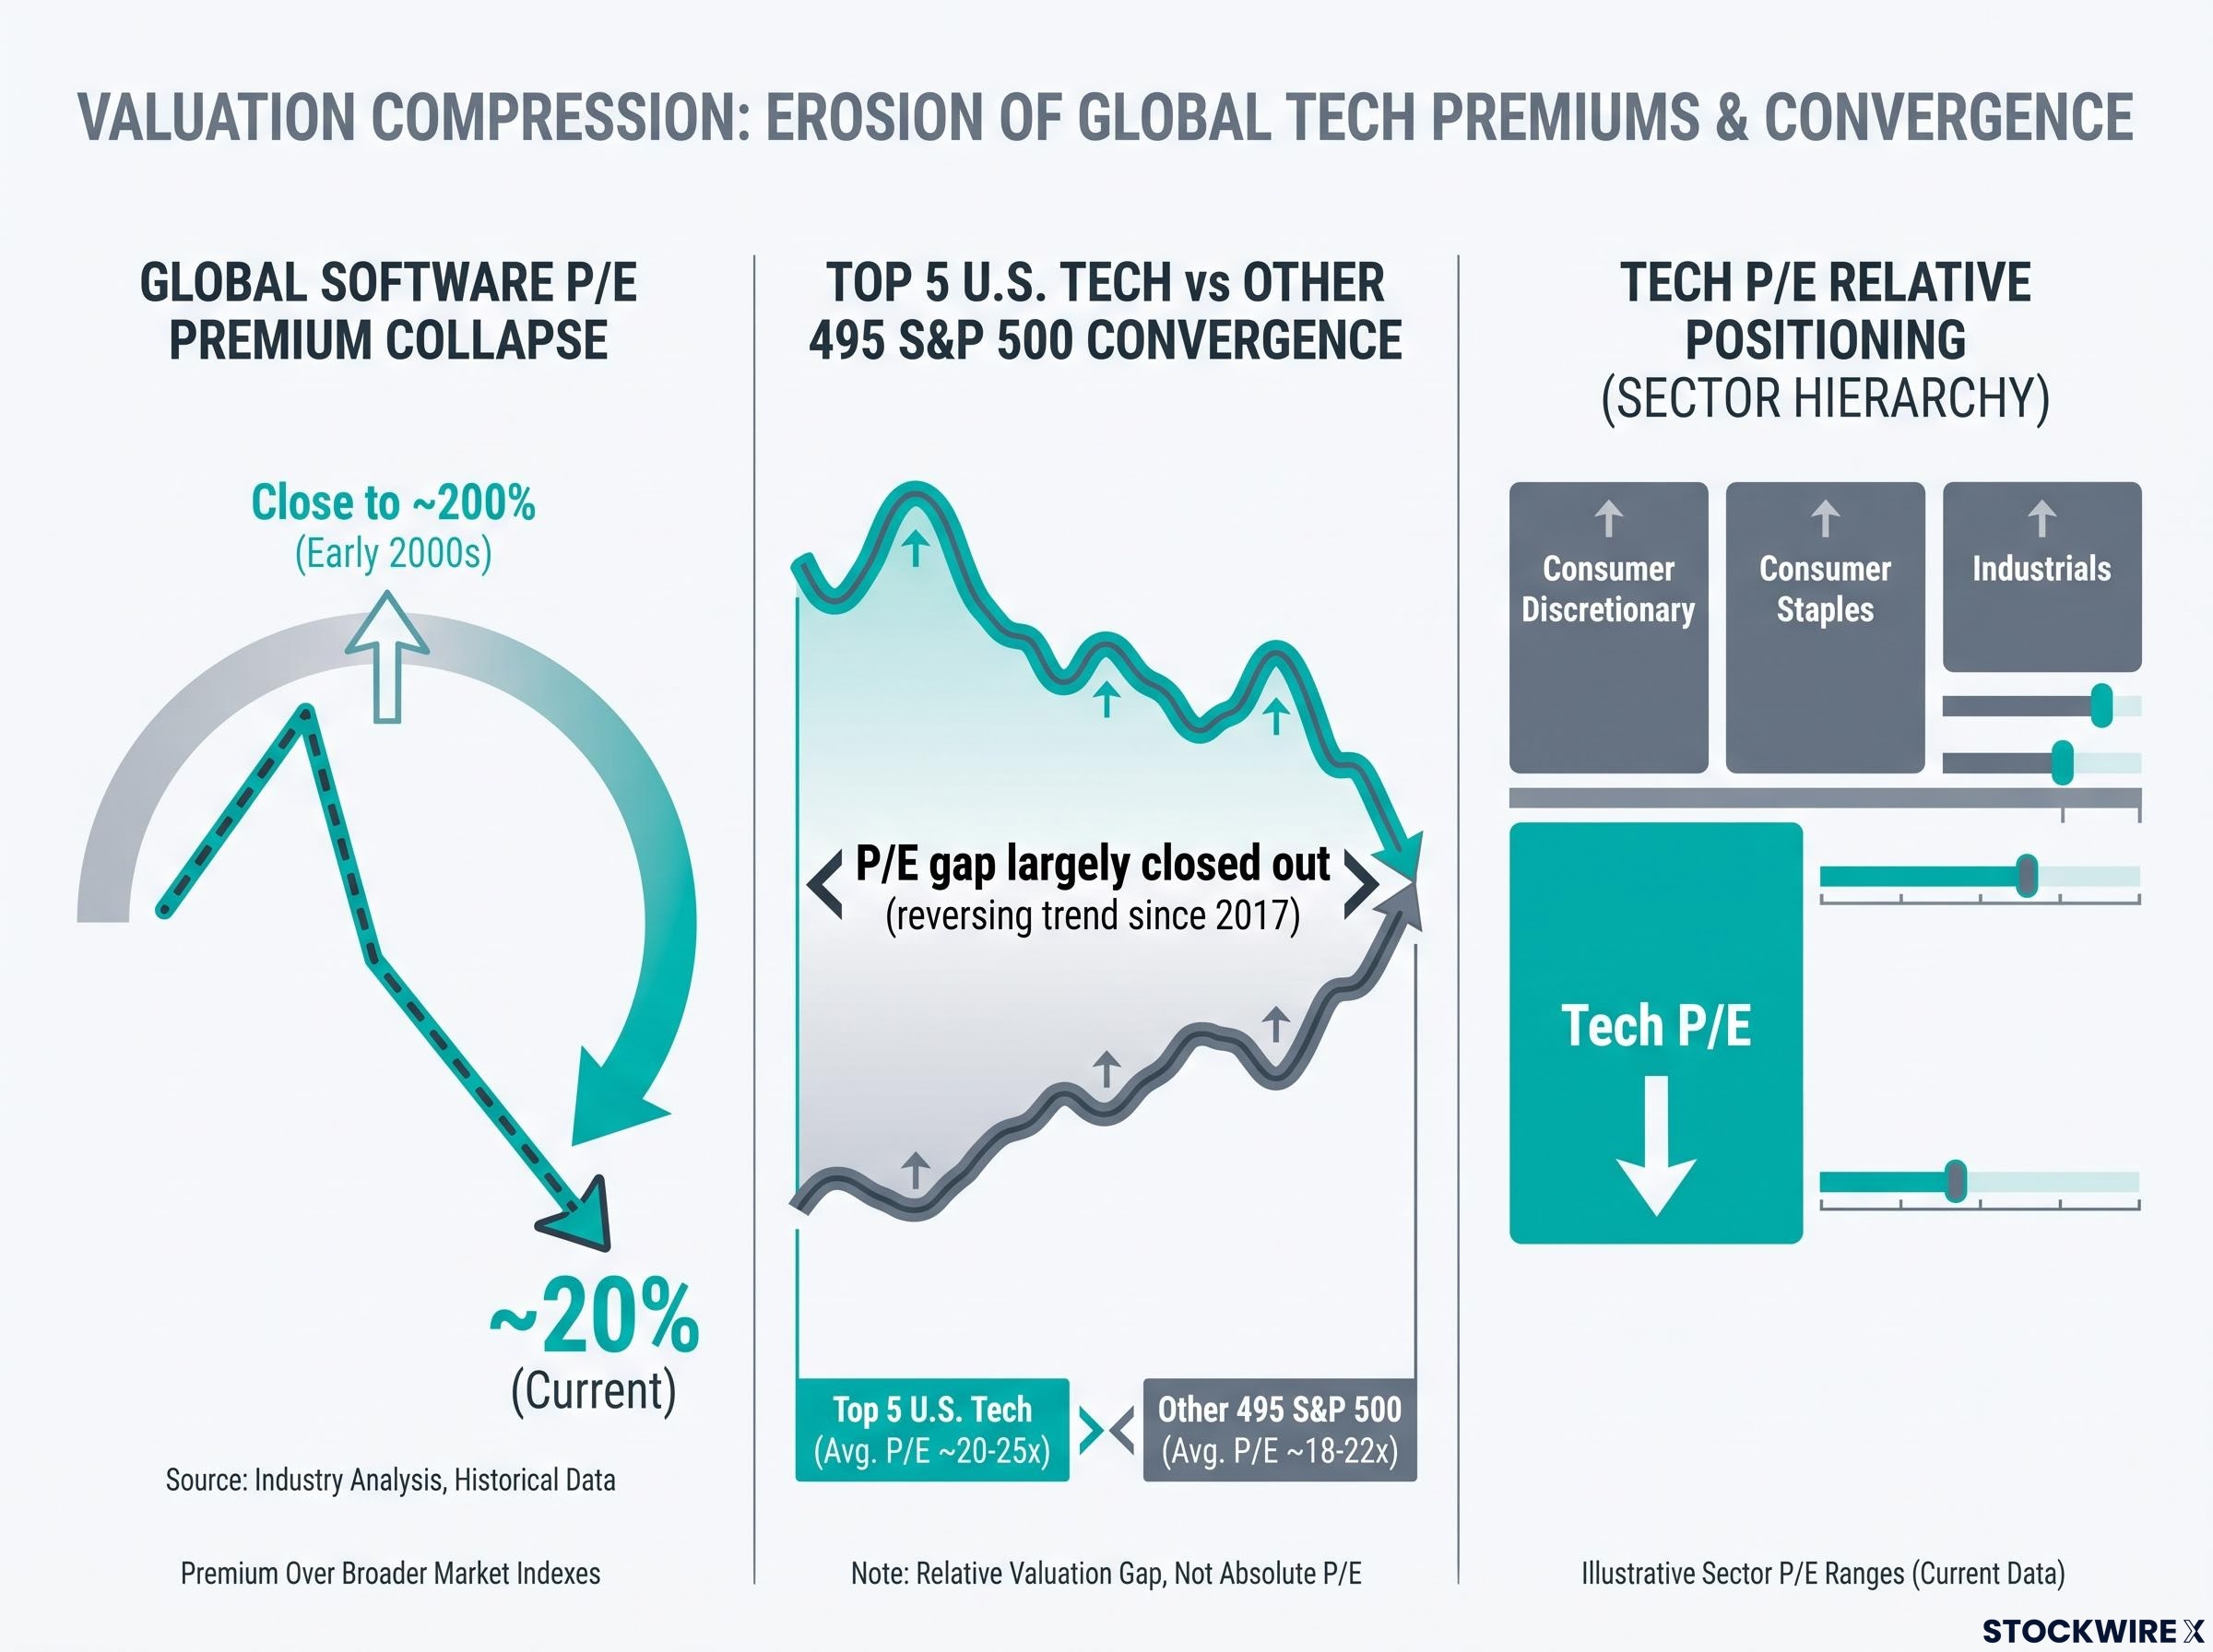
The valuation compression story is genuinely significant, and investors who have missed it are working with an outdated mental model of tech pricing. The scale of the re-rating is worth spelling out:
- The global technology sector’s P/E has fallen below that of consumer discretionary, consumer staples, and industrials, a historically rare configuration.
- The forward P/E advantage held by the five largest U.S. tech names over the other 495 S&P 500 constituents has largely closed out, reversing a gap that had persisted since 2017.
- Global software valuations have seen a steep de-rating, with the sector’s P/E premium shrinking to roughly 20%, a dramatic retreat from the close to 200% premium that characterised the early 2000s.
Goldman frames this as a potential technology value opportunity, and the data supports the framing. If you had told an investor in 2021 that tech multiples would fall below industrials while the companies continued to grow earnings, they would have called it a buying opportunity without hesitation.
Here is the caveat Goldman attaches. Lower multiples reduce the downside from multiple contraction considerably. But they do not protect against the scenario where earnings growth disappoints. The vulnerability has moved. The question is no longer whether you are overpaying for today’s earnings; it is whether today’s prices are correctly pricing tomorrow’s earnings trajectory.
The capex surge that is straining the earnings story
The abstract warning about earnings expectations connects to something already visible in reported financials. Since ChatGPT arrived and sparked a wave of AI investment, major cloud and infrastructure providers have sharply lifted capital expenditure, and that outlay has weighed on free cash flow, the cash left over after a company reinvests in its operations.
According to Goldman’s research, the scale of that capital spending is directly connected to weaker free cash flow generation and has contributed to tech underperforming more value-oriented international markets. The connection is direct: when companies spend more on infrastructure, less cash flows through to shareholders, and investors reprice accordingly.
Goldman’s concern about deferred returns is directly visible in hyperscaler cash flow statements, where the gap between AI capex vs returns has widened sharply: PIMCO estimates capital expenditure now absorbs 93-94% of hyperscaler operating cash flow, up from 33-40% in 2022-2023.
AI infrastructure investment is expected to drive approximately 50% of all S&P 500 earnings growth in 2026.
That concentration figure matters. For you, if you hold a passive S&P 500 index fund, roughly half of the index’s projected earnings growth this year depends on a small number of companies successfully converting a historically large capital investment into durable profits.
Goldman frames the unanswered question clearly: whether AI infrastructure spending generates returns proportional to its scale, and how quickly. The spending is already happening. The returns remain uncertain.
What Goldman’s research says to watch
Goldman’s analysis points to five metrics that would signal whether the earnings-expectation risk is materialising. Together, they form a monitoring framework that shifts the question from “is tech in a bubble?” to “which specific signals would tell me the earnings story is breaking down?”
- Earnings revisions: With 2026 gains driven almost entirely by earnings growth rather than multiple expansion, revisions are the primary lever. Downward revisions remove the core justification for current prices. Recent data suggests the market is punishing earnings misses more severely than usual: average post-miss declines of approximately 4.2% versus a historical norm of approximately 2.9% (these figures are directional estimates, not confirmed Goldman data).
- Capex productivity and AI monetisation: Whether AI infrastructure spending translates into revenue growth and margin expansion, or whether returns are deferred and diluted. This is the variable that resolves or deepens the tension Goldman has identified.
- Free cash flow yield: The direct signal of how the capex cycle is affecting cash generation. Deterioration here is an early warning of earnings pressure.
- Implied long-term earnings growth versus historical benchmarks: The aggregate market figure sits at approximately 10% currently, below the 2000 peak of approximately 16% and 2021’s approximately 13%. For the tech sector specifically, the DDM-implied growth rate is the more critical number to track, having already surpassed the 2000 reference point.
- Index concentration: The concentration of S&P 500 returns in a handful of large-cap tech and AI names means performance of those names is effectively the performance of the index for passive investors, even if broad sector valuations appear reasonable.
Index concentration amplifies the earnings-expectations problem Goldman identifies: when five companies control roughly 30% of total U.S. equity market capitalisation, a level that now exceeds the dot-com peak, a shortfall in their projected earnings growth is not a sector-level event but an index-level event for passive holders.
What the Goldman warning changes for tech investors in 2026
Goldman’s framing does not translate into a sell signal. It translates into a signal-migration notice. The metrics that would tell you a correction is coming have changed, and monitoring the old ones, P/E ratios, valuation multiples, relative pricing, without adding the new ones leaves you exposed to precisely the scenario Goldman has identified.
Both halves of Goldman’s message can be true simultaneously. Compressed multiples reduce one type of downside. Elevated implied earnings growth creates a different type of fragility. The tension between Goldman’s “technology value opportunity” framing and the “potential earnings bubble” warning is not a contradiction; it is two readings of the same data that depend on which variable breaks first.
The variable that resolves it is whether AI infrastructure spending delivers returns proportional to its scale. That question remains open. Goldman’s 3 August 2026 research is not a final verdict; it is a live, evolving analytical framework that has shifted where the risk sits.
If you hold large-cap tech, the appropriate response is not to exit but to change what you are watching.
This article is for informational purposes only and should not be considered financial advice. Investors should conduct their own research and consult with financial professionals before making investment decisions. Past performance does not guarantee future results. Financial projections are subject to market conditions and various risk factors.