
Stock markets are said to look three to 30 months into the future. So when the May 2026 flash Purchasing Managers’ Index (PMI) results landed on 21 May showing a contractionary UK composite reading of 48.5 and a French services PMI of 42.9, the question worth asking was not “what does this mean for growth?” It was: how much of this had equity markets already priced in months ago?
PMI releases rank among the most closely watched economic indicators on the global calendar. Yet the intuitive way many investors read them, treating a sub-50 print as a signal to sell and a number above 50 as a reason to buy, misunderstands how modern equity markets actually process economic information. Markets routinely move ahead of official survey releases by months or even years, reacting to surprises relative to consensus expectations rather than to absolute index levels. What follows explains exactly how that pre-pricing mechanism works, why the May 2026 PMI cycle is a live illustration of it, and what the current pattern of uneven global growth means for investors who understand the difference between economic data and what markets have already discounted.
What a PMI actually measures (and what it does not)
A PMI is a diffusion index. It records the net share of firms reporting improvement versus decline across categories such as output, new orders, and employment. The number captures breadth, how widely conditions are improving or deteriorating across a sector, but it says nothing about magnitude.
France’s services PMI of 42.9 in May 2026, the steepest contraction since late 2020, does not mean the sector shrank by 7.1%. It means more firms reported worsening conditions than improving ones, with no information about the size of the decline at any individual firm. The UK’s composite reading of 48.5, the most contractionary in five years, carries the same limitation.
The S&P Global PMI methodology establishes that composite readings are weighted diffusion indices, meaning a print of 42.9 captures the net breadth of deterioration across surveyed firms rather than any measure of the scale of contraction at individual businesses.
This distinction matters because diffusion indices are susceptible to amplification during periods of heightened uncertainty. When geopolitical stress, such as the Iran-linked Middle East tensions cited by survey panelists in May 2026, pushes firms into a cautious posture, sentiment-driven survey responses can paint a weaker picture than underlying output data will later confirm.
S&P Global noted in May 2026 that “post-pandemic, PMI-based output indices have occasionally painted a weaker picture than subsequently reported GDP, particularly in Europe.”
What PMI measures
- Direction of change (improving or deteriorating)
- Breadth of that change across firms
- Speed of sentiment shifts at the sector level
- Relative position above or below the 50 neutral threshold
What PMI does NOT measure
- Magnitude of output changes at individual firms
- Absolute level of economic output or GDP
- Revenue or profit figures for the companies surveyed
- Causation behind the directional shift
- Hard output data such as industrial production or retail sales volumes
Flash vs final PMI: why the revision matters
Flash PMIs are preliminary estimates covering approximately 80-90% of survey responses. Final readings arrive roughly two weeks later once remaining responses are incorporated. Headline market reactions typically occur on flash release day, meaning initial positioning moves sometimes need to be unwound or reinforced once the final data arrives.
When big ASX news breaks, our subscribers know first
Why markets move before the data is published
The institutional investors who drive the bulk of equity market pricing do not wait for official PMI releases to form a view on economic conditions. They use high-frequency real-time data, card spending, job postings, freight volumes, earnings revisions, and credit spreads, to build and adjust their growth expectations weeks and months before official surveys are compiled.
By the time a flash PMI lands, the market-moving content is concentrated in a single question: did the actual reading differ from what consensus already expected?
The price discovery mechanics that govern equity markets mean a single PMI data release can simultaneously reprice equities, credit spreads, and currency pairs within minutes, with most of the adjustment reflecting the surprise component rather than the absolute level of the reading.
BlackRock Investment Institute wrote in January 2026 that “equity discounting of growth shocks tends to begin 3-30 months before they show up in surveys.”
Goldman Sachs documented in March 2026 that PMI-driven equity index moves are “strongly linked to the surprise component relative to economists’ forecasts, not the absolute level.” The same dynamic appeared in a May 2026 Barclays strategy note observing that equity indices “tend to react more to the surprise versus consensus than to the PMI level itself.”
J.P. Morgan Asset Management’s 2Q 2026 Guide to the Markets framed it directly: “global PMIs remain a useful coincident check, but equity markets typically look 6-12 months ahead via earnings expectations and credit spreads.” The footprint of this pre-pricing shows up in sector and style rotations. According to S&P Global, equity markets “routinely move ahead of PMI turning points, with lead times of roughly 3-9 months when looking at sector and style rotations.”
The table below illustrates how different data sources feed into market positioning well before PMI publication day.
| Data source used by markets | When it arrives | PMI comparison point |
|---|---|---|
| Card spending data | Weekly or near-real-time | Consumer demand proxy vs PMI new orders |
| Job postings | Weekly | Labour demand vs PMI employment index |
| Freight volumes | Weekly to monthly | Goods movement vs PMI output index |
| Earnings revisions | Continuous (analyst cycle) | Corporate outlook vs PMI business expectations |
| Credit spreads | Daily | Risk pricing vs PMI directional signal |
When sub-50 does not mean recession: the historical record
The assumption that a sustained sub-50 PMI reading reliably signals recession has been tested repeatedly since 2022, and the record is clear: contractionary PMI readings and positive GDP growth can and do coexist.
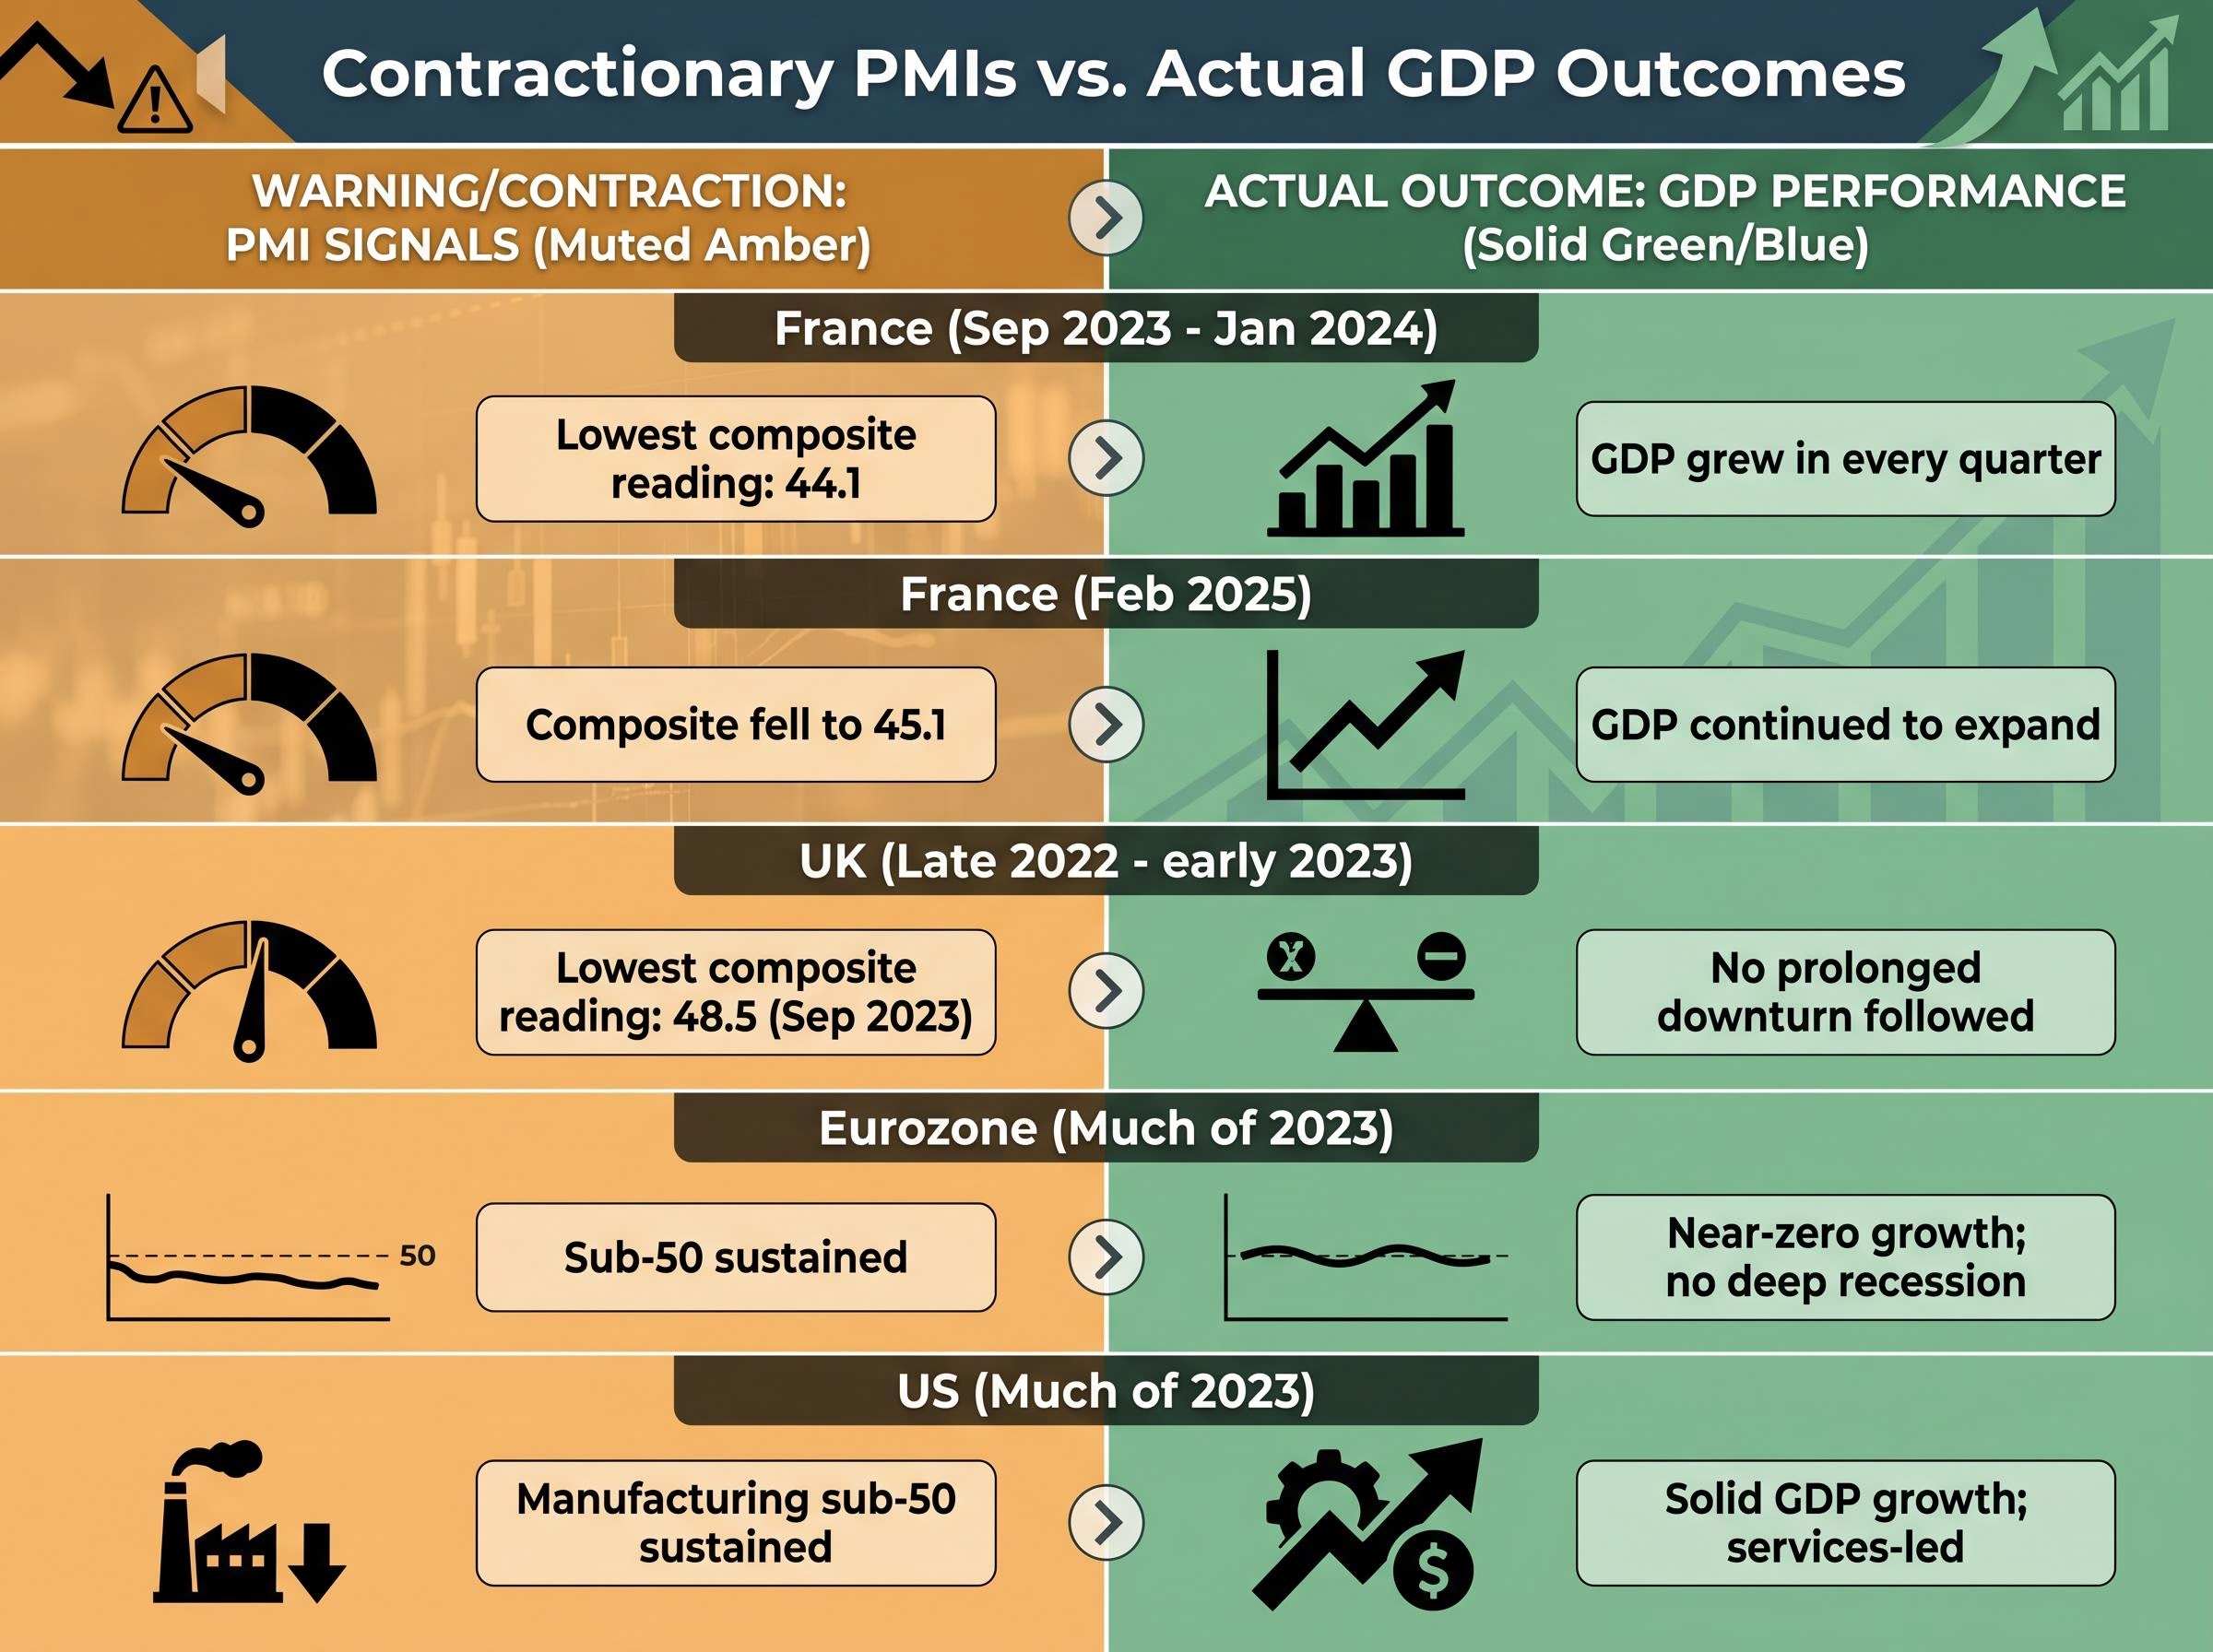
| Economy | PMI period | Lowest composite reading | GDP outcome |
|---|---|---|---|
| France | Sep 2023 – Jan 2024 | 44.1 | GDP grew in every quarter |
| UK | Late 2022 – early 2023 | 48.5 (Sep 2023) | No prolonged downturn followed |
| Eurozone | Much of 2023 | Sub-50 sustained | Near-zero growth; no deep recession |
| US | Manufacturing, much of 2023 | Sub-50 sustained | Solid GDP growth; services-led |
France’s experience is particularly instructive. The composite PMI hit 44.1 in September 2023 and remained around 44 through January 2024, yet GDP grew in every quarter during that period, according to FactSet data. A similar pattern repeated in early 2025, when the composite fell to 45.1 in February 2025 while GDP continued to expand.
The eurozone composite PMI spent much of 2023 below 50, yet real GDP “hovered around zero with occasional small positive quarters rather than a deep recession,” as the Financial Times reported in February 2024. In the US, manufacturing PMIs signalled contraction for much of 2023 while real GDP grew solidly, driven by services and consumer spending.
The OECD stated in November 2024 that “periods of sub-50 composite PMI readings have historically been associated with weak but not always negative GDP growth.” The ECB’s Economic Bulletin went further, noting that composite PMIs below 50 corresponded to “near-zero rather than negative GDP growth,” pointing to “a bias toward pessimism in times of heightened uncertainty.”
Three structural reasons help explain why GDP can outperform what PMI levels imply:
- Services resilience: Domestic services sectors often sustain positive output even when manufacturing and export-facing industries contract, supporting aggregate GDP.
- Fiscal support: Government spending and targeted fiscal measures can offset private-sector caution, maintaining demand that surveys do not fully capture.
- Post-shock survey bias: After disruptions such as the 2022-23 energy shock, firms tend to report more cautiously than hard output data later validates, producing a documented pessimism bias in PMI responses.
May 2026’s PMI cycle as a live case study in pre-pricing
The pattern of uneven global growth visible in the May 2026 flash PMIs had been widely anticipated. Financial media and sell-side research had spent months documenting the divergence between a resilient US economy and a weakening European outlook, meaning markets had already been adjusting positioning accordingly.
The April PMI fault lines that preceded the May 2026 readings were already visible in S&P Global’s data, with the eurozone services sector collapsing to 47.4 in April, down from 50.1 in March, while the US and UK held above 50, establishing the two-speed pattern that the May flash readings then confirmed and deepened.
US and Japan: above-50 with an asterisk
The US composite PMI remained above 50 in May 2026, with services firms still reporting expansion by a reduced but clear majority, according to FactSet. Japan’s composite reading sat near 50, reflecting a roughly equal split between expanding and contracting firms rather than confident broad-based growth.
A closer look at the manufacturing component introduces a qualification. In both the US and Japan, manufacturing expansion was driven partly by stockpiling activity linked to supply-chain anxiety, with firms building inventory as a precaution against potential disruptions. Output and new orders also registered in expansionary territory, but the stockpiling contribution suggests that some of the above-50 strength reflects defensive behaviour rather than organic end-demand.
Eurozone and UK: contractionary readings in context
France’s services PMI of 42.9 represented the steepest contraction since late 2020, with panelists explicitly citing “geopolitical uncertainty, notably in the Middle East,” according to S&P Global’s 21 May 2026 release. The UK composite of 48.5, the most contractionary in five years, carried similar attributions, with firms mentioning “geopolitical risks, including Middle East tensions” as adding to caution in investment decisions.
The Iran-linked conflict contributed to a wait-and-see posture among some businesses, moderating Q2 2026 growth somewhat. Yet the historical precedent covered in the previous section suggests these readings are consistent with stagnation rather than deep recession, precisely the kind of environment where depressed market expectations can be exceeded.
The eurozone stagflation risk visible in May 2026 PMI readings had been building across several weeks of data releases, with Q1 2026 GDP growth of just 0.1% quarter-on-quarter arriving alongside April inflation re-accelerating to 3.0% year-on-year, a combination that limits the ECB’s ability to cut rates even as survey data signalled contraction.
| Economy | May 2026 composite PMI | Direction vs 50 | Key driver cited | Prior market pricing context |
|---|---|---|---|---|
| US | Above 50 | Expansionary | Services strength; manufacturing stockpiling | Resilience widely expected; AI-driven earnings optimism |
| Japan | Near 50 | Borderline | Manufacturing stockpiling; mixed services | Modest growth expectations priced in |
| France | 42.9 (services) | Contractionary | Geopolitical uncertainty (Middle East) | Weakness anticipated; forecasts already trimmed |
| UK | 48.5 (composite) | Contractionary | Geopolitical risks; investment caution | Slowdown priced via weak earnings revisions |
The investment case built on depressed expectations
When markets have already priced in a pessimistic scenario, even an outcome that merely avoids the worst case constitutes a positive surprise. This asymmetric dynamic sits at the centre of the current opportunity in non-US equities.
Morgan Stanley strategists argued in May 2026 that “non-US equities offer the most attractive 12-month upside in years, mainly because expectations are so depressed in Europe and Japan relative to the US.”
The logic chain runs through three connected steps:
- PMI pessimism is amplified by geopolitical uncertainty. Survey respondents in France and the UK are reporting cautiously against a backdrop of Iran-linked Middle East tensions, a pattern documented to overstate underlying weakness.
- Valuations embed near-recessionary scenarios outside the US. European and Japanese equities carry multiples that discount severe slowdowns, while US valuations already reflect exceptional earnings resilience and AI-driven productivity gains.
- The bar for positive surprise is low. If ex-US growth merely stabilises rather than deteriorating further, the gap between priced expectations and actual outcomes could generate meaningful relative outperformance.
Goldman Sachs noted in April 2026 that “under-owned European and Japanese equities could outperform on any upside surprise to still-subdued growth expectations,” citing “gloomy PMI-linked sentiment” in the euro area as creating a low hurdle. UBS Global Wealth Management described US equities as “fully priced” for a soft landing and AI productivity gains, while ex-US valuations “bake in a more severe slowdown than current data justify.”
Barclays reinforced the point, noting that cyclical and value sectors in Europe and Japan had underperformed into weak survey data, implying “a low bar for positive PMI surprises.”
Warmer US sentiment as a relative benchmark
US investor sentiment and valuations reflect continued confidence in AI-driven productivity and earnings resilience, creating a meaningful contrast with ex-US pessimism. The relative gap in expectations, rather than absolute pessimism in any single region, is what creates the opportunity. If European or Japanese growth merely meets modest forecasts rather than deteriorating further, the valuation gap could narrow.
The data is already old news. Here is what investors should do now.
By the time a flash PMI is published, markets have typically spent months pricing the trajectory it confirms. The investment question is never “what does this number mean for growth?” It is: what does this number tell you about the gap between current market pricing and likely economic outcomes?
For any future PMI release, three questions provide a practical interpretive framework:
- What had consensus already expected? Identify the median economist forecast and the direction of recent revisions before the number drops.
- Where did the actual reading land relative to that expectation? The surprise component, not the absolute level, drives the market-moving signal.
- Does the geopolitical or structural context suggest the survey is amplifying or accurately capturing underlying activity? Post-shock environments, including the current Iran-linked uncertainty, have a documented tendency to push survey responses toward pessimism beyond what hard output data validates.
Bank of England staff recommended in March 2026 combining PMIs with “card-spending, payrolls, and tax data rather than relying on surveys alone.”
BlackRock echoed the same conclusion, advising investors to pair PMIs with high-frequency hard data such as card spending, payrolls, tax receipts, and freight volumes rather than reading survey levels in isolation.
Investors applying the same interpretive logic to other major economic indicators will find our full explainer on interpreting GDP releases, which examines how advance estimates carry average absolute revisions of roughly 0.6 percentage points, why markets price GDP expectations weeks in advance using PMIs and nowcast models, and how to identify when a headline miss is genuinely new information versus a figure markets had already absorbed.
The May 2026 flash readings remain preliminary, covering approximately 80-90% of responses, with final data due roughly two weeks later. And final Q2 2026 GDP figures for the eurozone and UK are not yet available, meaning the pre-pricing thesis cannot yet be benchmarked against hard output data the way 2022-24 episodes have been. The framework is not a guarantee. It is, however, the lens through which institutional capital is already interpreting the numbers.
This article is for informational purposes only and should not be considered financial advice. Investors should conduct their own research and consult with financial professionals before making investment decisions. Past performance does not guarantee future results. Financial projections are subject to market conditions and various risk factors.