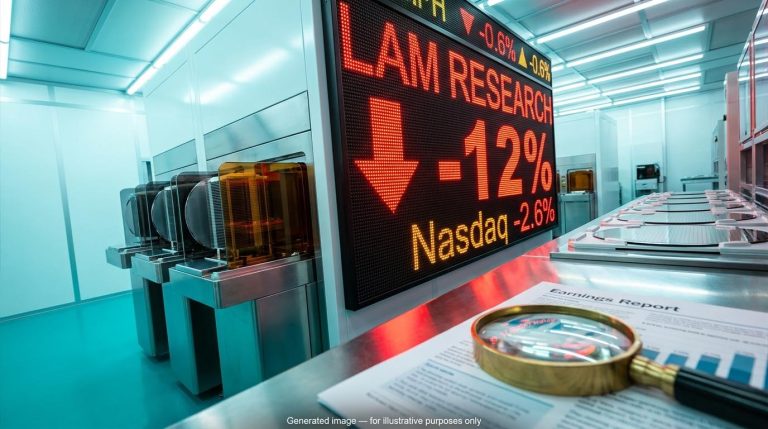
Three alarming signals arrived in one week. France’s 10-year borrowing cost closed above 5% for the first time since 2002, Brent crude traded near $115 a barrel, and bonds tied to the artificial intelligence (AI) build-out slid to distressed levels. Yet Fisher Investments still describes the backdrop as a bull market, one climbing its familiar wall of worry.
The worries feel urgent because stocks have started to wobble. The Nasdaq Composite has slipped roughly 6% from its 6 October high, and each new headline seems to confirm the last.
Markets often rise while investors stay anxious. But “wall of worry” can also become a convenient way to wave away real danger, and that is the question you face: three threats, or three noisy signals?
Here is a practical test for sorting the two, built on sovereign yields, inflation-adjusted oil and market sentiment. It ends with a short list of indicators that would tell you when the verdict needs to change.
Why is France’s 5% bond yield not being treated as a debt crisis?
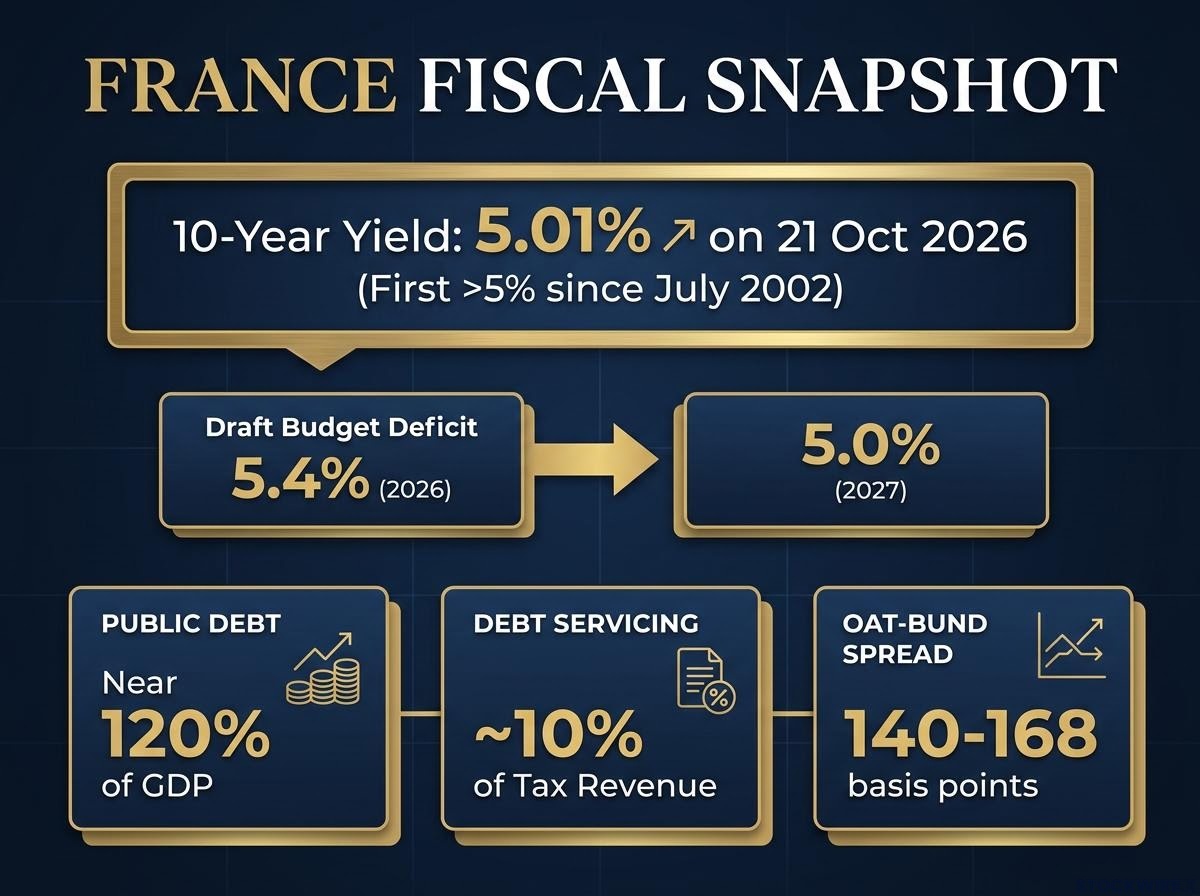
On 21 October, the yield on France’s 10-year government bond, known as the OAT, closed at 5.01%. A bond yield is the annual return investors demand to lend to a government, so a higher yield means borrowing costs more.
Key milestone France’s 10-year yield closed at 5.01% on 21 October 2026, its first close above 5% since July 2002.
The move came fast, with yields up nearly 80 basis points since the start of September (a basis point is one-hundredth of a percentage point). On the surface, that looks like the opening scene of a sovereign debt scare.
What is driving yields higher in France and elsewhere
Two forces are overlapping, and separating them changes how alarming the number looks:
- French fiscal and political doubt: The draft budget targets a deficit of 5.0% of GDP in 2027, down from a projected 5.4% in 2026, with public debt near 120% of GDP. Investors question whether a divided parliament can pass €43-54 billion of fiscal measures, while France plans record issuance of about €340 billion in 2027.
- Global term-premium and growth effects: Yields are also climbing in the US, Germany and Japan as investors demand more compensation for inflation, heavy government borrowing and stronger growth data.
The France-specific part shows up in the gap over German bonds, the OAT-Bund spread, which sits at roughly 140-168 basis points. Think-tank Bruegel warns of a refinancing loop: higher yields raise interest costs, widening the deficit and requiring more issuance, which pushes yields higher still.
The France-specific stress is visible in a spread that reached its widest since 2011 in early October, and it has pushed a large share of French corporate bonds to yield less than the government itself.
Why Fisher calls the crisis talk exaggerated
Fisher’s test is the shape of the move. True debt crises tend to bring yield spikes into the teens or higher, confined to one country, and France is nowhere near that.
Debt servicing absorbs about 10% of French tax revenue, and according to Fisher it took a larger share in the late 1990s and early 2000s without derailing the economy. Budget figures vary by measure: €91.2 billion of broader public interest payments in 2027 against €72.9 billion for the central government alone. These are different accounting lenses, not contradictions.
The counterargument is quieter but real. Because France rolls its debt over gradually, a prolonged spell near 5% steadily lifts interest costs without any dramatic spike, which is why the International Monetary Fund (IMF) rates short-term distress risk as low but overall debt-distress risk as moderate.
What this tells you is that France faces a slower, more expensive fiscal squeeze rather than an imminent default. “Not a crisis” and “not a problem” are different claims, so watch persistence, not the round number.
When big ASX news breaks, our subscribers know first
Does $115 oil threaten stocks, or has the worry been priced in?
Triple-digit oil carries an instinctive fear. Brent traded near $115 on 23 October, after the Iran conflict and the closure of the Strait of Hormuz sent prices soaring in spring.
Much of today’s price reflects a Hormuz risk premium, with structural forecasts near $60 implying a gap of $40-50 that would shrink quickly if supply routes normalised.
Fisher’s case for calm starts with inflation. Oil first topped $100 in 2008, and that price equals roughly $65 in today’s money, so today’s nominal level is not the record it appears to be.
Two further supports follow. The US and EU use up to three quarters less oil per unit of GDP than in the 1970s, and non-Gulf producers in the Americas lifted output by about 1.4 million barrels per day through August. The International Energy Agency (IEA) expects non-OPEC+ supply growth of about 1.5 million b/d in 2026, while members had released about 325 million barrels of strategic reserves by 3 October, with the G7 adding a further 100 million barrel release.
| Factor | Fisher’s reassurance | The bearish counterpoint |
|---|---|---|
| Price level | $100 in 2008 is roughly $65 today, so real prices are less extreme | A prolonged surge can still feed headline and core inflation through second-round effects |
| Economic sensitivity | US and EU use up to three quarters less oil per unit of GDP than in the 1970s | IEA forecasts a 2.6 million b/d fall in average 2026 demand amid a weakening outlook |
| Supply | Non-Gulf output up about 1.4 million b/d; reserves released | Reserves bridge gaps but cannot replace lost Gulf production or repair infrastructure |
One caveat: Fisher puts the April peak at $138, but other available data showed highs near $126, so treat the higher figure cautiously.
The reassurance holds until supply breaks again. A renewed Hormuz closure or attacks on Gulf facilities could trigger a second spike even as non-Gulf output grows. For you, the lesson is that a price alone tells you little; judge any oil shock by its real level, the economy’s dependence on it, and whether supply can adapt.
How worried should you be about AI debt stress?
The evidence of stress
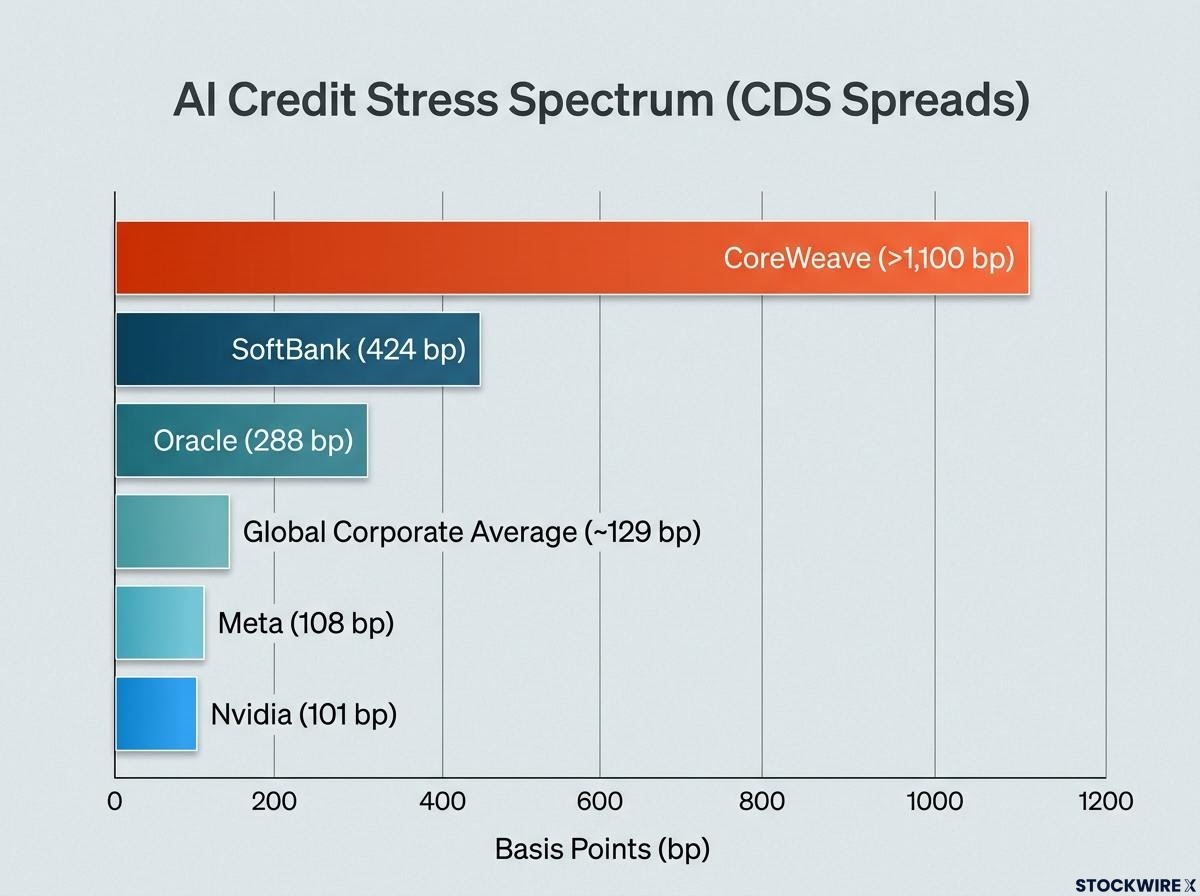
The credit numbers are stark. CoreWeave’s 2031 bonds have yielded as much as 16%, its 2032 bonds trade below 80 cents on the dollar, and its five-year credit default swaps (CDS) sit above 1,100 basis points. A CDS is insurance against a borrower defaulting, so a higher price means the market sees more risk.
Equities felt it too. Reuters reported the Nasdaq’s largest one-day drop in three months on 14 October, and the index closed at 25,955.34 on 23 October against a 27,599.79 high on 6 October.
Behind it sits a borrowing surge: AI-linked firms issued about $466 billion of debt in 2026, versus $101 billion in the comparable 2025 period, according to Morgan Stanley-related reporting. Oracle CDS reached 288 bp and SoftBank 424 bp, while Bloomberg data show global corporate spreads at about 129 bp, the widest since May 2025.
The stress is not uniform across the sector: Oracle’s credit default swaps have risen sharply while equity valuations barely moved, a gap that shows credit markets pricing risk stock investors have yet to absorb.
Contained or systemic?
Then the picture splits. Meta CDS stand at 108 bp and Nvidia at 101 bp, far below CoreWeave. The market is differentiating among borrowers, which is what contained repricing looks like.
| Source | Mechanism | Assessment |
|---|---|---|
| Fisher Investments | Severe deterioration confined to the riskiest issuers | Contained, not systemic |
| IMF | Disappointing AI returns could hit tech, bonds and lenders at once; AI issuance competes with governments | Bearish risk case, potentially broader than an equity correction |
| ESRB and Banque de France | Unusually large big-tech issuance in H1 2026 concentrates risk around AI financing | Genuine stability risk if exposures spread; no systemic crisis yet |
| Morgan Stanley-related reporting | Issuance surge enlarges debt exposed to an AI repricing | A vulnerability even if defaults stay low initially |
Fisher reads the current scrutiny as healthy, unlike the euphoria that marks bubbles, and points to growth in sectors and regions with little AI exposure. The IMF and European authorities focus on correlation: simultaneous refinancing needs, falling collateral and hidden exposures at banks and funds.
Nobody disputes the stress itself; the argument is about transmission. Credit spreads give you an early-warning layer that share prices alone do not, and rapid issuance leaves the system more exposed if differentiation gives way to contagion.
What would turn three worries into a real bear market?
How to tell a worry from a threat
Your instinct may be that a scary headline means danger. Markets often work the other way: they tend to rise while investors stay anxious, and euphoria, not fear, has historically marked late-cycle peaks. Three questions help you filter any headline:
- Is it widely known? Oil fears have dominated since the conflict began, so they are less likely to surprise markets.
- Is it measured in real terms? A nominal price ignores inflation, while a real price adjusts for it, which is how $100 in 2008 becomes about $65 today.
- Is it isolated or spreading? A credit spread is the extra yield a borrower pays over a government; CoreWeave’s wide spread beside Nvidia’s narrow one shows isolation, and France’s gradual rise differs from a crisis-style spike.
The filter works on any future headline, not just these three.
The cost of reacting to every alarming headline with panic selling has historically been locking in losses just as the odds of the worst outcome begin to recede.
Fisher’s base case passes this test today. The danger lies in persistence: prolonged high oil, elevated sovereign yields and AI refinancing pressure could reinforce one another. History shows what genuine escalation looks like:
- 2008: High oil became dangerous alongside weak demand and tight credit.
- 2011: Euro-area sovereign spreads and bank funding costs fed each other.
- 2022: A duration shock produced simultaneous equity and bond losses.
| Risk | What to watch | Why it matters |
|---|---|---|
| AI credit contagion | AI-borrower bond prices, CDS, high-yield spreads ex-AI, bank and private-credit exposure | Losses could spread through lenders and weaken refinancing access |
| French fiscal loop | OAT-Bund spread, auction demand, budget support in parliament | Persistence raises refinancing costs and complicates consolidation |
| Global term-premium shock | Inflation expectations, real yields, foreign auction demand | Higher discount rates pressure equities, housing and corporate borrowing |
| Oil-driven stagflation | Brent futures curve, fuel prices, demand forecasts | Squeezes real incomes while limiting central-bank support |
Fisher expects volatility to ease as budget and political clarity emerge, while the IMF and European systemic-risk authorities remain the strongest counterweight. Treat these indicators as triggers: stress spreading beyond a few borrowers, beyond France, or beyond a temporary oil spike is what would change the verdict.
Reading the wall of worry: what holds, what to track
Fisher’s base case is plausible: AI stress looks concentrated, France remains financeable, and oil supply is adapting. Its strength rests on persistence and spillover, not on any single data point.
Your task is to monitor rather than predict. Three gauges matter most: the OAT-Bund spread, credit spreads on AI borrowers beyond CoreWeave, and the shape of the Brent futures curve. If those stay contained, the worries remain noise; if they widen together, the wall becomes a ceiling.
This article is for informational purposes only and should not be considered financial advice. Investors should conduct their own research and consult with financial professionals before making investment decisions. Past performance does not guarantee future results, and forward-looking views cited here are speculative and subject to change.