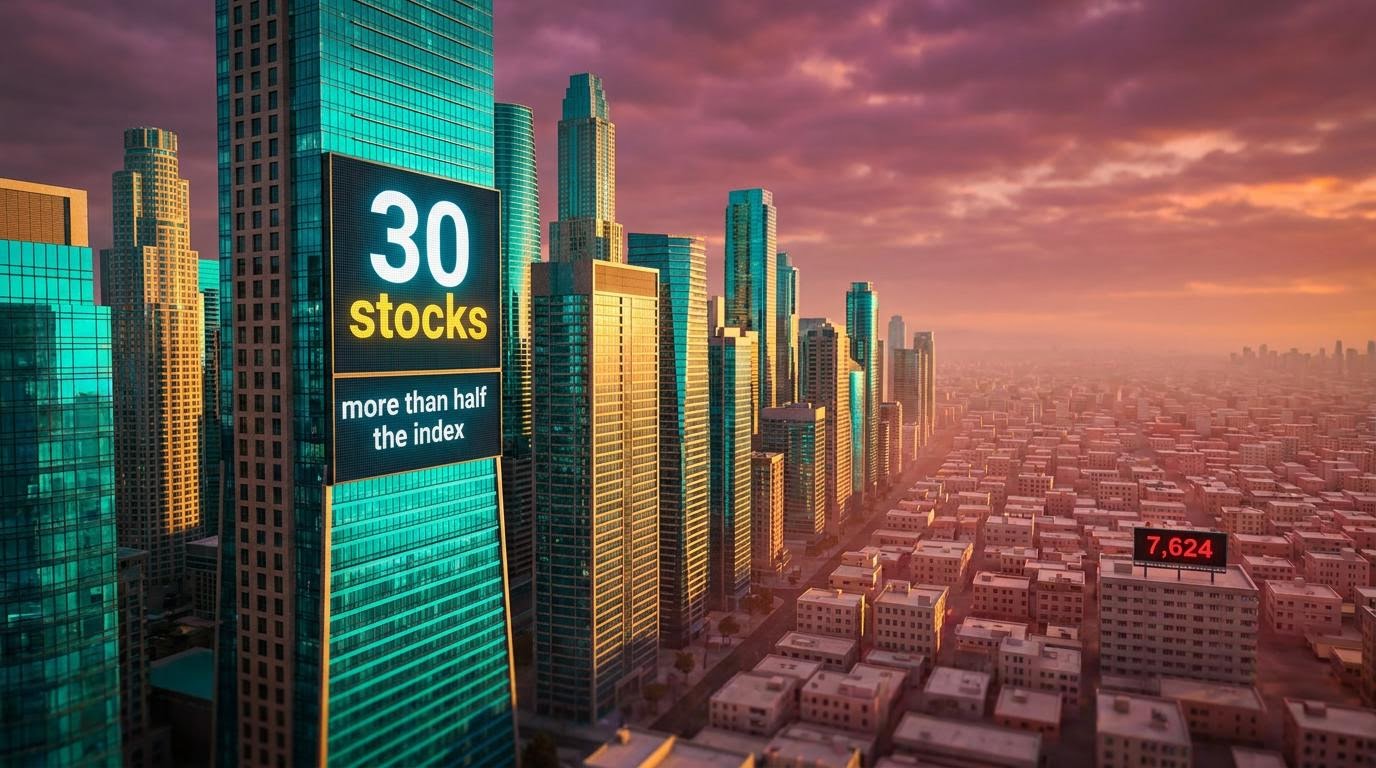
Buying an S&P 500 fund feels like buying a slice of 500 American companies. In practice, roughly 30 stocks carry more than half the index’s weight, and that level of S&P 500 concentration means more than 40% of members are down this year even as the headline number shows a double-digit gain.
The index closed near 7,624 on 23 October 2026. That figure looks like a broad vote of confidence, but a surprisingly small group of companies did most of the work to get there.
If you treat your index fund as broad diversification, you may be carrying far more exposure to a single theme than you realise. That theme is artificial intelligence (AI).
Here is how much of your fund rides on a handful of AI-linked names, how thin the rally underneath them has become, and what a decline concentrated in those leaders could do to the index.
Why does a “500-stock” index behave like a 30-stock bet?
How the weighting feedback loop works
The S&P 500 uses float-adjusted market capitalisation weighting. Market capitalisation is a company’s share price multiplied by its shares available for public trading, and the index gives each company a weight in proportion to that value. A bigger company moves the index more.
The loop starts there. When Nvidia‘s share price climbs, its weight rises automatically, and every passive fund tracking the index must hold more of it. Winners grow into ever-larger slices of your fund without any manager choosing them.
When rising prices lift index weights and passive inflows must follow, holders of broad funds end up with implicit AI exposure they never consciously chose, which is why a plain index fund can behave like a thematic position.
That makes concentration structural for cap-weighted funds. The current degree, however, depends heavily on continued AI spending.
Where the weight sits today
The three largest holdings in the SPDR S&P 500 ETF (SPY) as of 24 October:
- Nvidia: 8.36%
- Apple: 7.35%
- Microsoft: 5.76%
These figures shift with holdings dates, daily price moves and differences between fund and index weights. Nvidia’s weight alone exceeds Coca-Cola, Merck and Costco combined.
| Measure | Approximate weight | Source/date |
|---|---|---|
| Top 3 | 21.5% | Yahoo Finance, 24 Oct 2026 |
| Top 10 | 39% | Yahoo Finance (SPY), 24 Oct 2026 |
| Top 20 | 49% to just over 50% | BlackRock (updated 2 Oct 2026); late-October snapshots |
| Top 30 | 55-56% | Contemporaneous snapshots (approximate) |
The top-20 and top-30 figures vary by source and date. No published top-30 aggregate exists, so treat that number as approximate.
The index-point view makes the scale tangible. Roughly 4,300 of the 7,624 points come from about 30 companies, around 6% of constituents. Nvidia alone accounts for roughly 570-590 points, which exceeds the index’s entire level at its March 2009 low of 666.
The top group is mostly tech and AI, joined by Eli Lilly, Berkshire Hathaway, JPMorgan, ExxonMobil, Visa and Walmart. For you, the read is direct: a large share of your return depends on whether about 30 companies, most of them AI-linked, keep delivering.
When big ASX news breaks, our subscribers know first
Is the 2026 rally broad, or is it hiding weak breadth?
On the surface, 2026 has been a comfortable year. Reuters put the S&P 500 up about 14% year to date through 12 October, while price-return figures through 23 October show roughly 11.4%. The gap reflects the measurement date and the difference between price return and total return, which includes dividends.
Peel back the first layer and the picture thins.
| Measure | Figure | Date | Source |
|---|---|---|---|
| Cap-weighted S&P 500 | ~14.0% | 7 Oct 2026 | Opening Bell Daily News |
| Equal-weight S&P 500 | ~9.9% | 7 Oct 2026 | Opening Bell Daily News |
| Median constituent | ~4% / 5.7% | 12 Oct / 15 Oct 2026 | Reuters; Opening Bell Daily News |
| Members down YTD | 40%+ / ~37% | 12 Oct / 15 Oct 2026 | Reuters; Opening Bell Daily News |
An equal-weight index gives every member the same slice, so it shows how the average company performed. It trails by about four percentage points. The median stock, the one sitting exactly in the middle, has earned only 4-6% against SPY’s 13.2% through 15 October.
Counts of losers differ: Reuters tallied at least 200 members in negative territory, while Opening Bell Daily News counted 185 of 499. Either way, roughly four in ten stocks are down in a rising market.
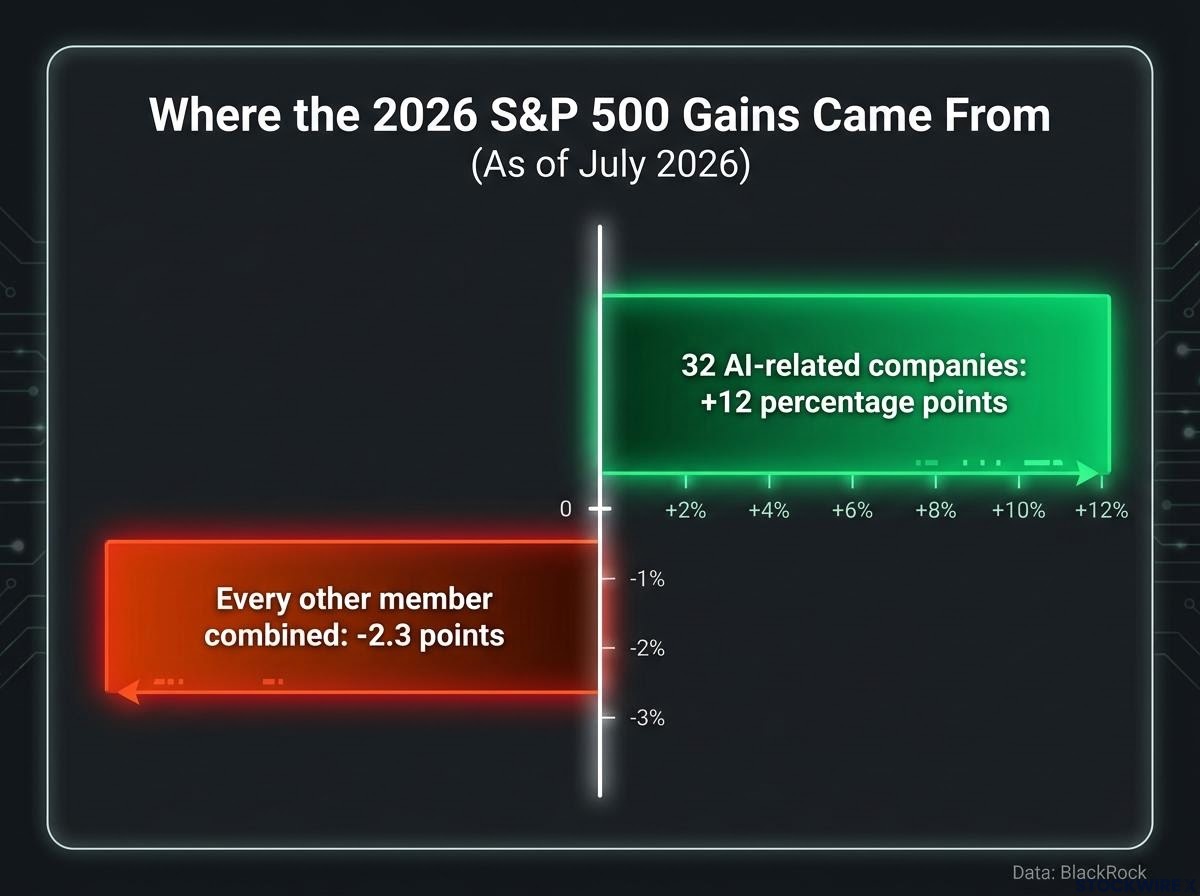
Where the gains came from BlackRock found in July 2026 that 32 AI-related companies contributed 12 percentage points to the index’s year-to-date return, while every other member combined contributed -2.3 points.
Strategists have flagged the imbalance:
- Tim Ghriskey of Ingalls & Snyder argues the pull of AI companies is leaving other stocks ignored.
- Morgan Stanley strategists describe the rest of the market as having gone through a multi-month correction beneath the surface.
If you hold anything beyond the mega-caps, your own year may look very different from the number on the evening news.
How unusual is this level of concentration, and what do institutions say about it?
Narrow leadership would matter less if it were normal. It is not.
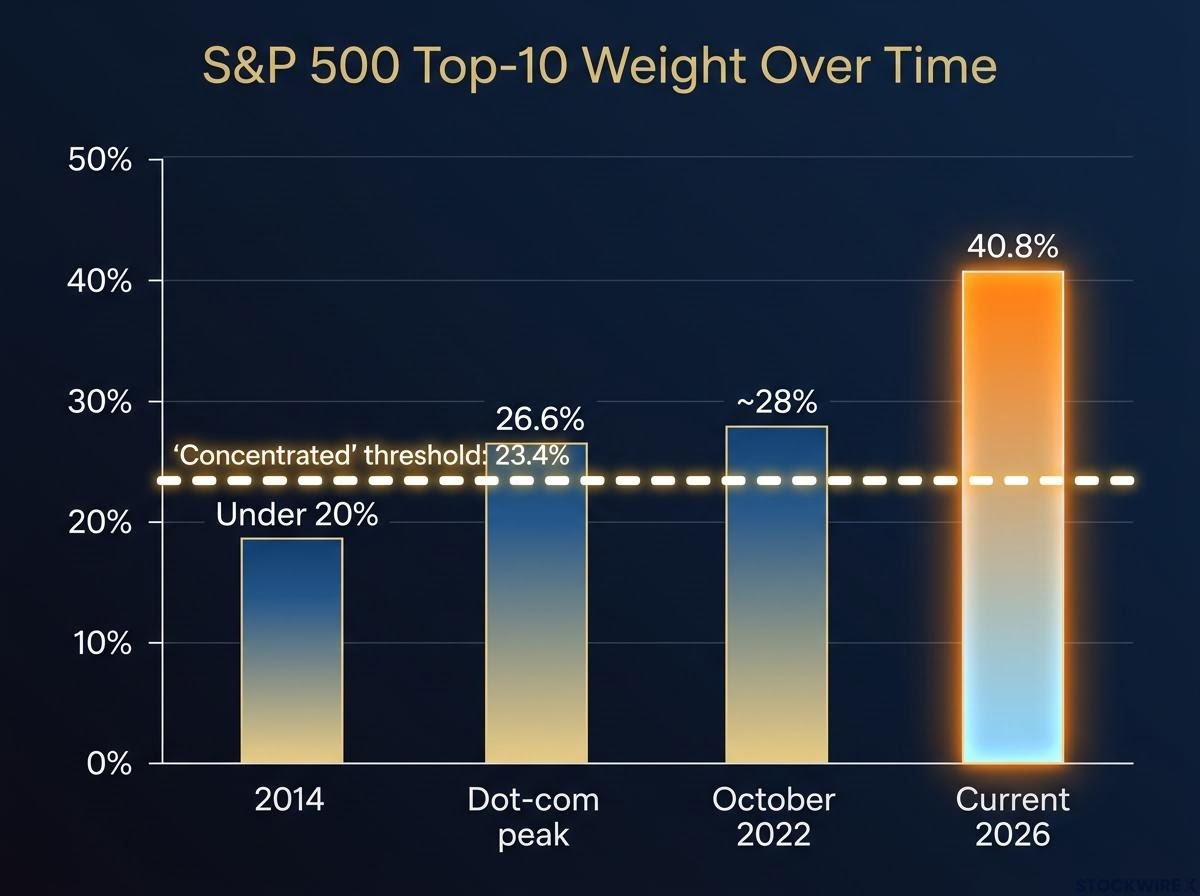
| Period/comparison | Top-10 weight | Source/date |
|---|---|---|
| Current 2026 | 40.8% | J.P. Morgan Asset Management, 20 May 2026 |
| October 2022 | ~28% | J.P. Morgan Asset Management via Reuters |
| Dot-com peak | 26.6% | J.P. Morgan Asset Management |
| “Concentrated” threshold | 23.4% | Brown Brothers Harriman, 22 Jan 2026 |
| 2014 | Under 20% | Invesco |
State Street Global Advisors frames it another way: the index once diversified like about 120 equally weighted stocks before the pandemic, and now behaves more like 50. Still, today’s leaders are far more profitable than most dot-com firms, so this is not a straight valuation comparison.
Wolfe Research data show record market concentration across the wider US equity universe too, with five companies near 30% of total market capitalisation, a level that sits beyond even the dot-com peak.
The bull case
- BlackRock Investment Institute: AI infrastructure and hyperscaler earnings grew 54% year on year in Q2 2026, against 14% for the rest of the index.
- Goldman Sachs Research: nearly half of 2026 S&P 500 earnings per share growth comes from AI investment, with hyperscaler capital expenditure (spending on data centres and equipment) potentially reaching $800 billion.
- State Street: correlations among the largest holdings have recently declined, and the mega-caps span different businesses and regions.
The bear case
- Goldman analysts: if semiconductor gross margins fall from about 70% to their 15-year average of 55%, S&P 500 earnings could drop roughly 10%.
- Angelo Kourkafas, Edward Jones: if the prevailing theme falls out of favour, portfolios could feel an outsized impact.
- Goldman Sachs Asset Management: narrow leadership raises sensitivity to earnings disappointments and the risk of a disorderly correction.
Schwab and others point to equal-weight funds, small caps, international shares and value strategies as diversifiers. The takeaway for you: this concentration rests on real earnings, so it is not automatically a bubble, but your portfolio now carries one dominant theme that can reverse.
What could a top-heavy decline do to the index?
The arithmetic
A simple model shows the exposure. Multiply the top 30’s weight (about 55-56%) by how far those stocks fall, and you get the approximate index loss, assuming the other 470 stake nothing.
Illustrative model, not a forecast These scenarios are simplified arithmetic. No institution has published a forecast for the top 30 falling by any specific amount.
| Scenario | Top-30 move | Estimated index impact |
|---|---|---|
| Others flat | -20% | ~-11% |
| Others flat | -35% | ~-19.6% |
| Others flat | -50% | ~-28% |
| Others down 10% | -50% | ~-32% |
A 35% drop in the leaders brings the index to the edge of a bear market, commonly defined as a 20% fall from the peak. A 50% drop pushes it well past that line, even with the remaining 470 stocks unchanged.
The same logic scales: a hypothetical 60% weight falling 30% would subtract about 18% from the index. D.E. Shaw found the top 10 carry aggregate volatility about 1.5 times that of the S&P 500, so large swings in that group are hardly far-fetched.
History offers reminders. The 2000-2002 tech bust, the Nifty Fifty unwind of the 1970s and the 2022 mega-cap drawdown each showed that quality companies can still fall hard when expectations reset.
What the model leaves out
The top 30 include Walmart, ExxonMobil and other very different businesses, so a simultaneous collapse would need a broad shock. State Street’s falling-correlation finding cuts the same way, and the model ignores second-round earnings effects that could help or hurt the rest of the index.
De-concentrating carries its own costs.
| Approach | Benefit | Trade-off |
|---|---|---|
| Equal-weight S&P 500 (e.g. RSP) | Each member about 0.20% | Can lag in a mega-cap-led rally |
| Small/mid-caps | Less AI mega-cap exposure | More volatile and economically sensitive |
| International equities | Different sectors, currencies, valuations | Currency and country risks |
| Value/quality factors | Less reliance on high-multiple growth | Can lag for long periods |
| Multi-asset mix | May cushion drawdowns | May reduce returns if equities keep leading |
BlackRock warns that underweighting mega-caps is itself a large active decision that could leave you behind. A bear-market-sized drop would not need the whole market to fall, only the largest names, and you have to weigh that against the cost of lagging if they keep winning.
For readers wanting a practical framework, our dedicated guide to managing AI stock concentration risk sets out position-sizing caps and rebalance triggers.
Past performance does not guarantee future results. These scenarios are speculative and subject to change based on market developments.
What the concentration data changes, and what it does not
Three findings stand out. About 30 stocks carry more than half the index’s weight, the breadth beneath the 2026 gain is thin, and a decline concentrated in those leaders could push the index into bear-market territory on its own. Concentration also reflects genuine earnings strength, which makes it a risk to size rather than a verdict to act on.
Your next step is practical. Check how much of your portfolio overlaps with the top 30 across every fund you hold, since a second cap-weighted US fund may own the same names. Then decide deliberately whether that exposure fits your time horizon and tolerance for risk.
This article is for informational purposes only and should not be considered financial advice. Investors should conduct their own research and consult with financial professionals before making investment decisions.