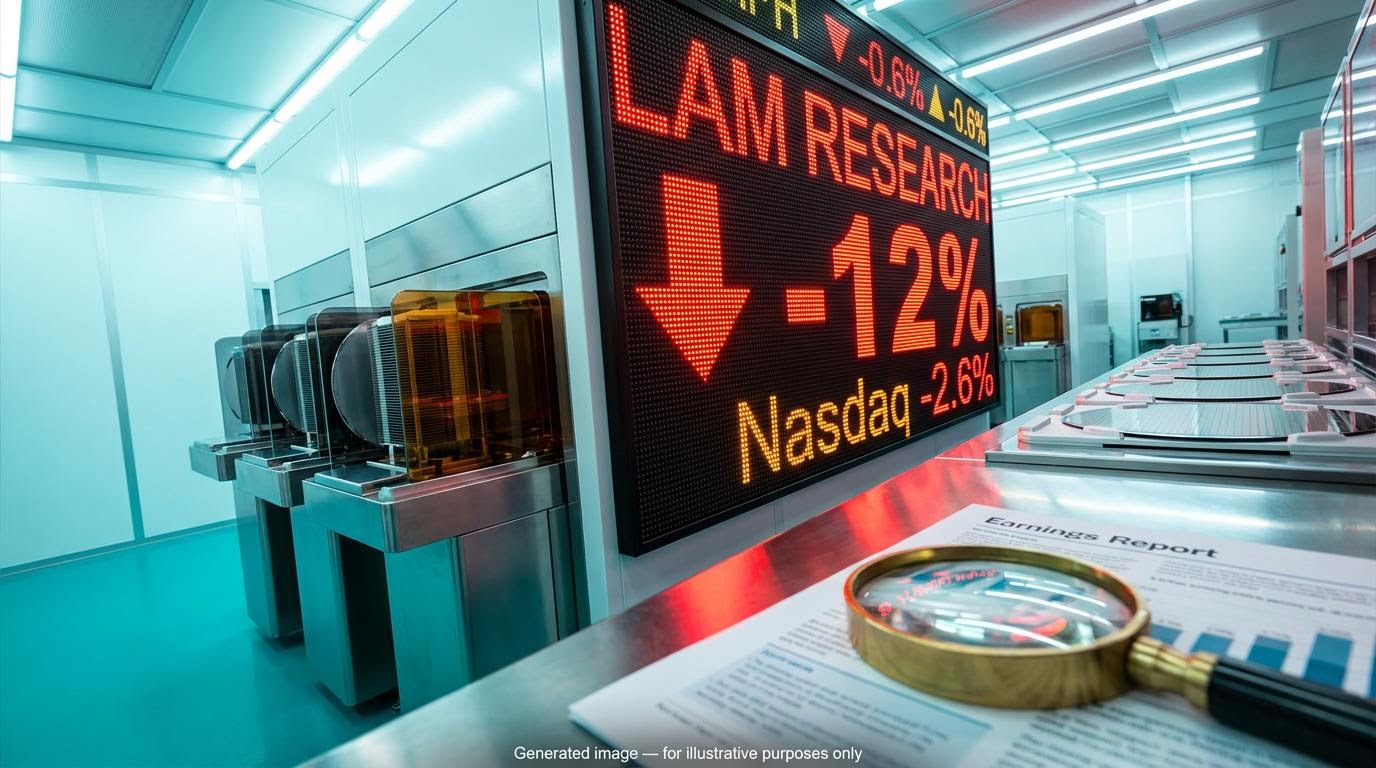
Most investors see a 2.6% Nasdaq drop and a 12% plunge in Lam Research and assume something broke in AI demand. LYNX Equity Strategies read Thursday’s tech stock sell-off differently, calling the selling “unmoored from fundamentals.”
The damage on 22 October 2026 landed hardest on semiconductors. By Friday’s close, markets had wobbled and steadied, with the Nasdaq down just 0.21%. The US midterm elections are now less than two weeks away.
The cause matters more than the headline. If you misread a valuation scare as a demand collapse, you may sell at the bottom. If you misread a real earnings reset as election noise, you may hold through a risk that keeps compounding.
Here is a way to sort valuation, macro and political drivers the next time volatility spikes, using Thursday as the worked example.
Why did the October 22 tech stock sell-off hit chips so hard?
The scoreboard was ugly. The Nasdaq Composite fell 2.6% to about 26,009, the S&P 500 dropped about 1.2%, and CPU stocks lost roughly 8%.
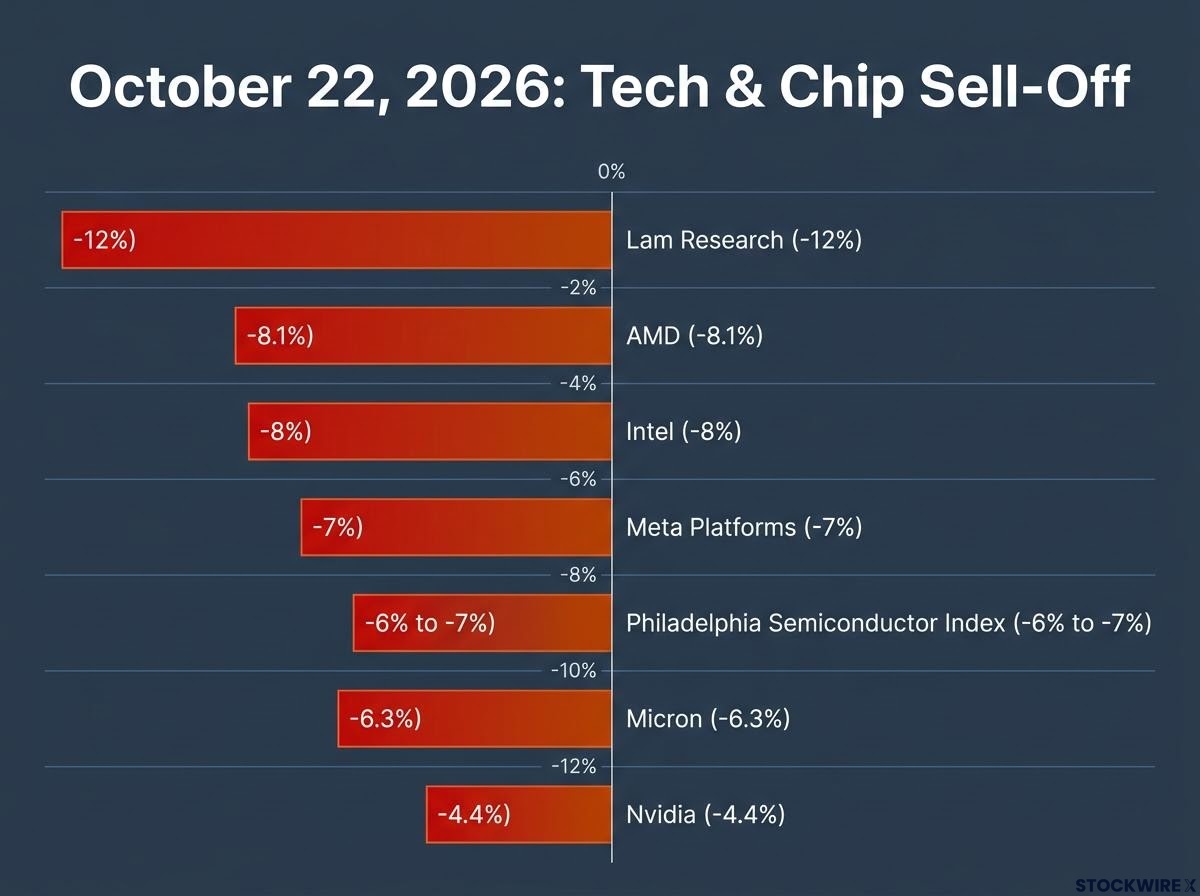
Lam Research led the rout, falling 12% after its 21 October report. The selling then spread to chipmakers and to the hyperscalers (the giant cloud companies, such as Meta, that buy AI infrastructure) funding the build-out.
| Company/Index | Reported Move (Oct 22) | Note |
|---|---|---|
| Lam Research | -12% | Record quarter, supply-constrained guide |
| Meta Platforms | About -7% | Erased post-earnings gains |
| AMD | About -8.1% | As reported |
| Intel | About -8% | As reported |
| Nvidia | About -4.4% | As reported |
| Micron | About -6.3% | As reported |
| Philadelphia Semiconductor Index | About -6% to -7% | Smaller fall than Lam |
Here is the detail that complicates the panic. Lam reported revenue of $8.22B and non-GAAP earnings per share of $2.20, then guided December-quarter revenue to $8.6B ± $400M. CFO Doug Bettinger said that outlook would have been somewhat higher without supply-chain constraints.
Demand was not the problem. Supply was.
A strong quarter that still triggers a double-digit drop is a classic feature of growth stock valuations, where prices embed years of expected earnings and leave little room for anything short of a clear beat.
“The selling yesterday was unmoored from fundamentals.” LYNX Equity Strategies, 23 October note
LYNX, led by KC Rajkumar, does not dispute that stocks should have fallen. It disputes the severity. A strong quarter that still triggers a double-digit drop tells you the stock was priced for more than “good,” so it is worth checking what expectations are baked into any crowded AI holding you own.
What the Friday close showed
On 23 October, the Nasdaq slipped 0.21% to 25,955.34 and the S&P 500 fell 0.52% to 7,623.68. Lam closed at $230.10, down just 0.02%.
That steadiness fits a disorderly repricing rather than a capitulation. It does not prove the episode is over.
When big ASX news breaks, our subscribers know first
Why can Treasury yields fall while tech stocks fall too?
Lower yields usually help growth stocks, because future profits look more valuable when borrowing costs drop. On Thursday, yields fell sharply and tech fell anyway.
A Treasury yield is the annual return investors earn for lending to the US government. When investors pile into Treasuries, prices rise and yields fall. The reason they are buying is what matters: a yield drop driven by a search for safety is very different from one driven by easier financial conditions.
The 10-year yield fell roughly 16-20 basis points to about 4.95%-4.97%. LYNX put the drop at “almost 20 bp”, Schwab at about 18 bp and Investopedia at about 16 bp, with differences reflecting timestamps and data feeds. Yields rebounded about 3.5 bp to roughly 4.99% on Friday.
The risk-off sequence typically runs like this:
- Investors sell profitable, liquid AI positions to lock in gains.
- Proceeds flow into Treasuries, pushing yields down.
- Falling yields signal a hunt for safety, not a better growth outlook.
- Leveraged, momentum and crowded positions are cut at once.
- Price swings force systematic strategies, options hedges and risk-parity funds to reduce equity exposure.
Bank of America’s Michael Hartnett described the pattern as “down-in-yields, down-in-stocks, down-in-US-dollar” and advised staying tactically risk-off until mid-November. When bonds rally alongside a stock drop, read it as investors seeking shelter. Falling yields in that setting offer no cushion for your equity valuations.
Structural versus cyclical
| Structural vulnerabilities | Cyclical catalysts |
|---|---|
| Elevated AI valuations | Profit-taking in winners |
| Index gains concentrated in a few megacaps | Election uncertainty |
| Dependence on hyperscaler capex | Temporary supply bottlenecks at Lam |
These categories work together. Structural fragility made the market sensitive, and a cyclical risk-off trigger supplied the push.
How much blame does midterm election risk deserve?
LYNX makes a political case. It argues that rising uncertainty before the midterms was a plausible trigger, that election worries may outweigh upcoming earnings, and that a rebound should follow the vote.
The firm cited former Treasury Secretary Robert Rubin’s warning that markets underprice a significant risk. Available reporting does not show Rubin predicting a specific election outcome or market decline; LYNX used his point as evidence investors may be underestimating political risk.
History partly supports LYNX. State Street, citing Baird Strategas, found average midterm-year drawdowns of about 19% versus 12% in other years. Investor’s Business Daily puts the average pre-election intrayear drawdown at 18%, while fourth-quarter midterm-year returns were positive in 16 of 19 years, averaging 6.6%.
BlackRock on post-midterm returns An average 14.1% six-month return after midterms, versus 5.7% in non-midterm years. US stocks were up 13.1% through August 2026.
The camps divide on weight and timing:
- LYNX: election uncertainty helped trigger a move fundamentals cannot explain; recovery expected after the vote.
- Historical strategists: midterms explain volatility and temporary drawdowns, not sustained bear markets.
- BofA: risk-off may persist through mid-November, a near-term positioning risk rather than a long-term verdict.
The case that fundamentals did matter
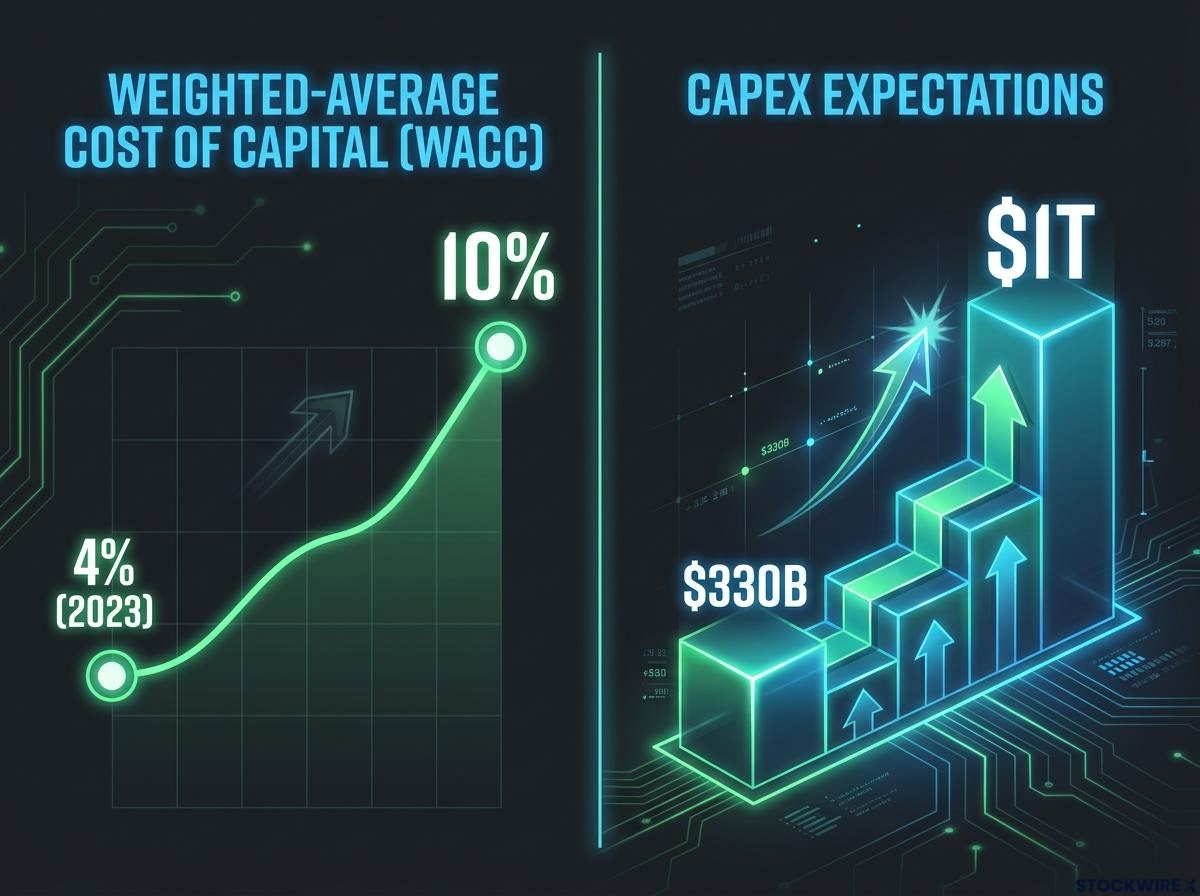
The counter-argument needs only disappointment, not collapse. BofA’s Savita Subramanian estimates hyperscalers’ weighted-average cost of capital (the blended cost of their debt and equity funding) at about 10%, up from about 4% in 2023. BofA’s Sebastian Raedler warned AI may follow past capital cycles, where the technology works but investors lose out, as hyperscaler capex expectations climbed from about $330B to $1T. Meta’s spending and dilution concerns add weight.
Barclays argues hyperscaler capex expectations still sit well below where spending is heading, and with capex consuming most operating cash flow, the funding question behind that gap is what BofA’s cost of capital warning points to.
| Source | Claim | Implication |
|---|---|---|
| LYNX | Selling detached from fundamentals | Rebound after midterms |
| BlackRock | Markets rally as uncertainty fades | Volatility, not trend change |
| BofA (Subramanian, Raedler) | Funding costs and capex returns under pressure | Real fundamental headwind |
The DeepSeek shock on 27 January 2025, when Nvidia fell nearly 17%, showed how quickly capex assumptions can reprice even when demand later holds. These statistics are secondary-sourced, and the LYNX note itself was not directly accessible. For you, the evidence points to choppy near-term trading, not an assumed lasting bear market.
A framework for sorting valuation, macro and political drivers
Thursday becomes useful once you turn it into a repeatable test. Ask three questions when the next spike hits:
- Valuation and positioning: Did good news fail to clear an inflated bar?
- Macro and rates: Are yields falling from fear, or rising enough to strain funding?
- Political risk: Is a dated event adding uncertainty that should fade?
| Driver | Question to Ask | Oct 22 Evidence | What Would Change the View |
|---|---|---|---|
| Valuation | Were expectations the problem? | Lam’s $8.6B guide missed lofty hopes | Follow-through selling on fresh beats |
| Macro | Safety bid or funding strain? | Treasury rally; about 10% hyperscaler cost of capital | 10-year yield pushing through 5% |
| Political | Is the risk time-limited? | Midterm timing; Hartnett’s mid-November caution | Weakness persisting after the vote |
Thursday scores positive on all three, which is why the move was so violent. The next hyperscaler capex commentary is the cleanest tiebreaker between a positioning shock and a deeper reset.
Whichever driver dominates changes how long the pain may last. Political shocks tend to be short-lived, while a funding-cost problem can linger for quarters, so match your time horizon to the diagnosis rather than the headline. One session cannot separate temporary de-risking from lasting deterioration, and Friday’s stabilisation is supportive but not conclusive.
What the sell-off changes, and what it does not
Thursday looks most like a valuation and positioning shock with a genuine fundamental component, amplified by a safety bid and election nerves. LYNX’s view of a post-midterm recovery is one credible reading, balanced by BofA’s caution through mid-November.
What it does not change is the evidence that AI demand itself held up. Lam’s problem was supply, not orders.
The signals worth monitoring are price action after the election, the next round of hyperscaler capex updates and whether the 10-year yield settles near 5%. These are watch items, not predictions.
Investors wanting a historical playbook can use our full explainer on midterm election investment strategy, which breaks down the August-to-March return window since 1950.
This article is for informational purposes only and should not be considered financial advice. Investors should conduct their own research and consult with financial professionals before making investment decisions. Past performance does not guarantee future results, and forward-looking views cited here are speculative and subject to change.