KOSPI Drops 10% as Crowded AI Trade Unwinds Across Global Markets
8 hrs ago

Current conditions within the leveraged loan market present a remarkably stable headline index that masks a rapidly widening chasm in the domestic corporate credit sector. As of late April 2026, first-quarter data reveals a contracted origination environment and severe valuation reductions hitting lower-rated debt. The Morningstar LSTA US index continues to hover near 4,330 points, projecting outward calm while underlying market mechanics fracture.
Underlying default rates are climbing rapidly, and institutional capital is reacting defensively to approaching maturity walls. This analysis deconstructs the current K-shaped recovery in corporate debt. It reveals how isolated sector distress is bleeding into business development company valuations and forcing a massive reallocation of capital toward private credit.
A stark contrast has emerged between surface-level index stability and underlying structural deterioration. The Morningstar LSTA US Leveraged Loan Index reached 4,330.92 USD on April 28, 2026, delivering a positive one-month return of 1.26 percent. Daily and weekly positive returns suggest an asset class functioning normally, yet these top-line figures camouflage a severe liquidity tightening beneath the surface.
First-quarter institutional loan origination volumes dropped sharply to $111 billion. According to reports, this slump coincides with total domestic loan investment vehicle capital withdrawals reaching $5.1 billion over the same period. The market has entered a state of suspended animation before approaching debt maturity walls force structural changes upon highly leveraged borrowers.
This liquidity crisis extends beyond corporate syndications; similar approaching commercial debt maturity walls are simultaneously threatening the multifamily real estate sector with severe refinancing pressures.
Investors relying on average index pricing currently hold a false sense of security. The headline numbers aggregate the insulated upper tranches with the suffocating lower tiers, blending the data into a misleading average. Examining the specific volume and withdrawal metrics reveals the true liquidity constraints developing within institutional debt.
| Metric Category | Q1 2026 Figure | Underlying Market Signal |
|---|---|---|
| Morningstar Index Level | 4,330.92 USD | Superficial stability masking underlying tier divergence |
| Institutional Origination | $111 billion | Severe contraction in new corporate financing availability |
| Capital Withdrawals | Reportedly $5.1 billion | Defensive institutional positioning ahead of maturity walls |
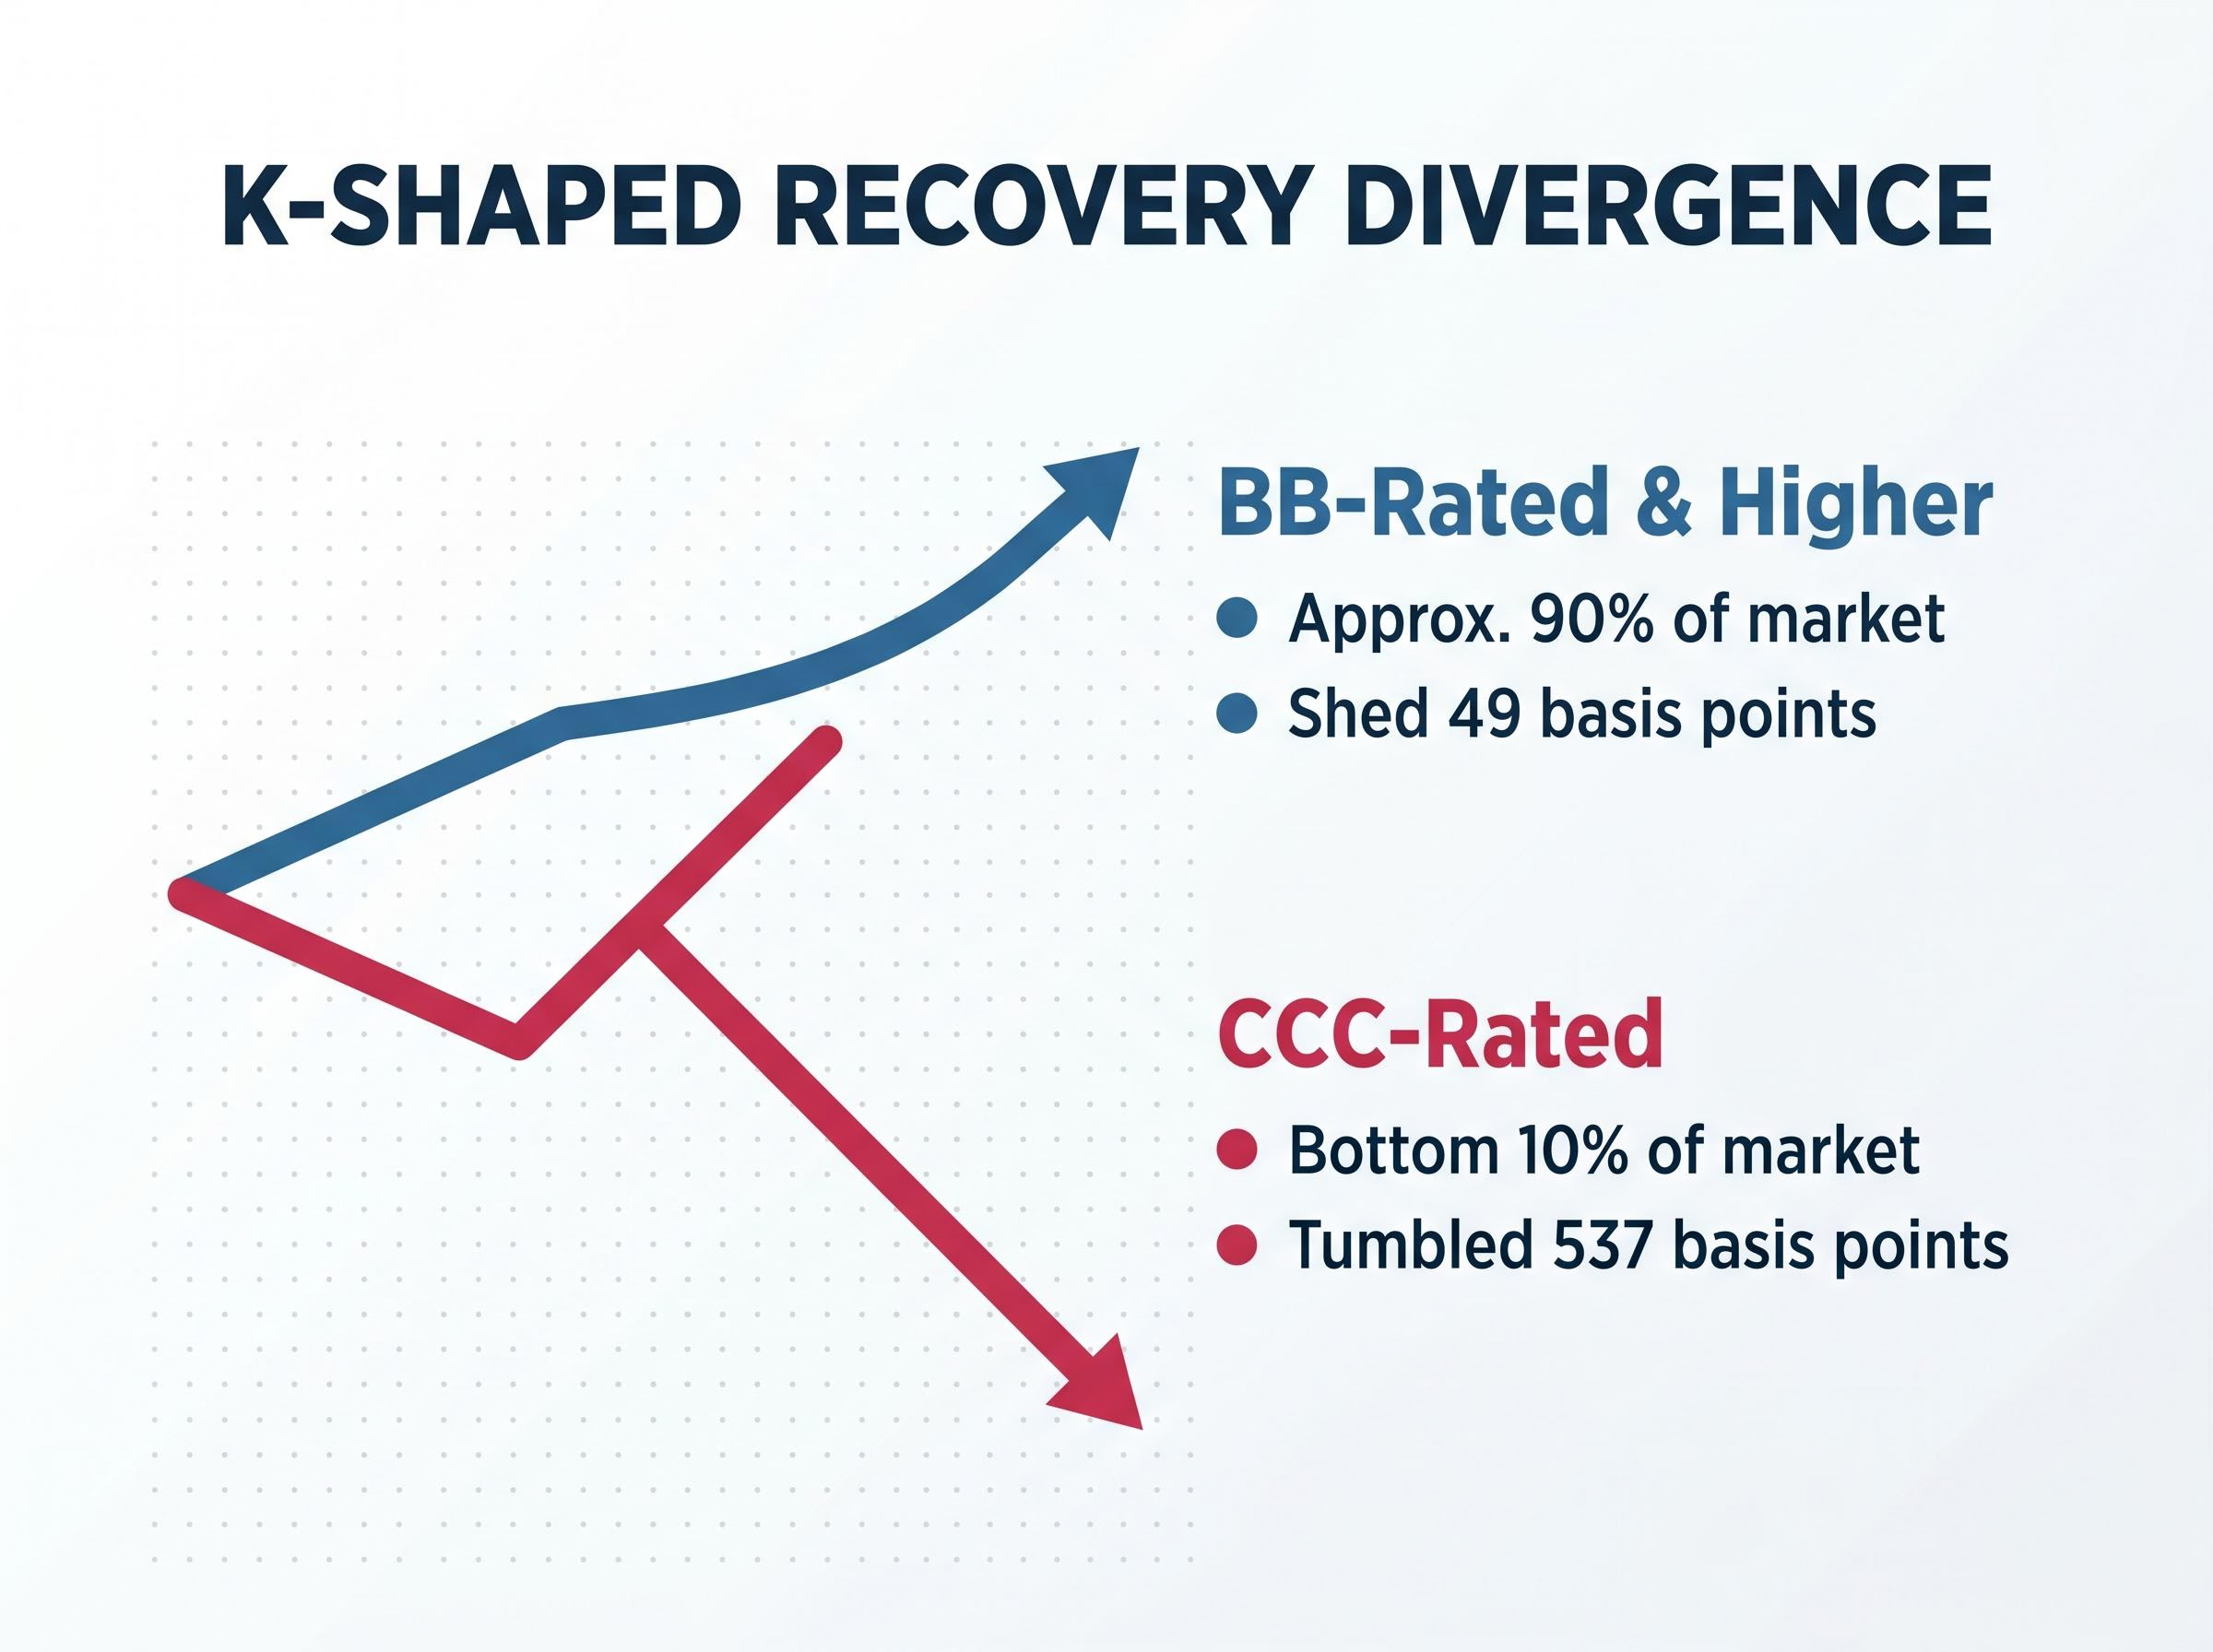
Credit analysts describe the current environment as a K-shaped recovery operating within a single asset class. Approximately 90 percent of the market consists of BB-rated and higher debt, which remains entirely stable and continues to absorb capital. The bottom 10 percent includes CCC-rated debt, which is facing immediate liquidity crunches and escalating default probabilities.
The mechanics of this divide centre on sensitivity to macroeconomic pressures. According to reports, valuation reductions highlight this split clearly, with BB-rated debt shedding just 49 basis points during the quarter. Conversely, according to reports, CCC-rated debt tumbled 537 basis points, reflecting the complete loss of buyer confidence in the lowest tranches.
Official Morningstar leveraged loan performance data confirms this severe tier divergence, showing that the lowest-rated corporate debt continues to post negative returns while upper tiers maintain stable yields.
According to reports, this hypersensitivity has pushed the proportion of debt trading below 80 percent of face value to 7.23 percent. Portfolio composition dictates survival in this environment, as the risk thresholds separating stable yield from impending default have never been starker. The cascading impact of liquidity tightening moves predictably through the credit hierarchy.
Abstract default metrics become tangible when mapped to the specific industry pressures amplifying them. The trailing 12-month default rate for US leveraged loans reached 4.9 percent in March 2026. This follows a full-year 2025 total US default volume of $73.8 billion, establishing a clear trajectory of escalating corporate failure.
The recent Fitch Ratings leveraged finance default analysis highlights that monthly default volumes remain elevated across both institutional and retail markets, driven heavily by a handful of large, highly distressed corporate issuers.
Macroeconomic headwinds are amplifying existing cash flow problems for vulnerable borrowers. Prolonged oil price shocks have severely constrained operating margins across multiple supply chains, while high interest rates have exhausted the cash reserves of debt-heavy companies. According to reports, when comprehensive default measurements include liability management exercises, the specific distress rate stands at 3.48 percent.
The concentration of this distress provides a clear map of sector vulnerability. Evaluating exposure to these specific industries is necessary to anticipate restructuring events in the coming quarters.
Software companies face heavily leveraged balance sheets that depend on aggressive recurring revenue growth, which has slowed materially. Media entities suffer from declining advertising yields and high debt burdens assumed during earlier consolidation phases. * Energy sector participants remain highly exposed to unhedged input costs and volatile commodity pricing shocks.
The distress among corporate borrowers is now bleeding directly into the investment vehicles that hold their debt. This underlying corporate weakness translates into direct net asset value destruction for retail and institutional funds. Business development companies face an acute income squeeze as their lower-rated loan assets stop generating cash distributions.
A prominent indicator of this distress is FS KKR Capital Corp, which recently reduced its dividend from $0.70 to $0.48 per share. This reduction signals that historical dividend reliability cannot survive rapid deterioration in underlying asset quality. The discrepancy between management confidence and market reality is increasingly visible in plummeting share prices across the sector.
Analyst Perspective on the Income Squeeze “The reduction in distributions across the business development space signals a fundamental recalibration. Managers can no longer fund payouts from deteriorating CCC-rated assets, forcing a painful alignment between stated net asset values and actual cash generation.”
Income-focused investors are discovering that sustained payouts cannot mask a shrinking asset base indefinitely.
The first-quarter 2026 performance of Oxford Square Capital Corp illustrates the immediate consequences of this NAV erosion. According to reports, the company reported an earnings shortfall at $0.05 per share, missing the projected $0.07 target. This miss snapped a long-standing streak of consecutive payments and triggered an immediate negative market reaction.
The underlying damage extended far beyond the quarterly earnings miss. According to reports, the company’s net asset value per share dropped 21.9 percent to $1.32, accompanied by $29.7 million in combined investment losses. This sharp contraction highlights the tension between maintaining historical dividend policies and managing a rapidly depreciating portfolio of leveraged loans.

Approaching debt maturity walls are forcing a structural shift in how companies seek financing. Institutional money is fleeing traditional syndicated loan structures for alternative lifeboats that offer better downside protection. This capital flight accelerates the reallocation of funds toward private credit solutions, where lenders can negotiate stricter covenants and direct control.
Market projections for the remainder of 2026 show conflicting expectations regarding a potential rebound in mergers, acquisitions, and leveraged buyouts. While some optimistic models project recovery, the immediate first-quarter stress reports prioritise a downturn-oriented perspective. These statements are speculative and subject to change based on broader macroeconomic developments and central bank policy shifts.
Distressed debt managers are actively diversifying their holdings to offset impending credit losses. According to reports, Oxford Square directed $15.8 million in new asset acquisitions toward artificial intelligence entities, specifically targeting Constellation Inc. and Invisible Technologies Inc. Understanding where institutional capital is moving allows market participants to recognise private credit and technology diversification as primary defensive plays.
This capital migration underscores the broader AI disruption in tech, as distressed debt managers increasingly rotate away from legacy software dependencies in favour of native synthetic infrastructure.
The first quarter of 2026 marked a definitive transition period for the leveraged loan space. Theoretical risks translated into actual realised losses for funds heavily exposed to the bottom 10 percent of corporate credit. The fundamental conflict between stable upper tranches and deteriorating lower tranches will likely dictate market behaviour throughout the remainder of the year.
Investors should monitor second-quarter origination data to confirm whether capital flight from public syndication to private credit is accelerating. Reliance on broad index stability remains a dangerous strategy while underlying vulnerability concentrates in specific sectors and low-rated debt tiers.
For investors evaluating the systemic risks of benchmark concentration, our detailed coverage of passive index distortion explores how market cap weighting can similarly camouflage structural vulnerabilities beneath a stable headline figure.
This article is for informational purposes only and should not be considered financial advice. Investors should conduct their own research and consult with financial professionals before making investment decisions. Past performance does not guarantee future results, and financial projections are subject to volatile market conditions and various risk factors.
A K-shaped recovery in the leveraged loan market describes a situation where high-rated debt remains stable, or even improves, while lower-rated debt experiences significant deterioration and distress. This creates a divergence in performance within the same asset class.
In Q1 2026, the Morningstar LSTA US Leveraged Loan Index showed superficial stability, but underlying conditions included a sharp drop in institutional loan origination to $111 billion and $5.1 billion in capital withdrawals, indicating severe liquidity tightening.
Software companies, media entities, and energy sector participants are identified as particularly vulnerable due to factors such as heavily leveraged balance sheets, declining advertising yields, high debt burdens, and exposure to volatile commodity pricing.
BDCs are directly impacted by the distress among corporate borrowers, leading to net asset value destruction and income squeezes as lower-rated loan assets stop generating cash distributions, as seen with dividend reductions by companies like FS KKR Capital Corp.
Institutional capital is increasingly shifting away from traditional syndicated loans toward private credit solutions, which offer stricter covenants and more direct control, and also diversifying into artificial intelligence entities.