A single-digit price-to-earnings ratio paired with a 7% dividend yield looks like a gift. Across the automotive sector in late 2026, that combination is everywhere, and it is drawing income-hungry investors toward names they have trusted for decades.
The problem is that cheap has stopped meaning safe. The shift toward electrified and autonomous transport has fractured the business models that made these companies reliable dividend payers, and the numbers on a stock screen no longer describe the businesses underneath them.
What follows gives you a clear framework for separating cyclical dips, the ordinary lows of an economic cycle, from structural decay, the permanent erosion of a company’s ability to compete, across nine of the world’s largest automotive stocks. The distinction determines whether you are buying a bargain or catching a falling knife.
Anatomy of an automotive value trap
A value trap is a stock that looks cheap on backward-looking metrics but keeps getting cheaper because the underlying business is shrinking. For capital-intensive manufacturers facing technological disruption, it is the most dangerous setup in equity investing, because the very metrics that scream “buy” are the ones lagging furthest behind reality.
Bank of America’s six-question checklist for value trap diagnostics applies directly here: the price-versus-estimate gap, where a stock falls 30% while EPS estimates are cut only 8%, is precisely the pattern visible across several legacy auto names as analyst communities lag the market’s structural verdict.
Look at the trailing financials for most legacy automakers and you see healthy net income, positive free cash flow, and investment-grade credit ratings. Those figures are real. They are also a photograph of a world that is disappearing.
The forward picture is where the trap sits. According to the International Energy Agency, incumbent internal combustion engine carmakers still account for roughly 98% of traditional ICE sales but only about 55% of global electric vehicle sales. They dominate the market that is contracting and trail badly in the one that is growing.
The longer-term threat runs deeper than the EV transition itself. Widespread adoption of autonomous vehicles and robotaxis, autonomous fleets offering rides without a driver, is projected to reduce overall car ownership demand. Fewer privately owned cars means declining long-term returns on the factories, tooling, and vehicle assets that legacy balance sheets are built on.
Robotaxi adoption economics affect legacy automakers indirectly but materially: widespread autonomous fleets reduce private vehicle ownership demand, which compresses the long-run addressable market for manufacturers whose factory assets and tooling are sized to a private-ownership world that robotaxi rollout is beginning to shrink.
That high dividend yield you spotted on your screening tool is likely a mirage. It reflects a share price falling faster than the payout, masking a structurally declining asset. Before chasing it, you need to weigh the enormous capital expenditure these companies must spend just to stay in the game.
Three indicators separate a genuine cyclical bargain from a value trap in this sector:
- Eroding market share, particularly losses to Chinese entrants in EV segments rather than temporary demand softness.
- High transition capex, the sustained investment needed to build battery and software capability from behind.
- Shrinking forward guidance, where management quietly lowers margin and delivery targets year after year.
When all three appear together, a low multiple is not opportunity. It is the market pricing in decline before the income statement catches up.
When big ASX news breaks, our subscribers know first
The structural collapse of legacy economic moats
For most of the twentieth century, scale was the moat. Building cars profitably required vast plants, deep supplier networks, and brand loyalty that took generations to earn. That moat is now draining, and the mechanism draining it is structural rather than cyclical.
Chinese automakers captured a record 35.6% of the global automotive market in 2025, with monthly peaks reaching 38% in October. This is not a subsidy story that a policy change reverses. It is a cost story.
According to industry data, Chinese producers enjoy roughly 35% lower production costs than advanced-economy rivals, built on vertical integration and manufacturing scale. In 2024, Chinese battery pack prices fell about 30%, against only 10-15% in Europe and the United States. The gap is widening, not closing.
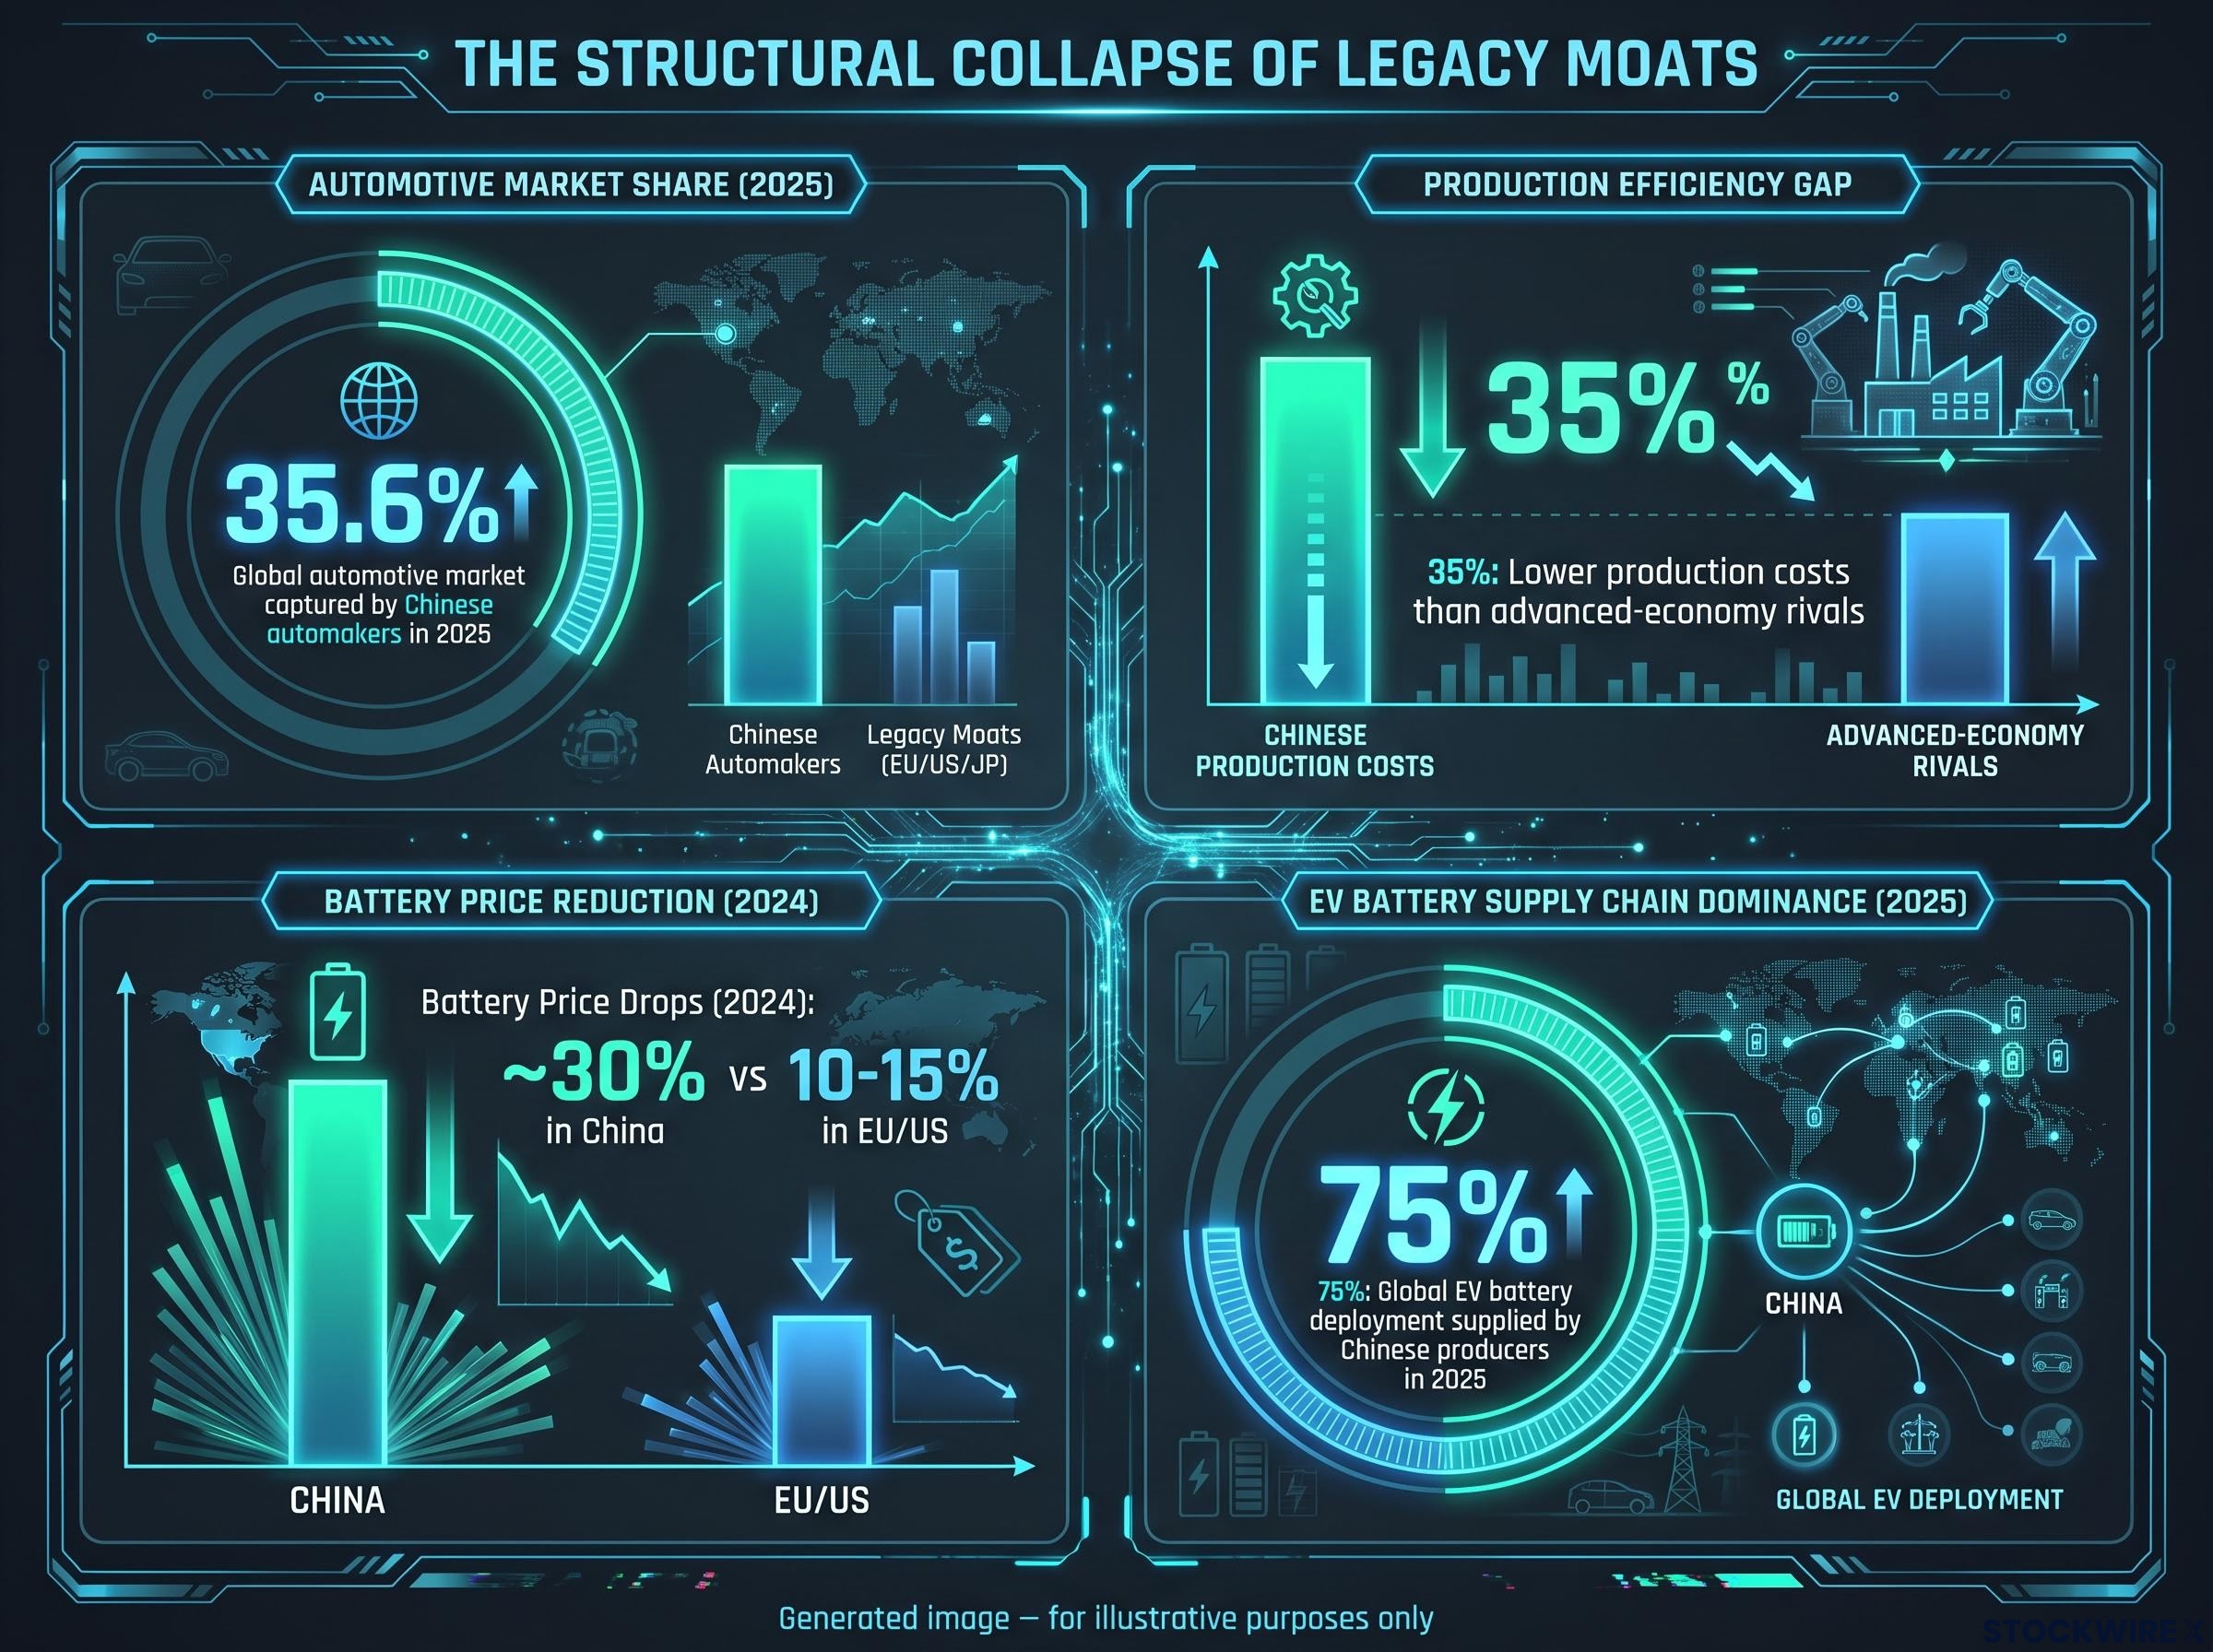
Battery supply compounds the problem. Chinese producers supplied nearly 75% of global EV battery deployment in 2025, meaning even Western automakers building EVs often depend on Chinese cells to do it. Control of the most expensive component in an electric car sits largely outside the West.
Tariffs buy time, not a cure. EU levies did reduce the share of Chinese-made battery-electric vehicles in EU sales from a peak of 22% in 2024 to about 17% by early 2026, but they cut both ways. Stellantis explicitly blamed part of its €2.3 billion first-half 2025 net loss on the early effects of new US tariffs on Chinese vehicles and components, which raised its own input costs.
Chinese EV market barriers in the US, a 100% tariff, a connected vehicle software ban, and federal tax credit exclusion, buy time for domestic producers but do not eliminate the underlying cost gap, and JP Morgan estimates current tariffs add roughly $3,258 per new vehicle, raising costs for American buyers rather than closing Chinese manufacturers’ structural advantage.
To respond, Western original equipment manufacturers must localise battery and EV production, duplicating supply chains that Chinese competitors have already mastered. That demands continuous, heavy capital expenditure just to reach parity, not advantage.
Morgan Stanley research warns that Western and Japanese automakers face prolonged difficulties unless they radically reinvent themselves around software, artificial intelligence, and smart driving, noting that new energy vehicles already account for more than half of domestic auto sales in China.
Recognising these headwinds tells you something specific about your investment thesis. Any case that rests on a return to historic operating margins is betting against structural cost forces that show no sign of reversing. Hoping for the old margins to come back is not a strategy.
Assessing the United States and Asian legacy players
Theory meets the balance sheet here. The US and Asian names are household brands with genuine cash generation, which is exactly what makes them tempting and exactly what makes the trap harder to spot.
| Company | 2024 Free Cash Flow | Strategic Pivot | Primary Investment Risk |
|---|---|---|---|
| General Motors | $14.0B adjusted automotive | US-focused EV rollout under tariff cover | Severe cyclical downside in a US recession |
| Ford | $6.7B adjusted | Modest EV shift, recurring impairments | Margin compression and recession exposure |
| Toyota | ~$11.4B (FY to Mar 2024) | Hybrid-led, gradual electrification | Heavy North American reliance |
| Hyundai | Not disclosed in comparable form | Robotics and technology pivot | Valuation premium ahead of fundamentals |
General Motors and Ford
Both companies generate serious cash today. General Motors produced $14.0 billion in adjusted automotive free cash flow in 2024, while Ford generated $6.7 billion. Those numbers look like ballast for a portfolio.
They also rest heavily on US tariff protections that support higher domestic pricing, and on large internal combustion vehicles that remain the profit engine. Both are cyclical businesses selling a discretionary big-ticket product.
The history matters. In the 2008-2009 recession, US vehicle sales collapsed and GM was pushed into insolvency and a government rescue. Ford, meanwhile, continues to book impairment charges on earlier electrification commitments that recurring special charges tend to obscure.
Here is the read for your portfolio. A US recession exposes both to severe downside, which means you should treat their current free cash flows as cyclical peaks rather than a sustainable baseline. Pricing them as safe dividend payers ignores the cycle that created the cash.
Hyundai and Toyota: The Asian divergence
The Asian names split sharply in strategy. Hyundai is the most aggressive pivot in the legacy field, committing a $26 billion US investment and acquiring a controlling interest in Boston Dynamics to push into robotics, autonomous vehicles, and micro-mobility. Management targets an operating margin of 9% or higher by 2030.
That ambition is the differentiator, and also the risk. The shares carry an artificial intelligence valuation premium, having doubled from levels of roughly a year earlier before recently retreating, which leaves the stock priced ahead of current fundamentals.
Toyota offers stability of a different kind. It generated approximately $11.4 billion in free cash flow for the year to March 2024 and leans on a hybrid strategy that has aged well against a bumpy EV transition.
The complication is concentration. Toyota books most of its sales in North America and Asia, functioning strategically as a North American-oriented company, and Japanese government market support measures add further layers to the investment case. Stable is not the same as simple, and the geographic reliance is a real exposure.
The European incumbents face an existential test
Strip the prestige branding from Europe’s auto titans and the balance sheets tell a colder story. The write-downs and profit warnings of 2025 and 2026 are not noise. They are the value-trap thesis playing out in real time.
| Company | Recent Credit Action | Key Structural Vulnerability | Long Term Outlook |
|---|---|---|---|
| Stellantis | Dividend suspended; huge write-down | No credible answer to Chinese rivals | Insolvency or acquisition risk over 10-15 years |
| Volkswagen | Moody’s cut A3 to Baa1 | China exposure, complex ownership | Returns historically limited to dividends |
| Mercedes-Benz | Outlook trends turned negative | End of cheap debt, EV price erosion | Structural margin pressure |
| BMW / Porsche | Declining deliveries in key lines | Premium demand softening | Repeated strategy resets required |
Stellantis and Volkswagen
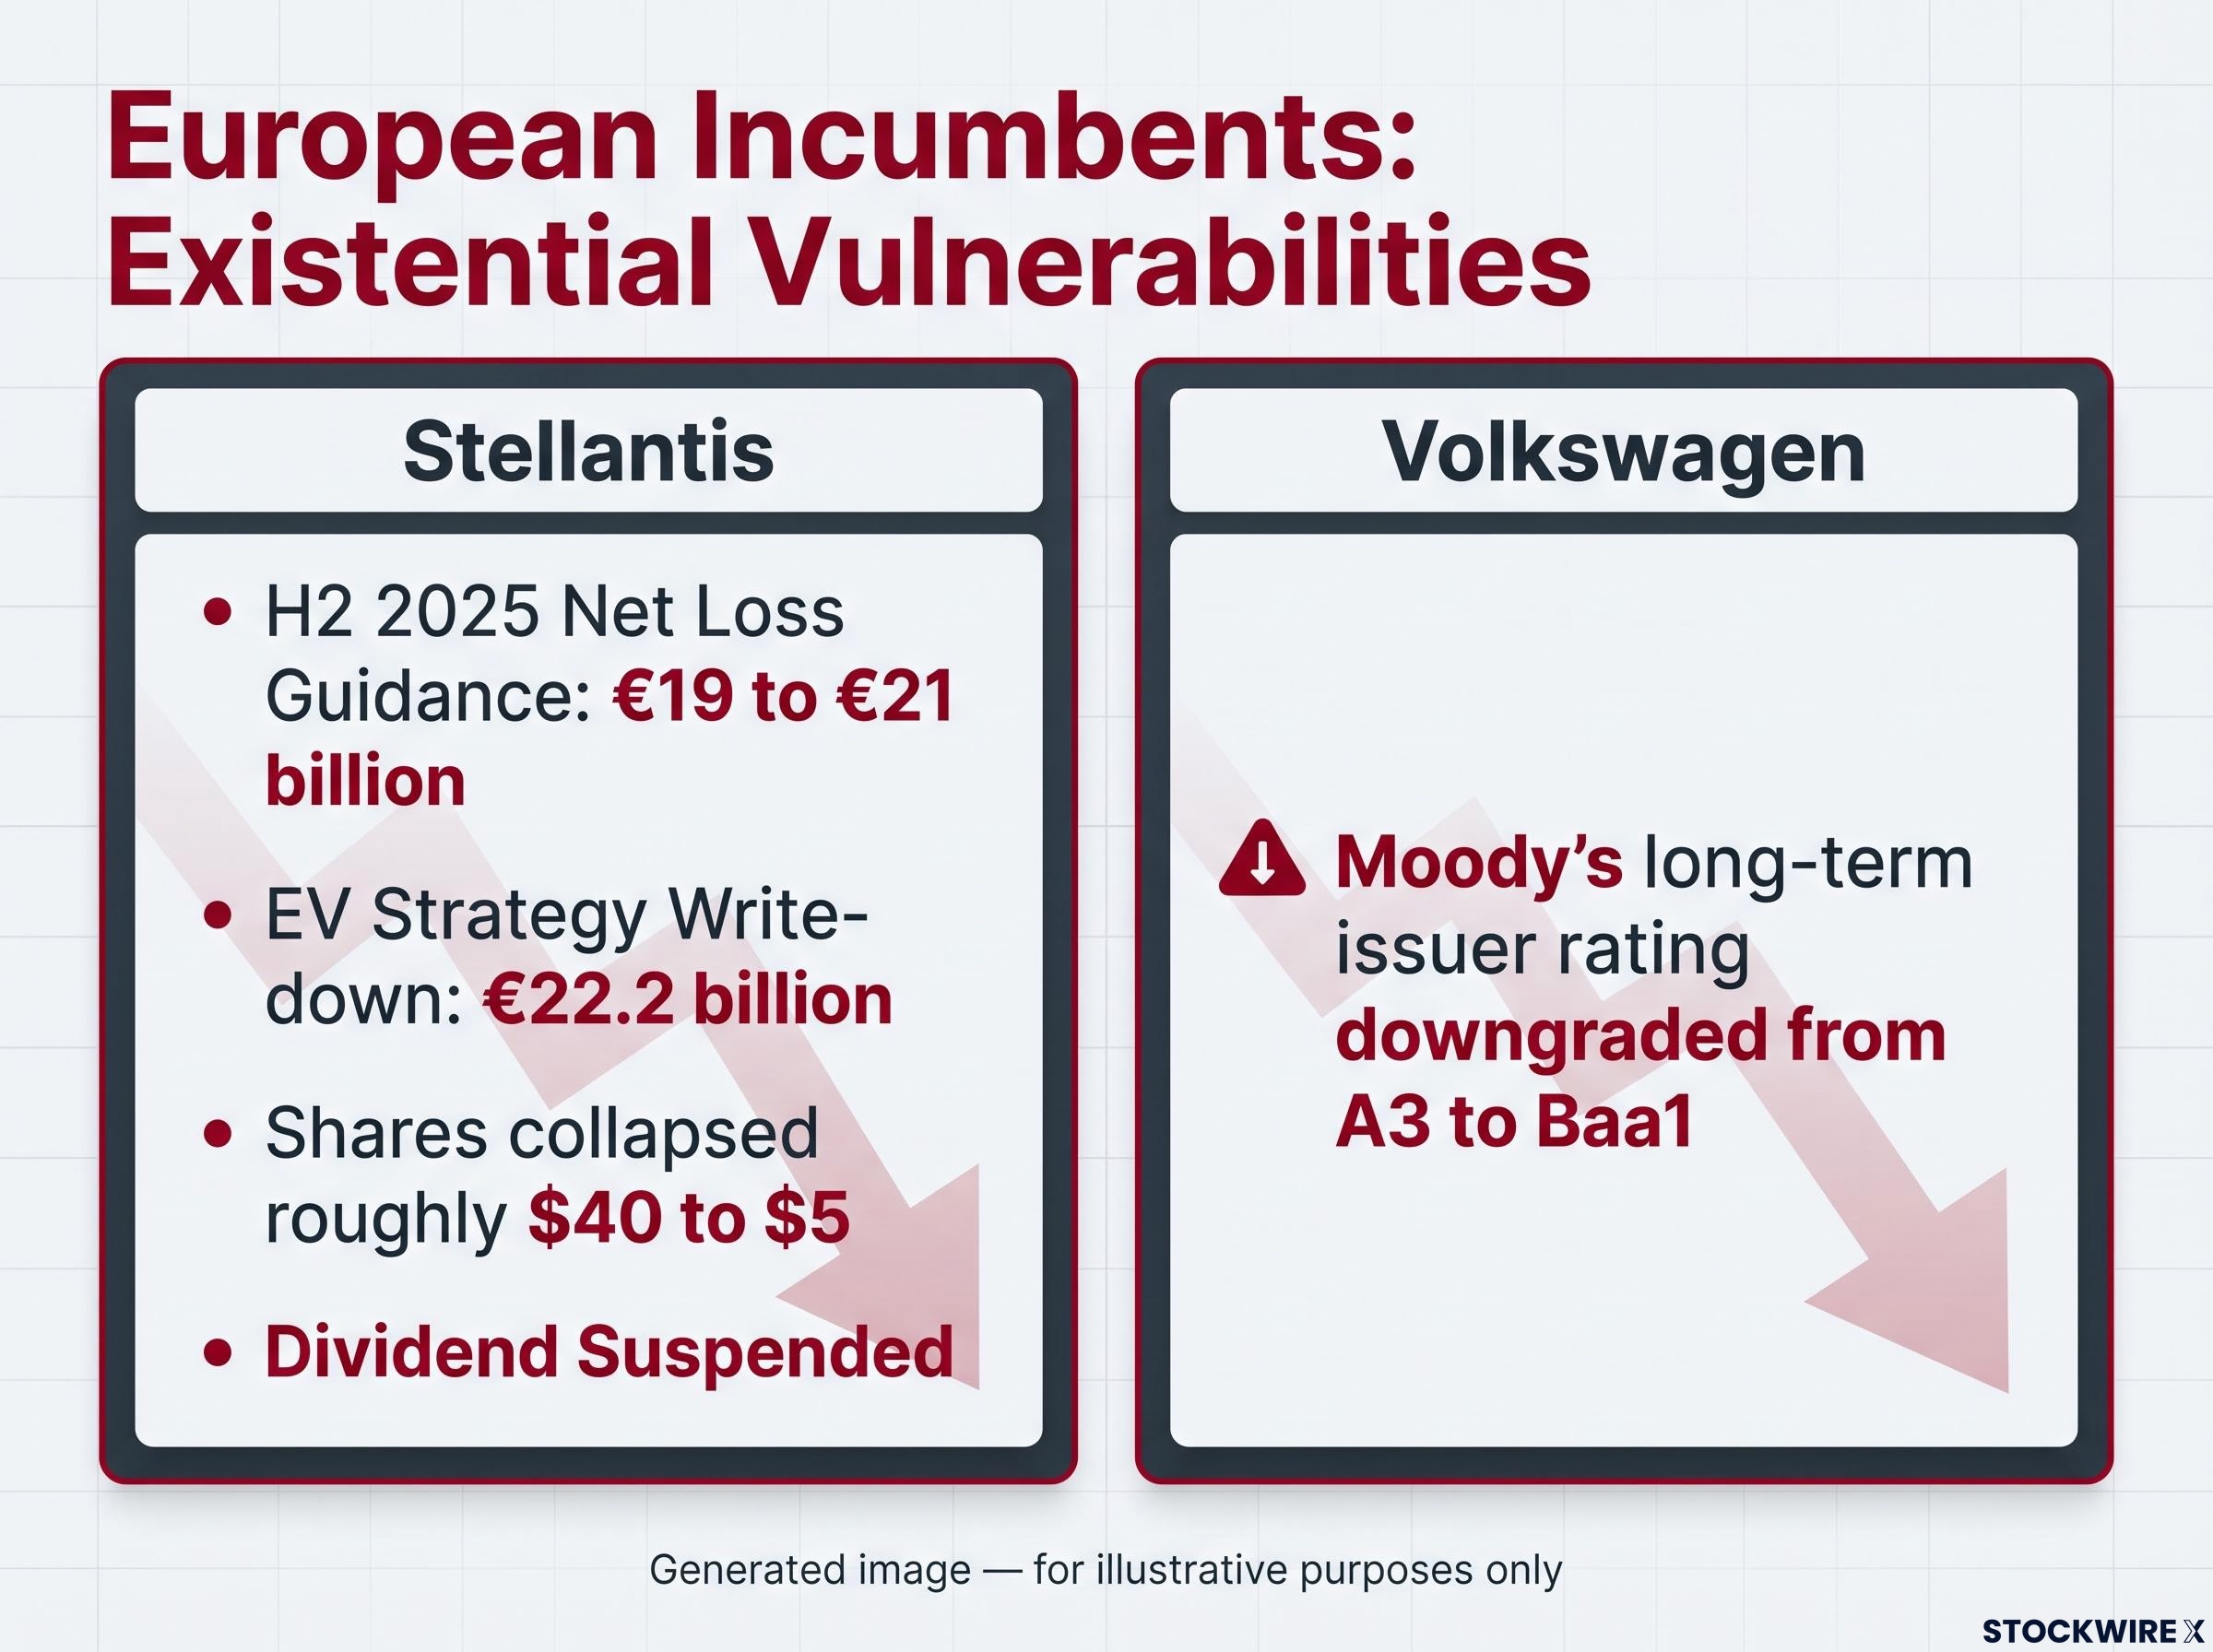
Stellantis is the clearest illustration of the thesis. In February 2026 the company issued preliminary net loss guidance of €19 to €21 billion for the second half of 2025, driven by a €22.2 billion write-down tied to a retreat from its EV strategy, and it suspended the dividend. Its shares have collapsed from roughly $40 to around $5.
That is capital destruction, not a dip. Rising inventory points to weakening demand beneath the reported figures, and analysts question whether management’s projected free cash flow rests on any credible operational basis.
Volkswagen is more solid but heading the same direction. Moody’s downgraded its long-term issuer rating from A3 to Baa1, citing structural issues, high investment needs, and intense competition in China. A complex ownership web between Porsche SE and Volkswagen AG further muddies any clean read on valuation.
The Volkswagen restructuring plan, targeting up to 100,000 jobs and closure of four German plants, illustrates the broader analytical shift required: binding codetermination agreements through 2030-2033 push realised savings later than the headline numbers imply, and Tier-1 suppliers with high VW concentration face order-book risk that will materialise before it appears in reported earnings.
The German luxury tier
Premium branding has not insulated the German tier. Mercedes-Benz historically issued bonds at coupon rates of roughly 0 to 1%, an era of near-free debt that subsidised both its capital structure and consumer financing. That era has definitively ended, and rising rates now compound structural pressure.
Pricing power is fading where it once looked untouchable. A one-year-old Mercedes EQE SUV with around 12,000 kilometres was recently priced roughly 30% below the new equivalent’s €90,000 list price, a signal that premium EVs are not holding value.
BMW faces declining financials and growing liabilities, while Porsche saw total deliveries fall about 16% in 2024, with the Cayenne, Panamera, and Macan all down and only the 911 holding up. These are not the numbers of businesses with intact moats.
The lesson for your holdings is direct. Profit warnings of this scale show how fast a seemingly stable auto portfolio can destroy capital, which argues for aggressively underweighting any company without a credible EV and software response.
This article is for informational purposes only and should not be considered financial advice. Investors should conduct their own research and consult with financial professionals before making investment decisions. Past performance does not guarantee future results, and these forward-looking assessments are speculative and subject to change based on market developments and company performance.
Allocating capital as the legacy era concludes
The stock-by-stock picture points one way. The majority of the traditional automotive sector remains a structural value trap, where low multiples and fat yields describe businesses losing the ground beneath them rather than businesses on sale.
The screening metrics that draw investors in, the single-digit P/E and the high dividend, are precisely the figures lagging furthest behind the transition to electrified and autonomous transport. Treat them as warnings, not invitations.
Where opportunity exists, it sits with companies genuinely rebuilding into technology and software platforms rather than remaining metal benders. Hyundai’s robotics pivot and Toyota’s disciplined hybrid strategy at least attempt that transition, though each carries its own valuation and concentration risk.
For the European incumbents drowning in write-downs and the US names sitting on cyclical-peak cash flows, the safer call is caution. In this sector, the burden of proof now sits with any legacy automaker claiming its moat is still intact.