Semiconductor Stocks Suffer Worst Session of 2026 in 6.3% Rout
4 hrs ago

The U.S. economy added just 57,000 jobs in June, according to Bureau of Labor Statistics data released 2 July 2026. That is roughly half the 114,000 consensus forecast, and it snaps a three-month streak of above-consensus payroll readings that had underpinned the resilient labour market thesis.
The timing sharpens the significance. Investors and the Federal Reserve had been reading the jobs data as steady enough to keep rate policy on hold. A miss of this size, arriving alongside downward revisions to prior months, challenges that read at precisely the moment when the Fed’s next move remains unsettled.
Here is what the numbers actually show, why the unemployment rate dropping to 4.2% is not the good news it appears to be, and what you should be watching as the summer data unfolds.
57,000 jobs added in June 2026, against a consensus forecast of 114,000. That is an approximate 50% undershoot.
The gap is large enough that it resists the usual dismissals. This was not a marginal miss driven by seasonal adjustment quirks. It was a halving of expected job creation in a month where no external shock, no weather event, and no strike provided an easy explanation.
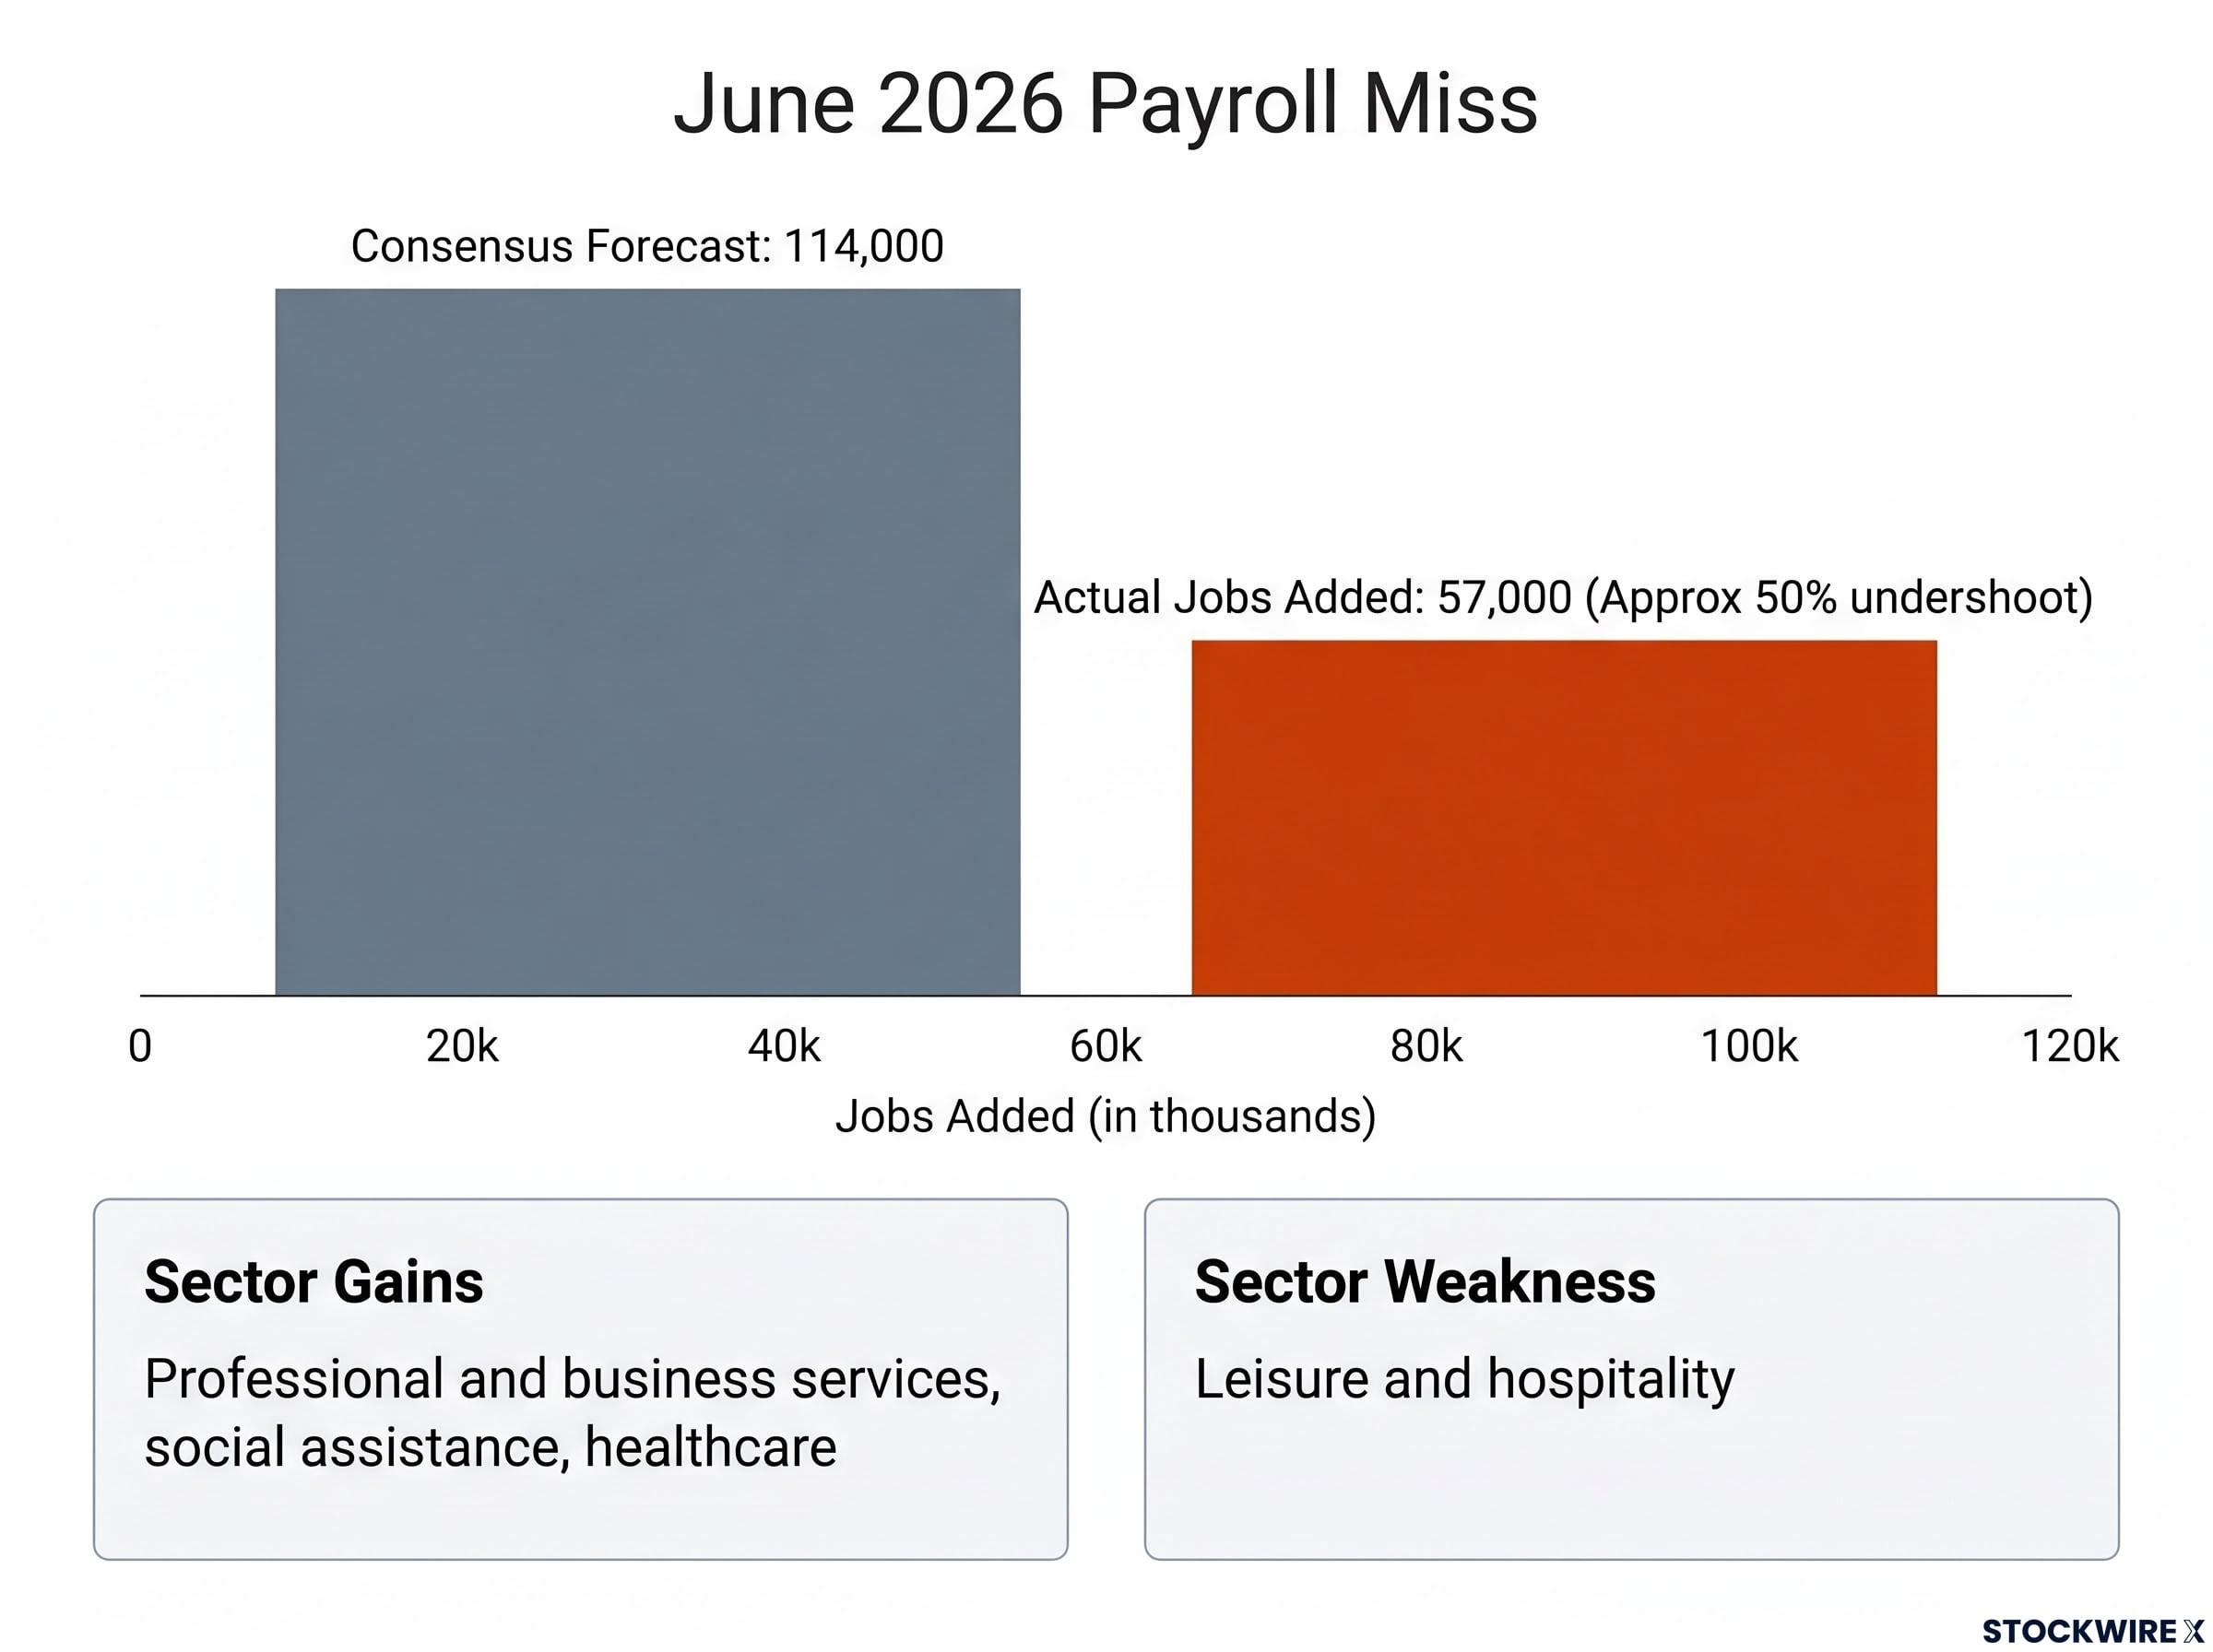
The sector detail offers partial offsets but not reassurance:
That last point matters more than it first appears. Leisure and hospitality hiring is among the most sensitive barometers of consumer confidence and discretionary spending. When restaurants, hotels, and entertainment venues slow their hiring, it tells you the parts of the economy most exposed to household spending decisions are losing momentum. For your portfolio positioning, that signal carries more weight than the headline number alone.
On its face, the unemployment rate looks like the one bright spot. At 4.2%, it beat analyst expectations of 4.3%. If you stopped there, you might conclude the labour market is holding up better than the payroll number suggests.
That conclusion falls apart when you look at the internals.
The labour force participation rate, which measures the share of the working-age population either employed or actively seeking work, retreated by 0.3 percentage points to reach 61.5%, having previously stood at 61.8%. When participation drops, the unemployment rate can improve mechanically: fewer people are counted as looking for work, so the denominator shrinks and the rate falls even if hiring has not improved.
The employment-to-population ratio strips out that distortion. It simply measures what share of the total working-age population is employed, regardless of whether the rest are looking for work or have stopped searching entirely.
That ratio slipped to 59.0% in June. The three internal metrics, read together, tell a coherent and uncomfortable story:
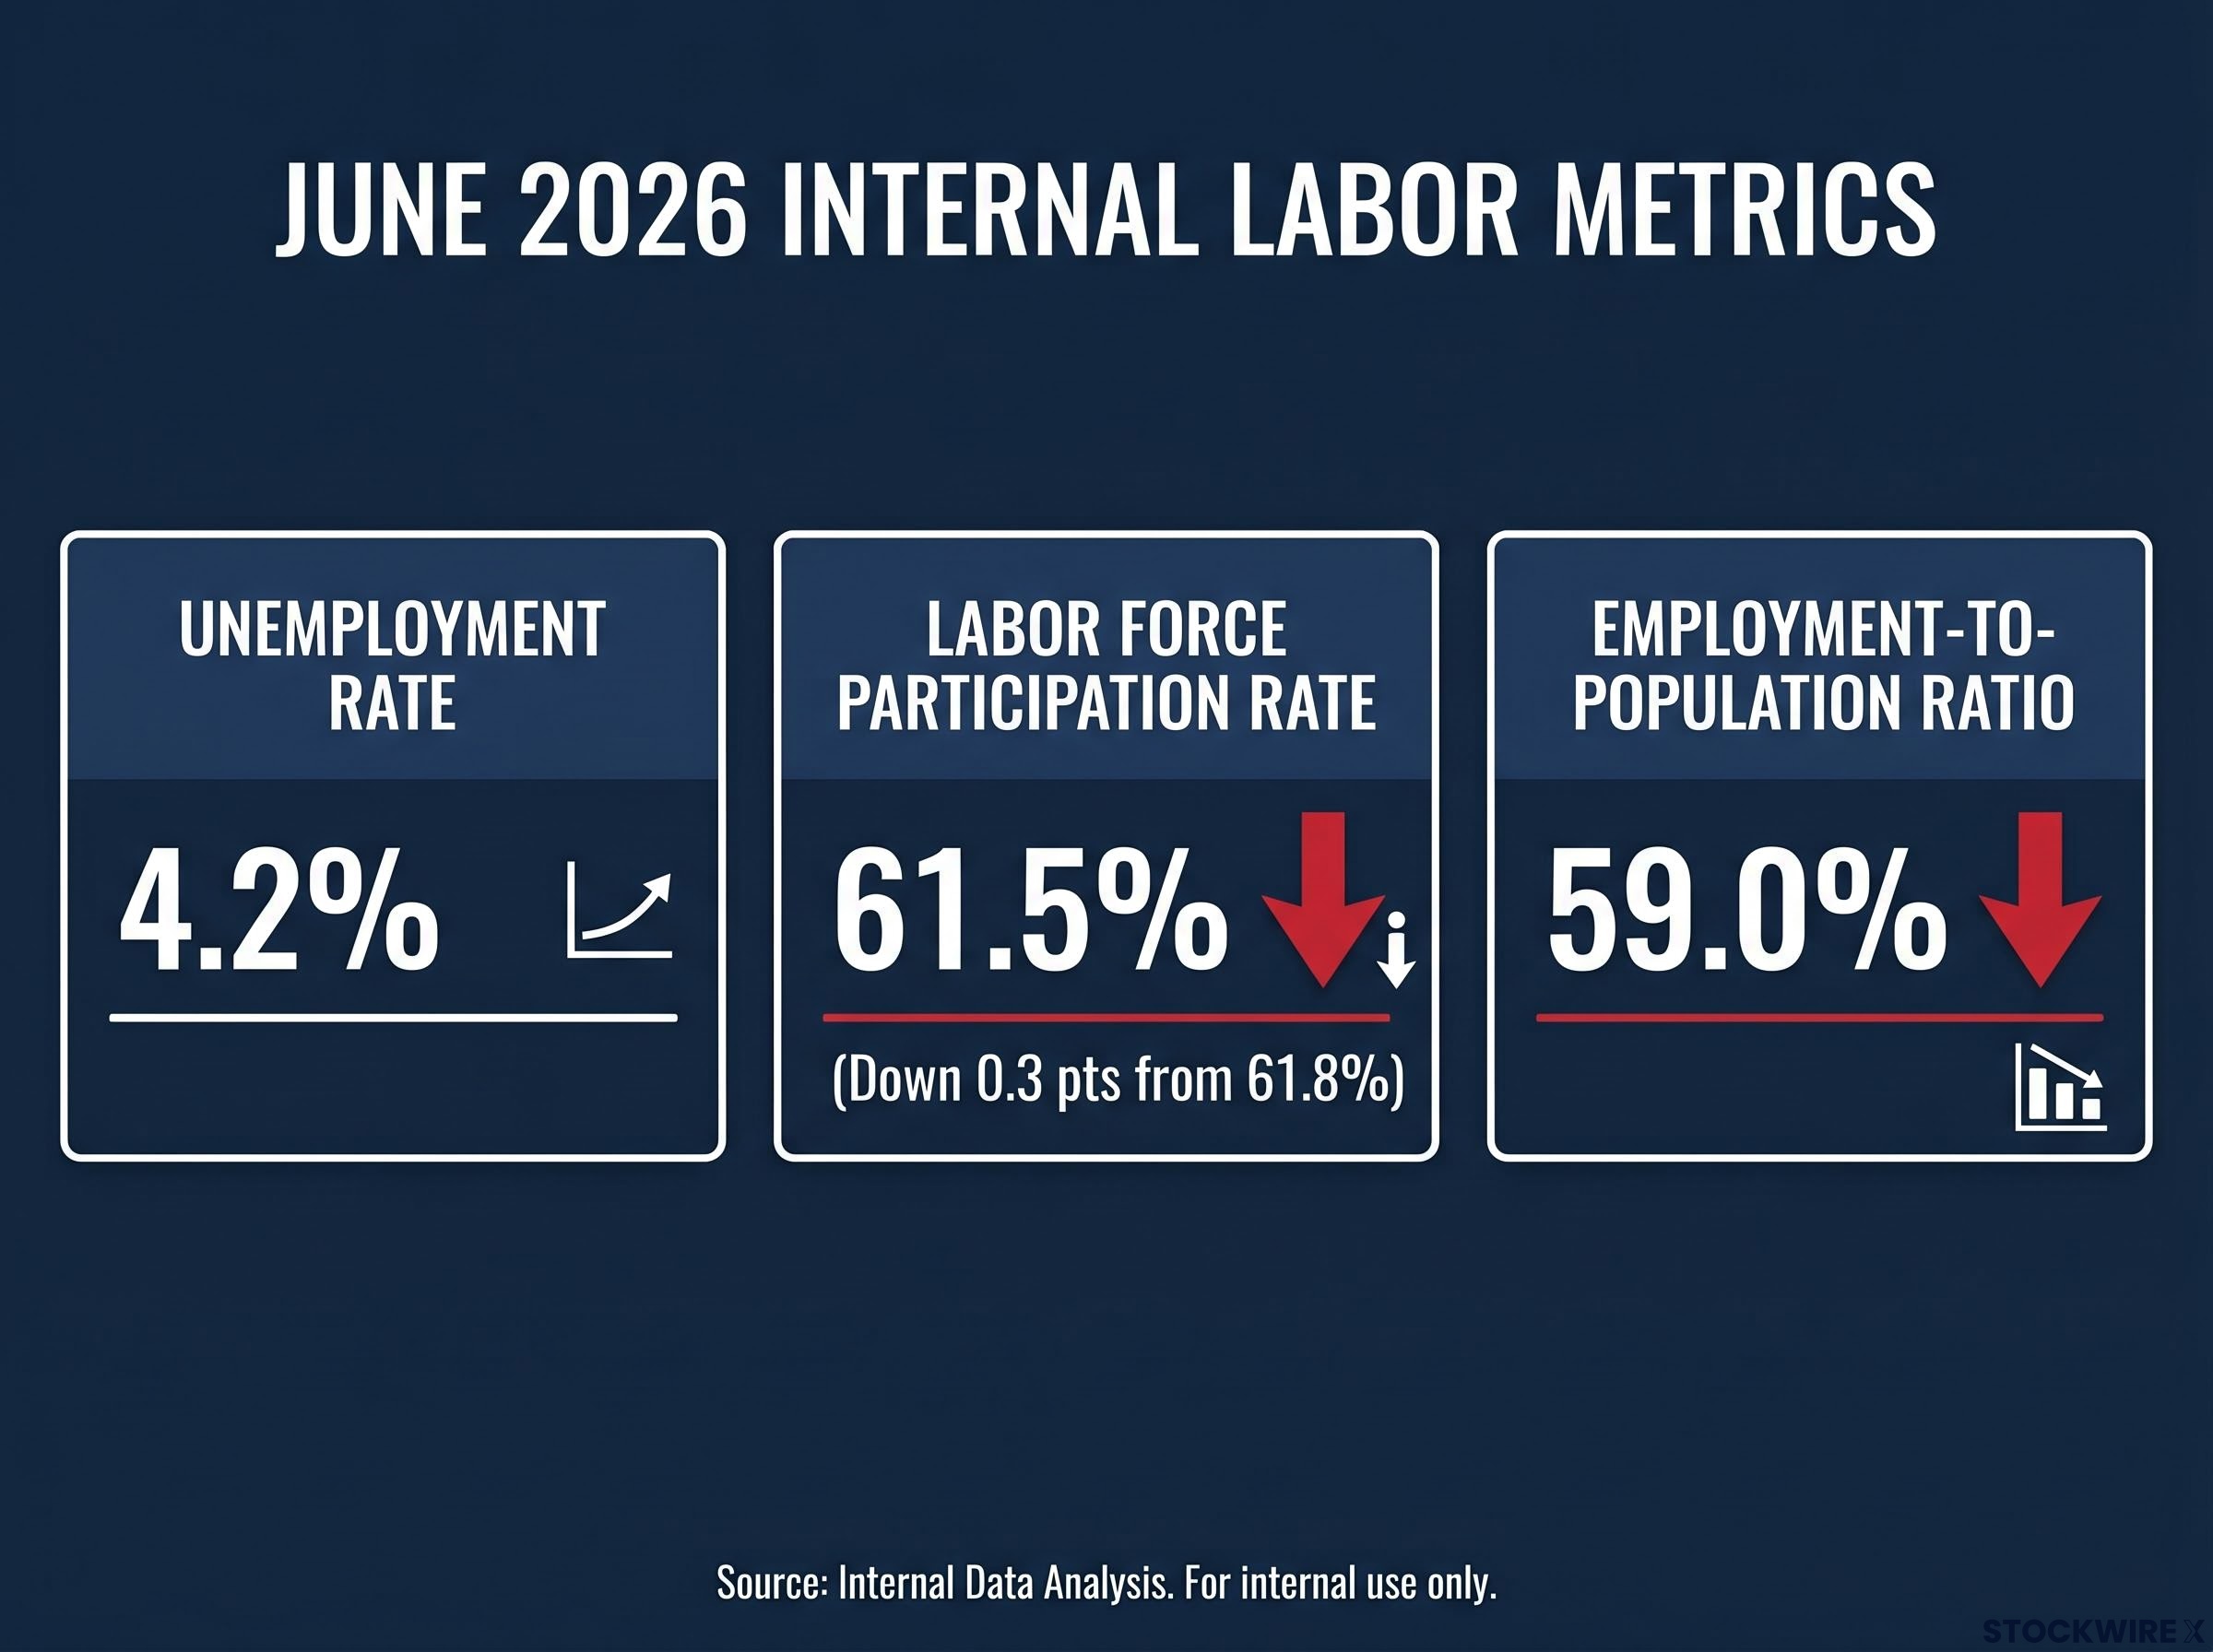
When participation falls and the employment-to-population ratio drops alongside a lower unemployment rate, you are watching people exit the labour force, not more people finding jobs. That is the opposite of a healthy signal, and investors who anchor on the headline rate risk misreading the underlying trend entirely.
Kansas City Fed research on participation and employment ratios establishes that the unemployment rate and employment-to-population ratio can diverge sharply during periods when workers exit the labour force, making the participation rate a critical co-indicator for assessing genuine labour market strength.
Monthly payroll reports are provisional. The Bureau of Labour Statistics (BLS) revises each month’s figures as more complete data arrives, typically in the two subsequent releases. These revisions rarely make headlines, but they reshape the baseline against which every future number is measured.
The June report carried revisions that quietly rewrote the spring.
| Month | Original payrolls | Revised payrolls | Change |
|---|---|---|---|
| April 2026 | — | — | -31,000 |
| May 2026 | 172,000 | 129,000 | -43,000 |
| June 2026 | 57,000 (initial) | — | — |
Across April and May together, the BLS trimmed a combined 74,000 jobs from its earlier estimates. The May figure bore the larger share of that adjustment, falling 43,000 from the initially published 172,000 down to 129,000.
What this means is straightforward: the spring labour market data you were following in real time was overstated. The trajectory from April through June now forms a consistently softer trend line, not a single bad month against a solid backdrop. A weaker spring baseline raises the stakes for the July and August reports, because the trend those numbers need to confirm or deny has shifted lower than anyone realised until today.
The pattern of a headline beat masking weakness was already visible in the April data, where a three-month average of just 48,000 jobs per month and simultaneous contraction in both ISM Manufacturing and ISM Services Employment signalled deceleration well before June confirmed it.
The data points converge on a single directional signal: labour demand is cooling. Softer payrolls, falling participation, and downward revisions all strengthen the case for a more accommodative Federal Reserve posture, though the timing and magnitude of any policy shift remain genuinely uncertain.
The FOMC’s dual-mandate conflict, with PCE inflation running at 3.5% against a 2% target while unemployment was already rising before June’s print, means the committee enters the next decision window with weaker payrolls adding pressure from one side of its mandate without providing relief on the other.
The question the market is pricing right now: is this a one-off weak month within a moderate expansion, or the start of a broader softening trend?
What would distinguish the two is the next couple of prints. A July rebound toward 150,000 or above, with stable participation, would support the anomaly reading. A second consecutive miss below 100,000 would tilt the weight toward something more sustained.
The asset class implications flow from that distinction:
For your positioning, the report does not signal a crisis, but it does shift the balance of risks toward slower growth and easier policy. Reassessing duration exposure and cyclical weighting is warranted now, before confirmation arrives, because by the time the pattern is confirmed the repricing will already be underway.
A single report does not close the debate. Here are the four indicators that will, in order of importance:
Each of these tells you something the headline payroll number cannot. Together, they give you a framework for interpreting the next report independently rather than waiting for the consensus reaction.
The June jobs report tells a three-part story. A 57,000 payroll print that missed consensus by half. An unemployment rate of 4.2% that conceals falling participation and a slipping employment-to-population ratio of 59.0%. And 74,000 in combined downward revisions that reveal the spring was weaker than the data suggested in real time.
Two scenarios remain genuinely open: this is either a temporary soft patch within a moderate expansion, or the early stage of a broader slowdown. The data does not close that question yet.
What it does is shift the weight of evidence. The labour market resilience that had supported the “soft landing is complete” reading is no longer a given. It is a hypothesis under scrutiny, and the next few months of data carry more than the usual weight in settling it.
For investors reassessing sector weights in light of softening labour demand, our dedicated guide to cyclical and defensive allocation covers how blended portfolios shift from cyclical-heavy positions in expansion toward defensive tilts as growth signals deteriorate, with worked allocation ranges across each phase of the economic cycle.
This article is for informational purposes only and should not be considered financial advice. Investors should conduct their own research and consult with financial professionals before making investment decisions. Past performance does not guarantee future results. Financial projections are subject to market conditions and various risk factors.
The June 2026 US jobs report showed only 57,000 jobs added, against a consensus forecast of 114,000, representing an approximate 50% undershoot. The report also included combined downward revisions of 74,000 jobs across April and May 2026.
The unemployment rate fell to 4.2% largely because the labour force participation rate dropped 0.3 percentage points to 61.5%, meaning fewer people were counted as actively seeking work. When workers exit the labour force, the unemployment rate can fall mechanically even without genuine improvement in hiring conditions.
The employment-to-population ratio measures what share of the total working-age population is actually employed, regardless of whether others are searching for work. In June 2026 it slipped to 59.0%, and unlike the unemployment rate it cannot be distorted by workers leaving the labour force, making it a cleaner gauge of genuine labour market health.
Softer payrolls, falling participation, and downward revisions all strengthen the case for a more accommodative Fed posture. However, with PCE inflation running at 3.5% against a 2% target, the Fed faces a dual-mandate conflict that makes the timing and magnitude of any rate cut genuinely uncertain.
Investors should monitor subsequent monthly payroll reports (a rebound above 150,000 would support the anomaly reading while consecutive prints below 100,000 would confirm a trend), prime-age labour force participation, wage growth trajectory, and JOLTS data covering job openings, quits, and layoffs.