Every additional US$200 billion of annual data-centre investment requires copper equivalent to an entirely new mine producing 150,000 tonnes a year. That figure comes from BHP’s own commodity outlook, and it reframes the AI story from a software-and-chips narrative into something far more physical.
The global AI capital expenditure cycle is not an abstract technology phenomenon. It is a concrete build-out that needs copper wiring, grid-connected land, and industrial facilities at scale, and Australia sits unusually well positioned across all three. ASX-listed entities spanning copper mining, data centre operations, and industrial property are all exposed to the same underlying demand driver.
Here is a map of where the structural AI capex cycle actually shows up in ASX-listed companies, how to judge the quality of each exposure, and what would invalidate the thesis. After this, you will know which ASX positions represent genuine structural exposure and which are narrative dressing.
From server farms to copper mines: how the AI build-out becomes a physical demand story
Start with the intensity numbers, because they are where the demand shift becomes visible. A traditional data centre embeds roughly 5-15 tonnes of copper per megawatt of capacity. An AI-ready hyperscale facility, according to Skillings, runs at 35-50 tonnes per MW. The physical footprint of an AI workload is several times heavier than the previous generation.
| Facility type | Copper intensity (tonnes per MW) |
|---|---|
| Traditional data centre | 5-15 |
| Hyperscale AI training | 35-50 |
| BHP/Microsoft Chicago case study | 27 (approx.) |
The copper is not in the servers. It sits in the power and cooling layer that keeps the servers running, which is what makes the demand durable rather than discretionary. That copper goes into:
- Transformers stepping grid power down to usable voltages
- Switchgear routing and protecting electrical circuits
- Busbars carrying high current across the facility
- Liquid-cooling loops managing the heat AI chips generate
- Near-site grid connections tying the facility to the network
The widely cited BHP/Microsoft case in Chicago illustrates the scale. An 80 MW facility used roughly 2,177 tonnes of copper, about 27 tonnes per MW. Scale that up, and a 230 MW hyperscale facility can require 10,000 tonnes, worth roughly US$115 million at late-2025 prices.
Now watch the aggregate demand accumulate. S&P Global’s “Copper in the Age of AI” analysis estimates all data centres consumed about 1.1 million tonnes of copper in 2025 and around 1.2 million tonnes in 2026, roughly 4.1% of a 29.2 million tonne global baseline. AI-specific facilities alone account for 350,000-400,000 tonnes annually.
That share is projected to climb. UBS estimates data centres and their power generation drew around 900,000 tonnes in 2025, and projects an 11% compound annual growth rate to 1.55 million tonnes by 2030. S&P Global sees combined data centre and grid-connection use reaching 2.5 million tonnes by 2035, roughly 7% of current global demand.
The S&P Global copper demand analysis projects a combined data centre and grid-connection consumption figure of 2.5 million tonnes by 2035, roughly 7% of current global demand, a trajectory that frames the supply shortfall as a structural condition rather than a temporary pricing anomaly.
Every additional US$200 billion of annual data-centre investment requires copper equivalent to a new 150,000-tonne-per-annum mine. (BHP Economic and Commodity Outlook, August 2026)
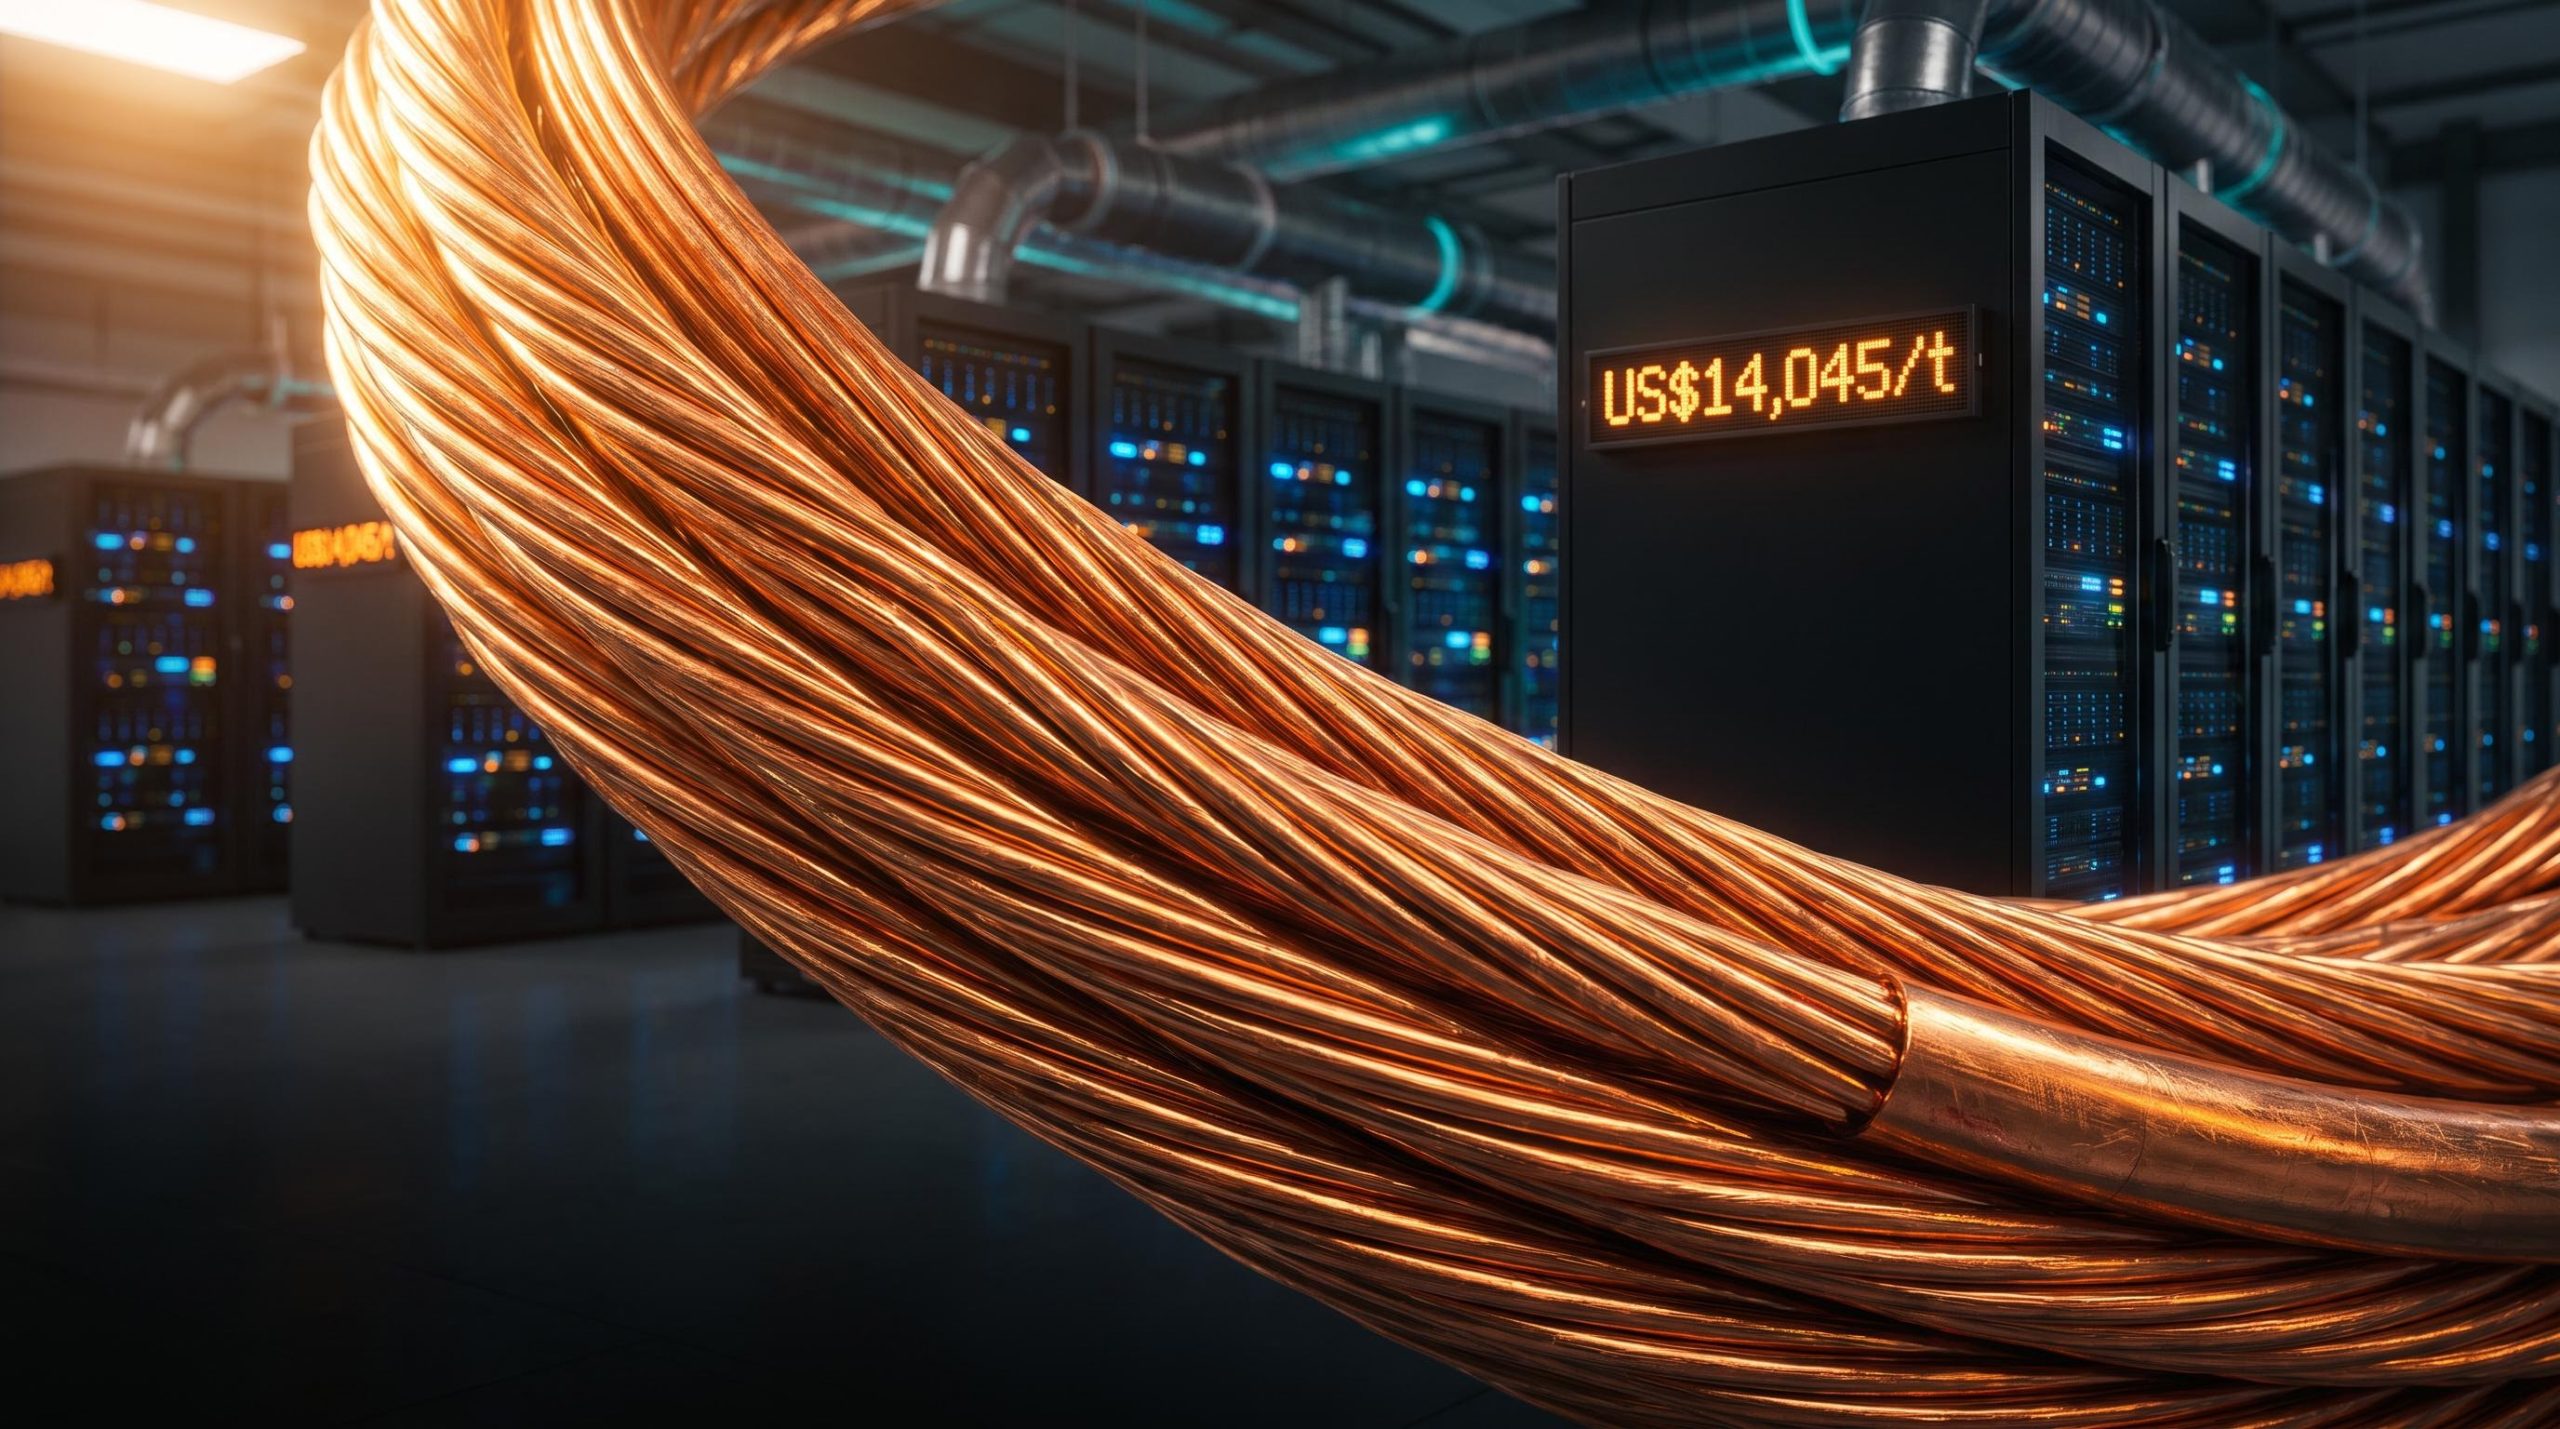
The supply side is the part that makes this structural rather than cyclical. S&P Global projects a potential copper supply shortfall of 6-10 million tonnes by 2035, driven by overlapping demand from AI, electrification, electric vehicles, and defence. Copper’s LME Grade A cash price sat at US$14,045 per tonne on 15 September 2026, with COMEX futures at US$6.41 per pound on 16 September 2026.
The copper price drivers behind the September 2026 all-time high above USD 14,700 per tonne include both genuine structural scarcity and tariff-driven inventory repositioning, a distinction that shapes how durable the current LME level is relative to the AI build-out thesis.
What this tells you is that copper exposure on the ASX is not simply a bet on AI spend holding up. It is a bet on whether new mine supply can respond fast enough given long lead times and permitting constraints. That distinction matters, because it means the structural price case stays relatively durable even if AI capex growth slows.
When big ASX news breaks, our subscribers know first
What the Australian data-centre pipeline means for ASX property and infrastructure plays
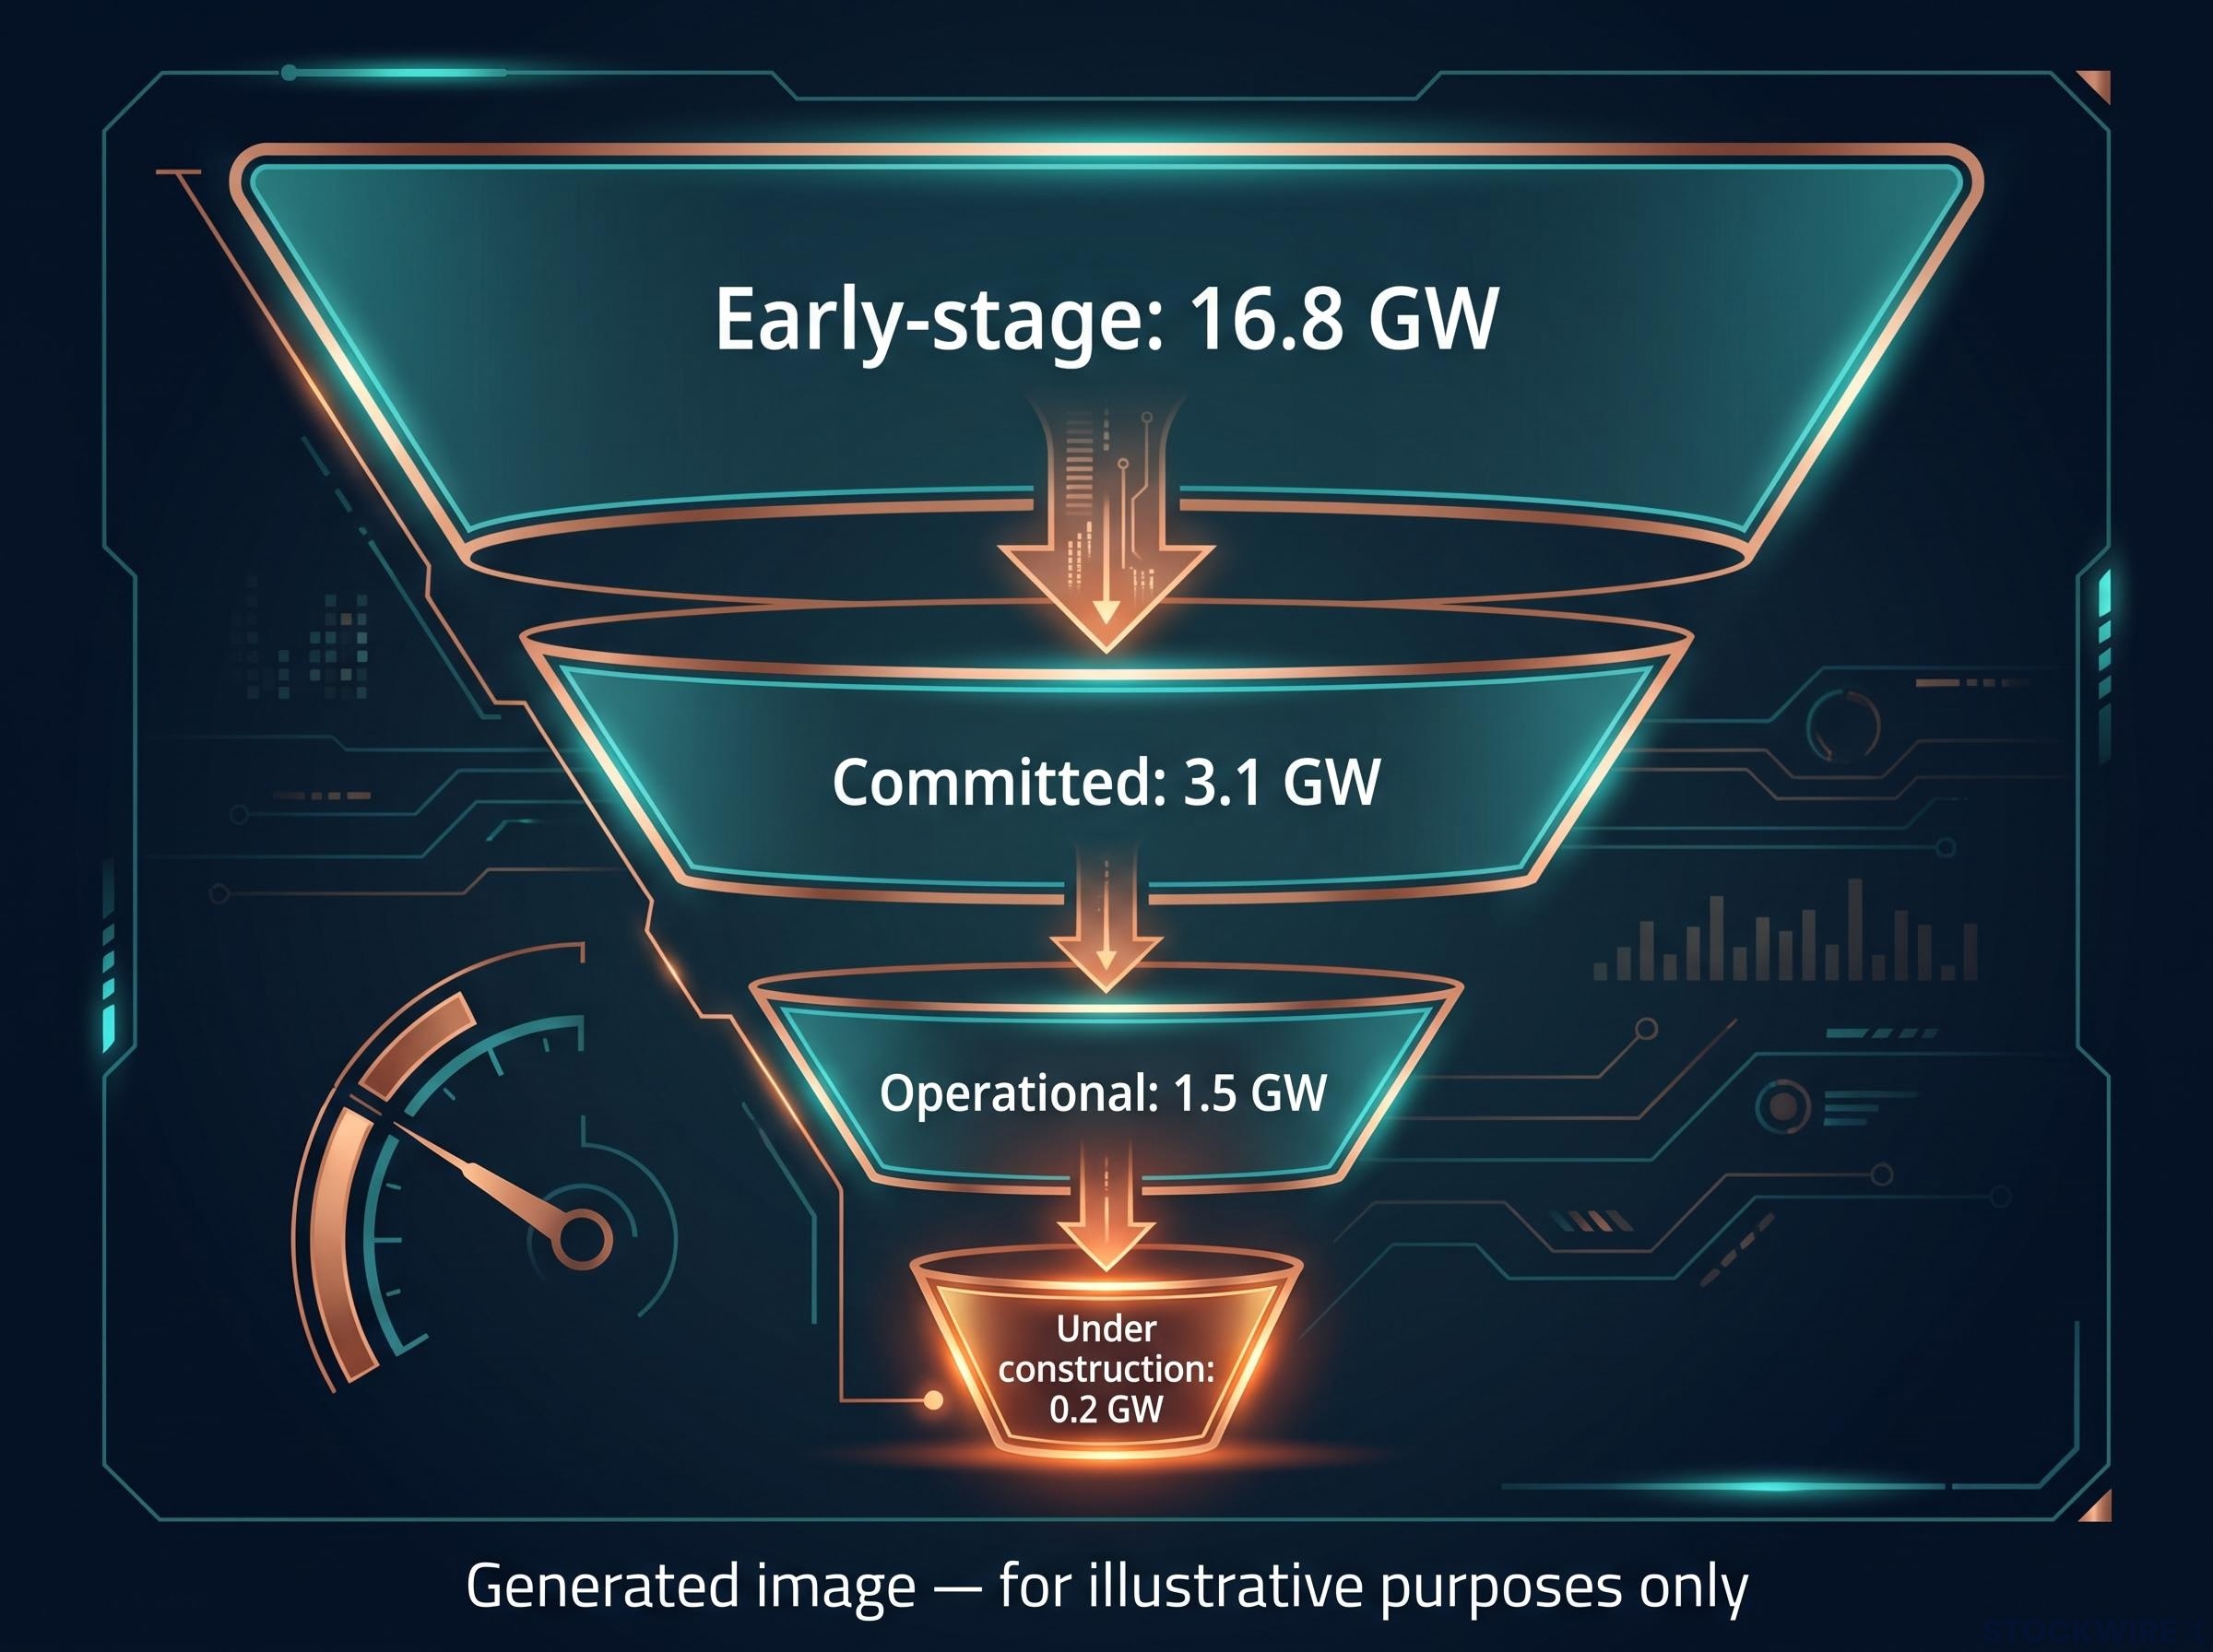
Australia’s data-centre pipeline reads as enormous on the surface. The total announced capacity sits at roughly 21.6 GW, according to Data Centres Australia and DC Byte. Operational capacity was 1.4-1.6 GW in mid-2026, projected to reach 3.2-3.9 GW by 2030.
The headline number hides the real story. Only about 25% of that pipeline is genuinely development-ready. CommBank’s more conservative estimate of advanced near-term capacity lands at around 6 GW.
| Pipeline stage | Capacity |
|---|---|
| Operational | 1.5 GW |
| Under construction | 0.2 GW |
| Committed | 3.1 GW |
| Early-stage | 16.8 GW |
The demand is concentrated. Sydney accounts for roughly 11.4 GW of the pipeline (only 0.8 GW operational in 2025), while Melbourne holds about 9.0 GW (0.4 GW operational). The gap between announced and buildable is the filter that separates structural revenue growth from speculative asset inflation, and it is where you should apply pressure when weighing Goodman and NEXTDC.
Goodman Group: industrial land as the AI infrastructure choke point
Goodman Group has pivoted its development book decisively toward data centres. FY26 results show total development work-in-progress of A$19.7 billion, with data centres at roughly 78%, more than A$15 billion. That shift contributed to approximately 10% profit growth.
The domestic commitments are concrete. Goodman is converting a Guildford West warehouse site in Sydney into Project Pluto, a A$1.1 billion, 68 MW hyperscale facility, and has broken ground on SYD01, a 90 MW data centre in Northern Sydney. Its global secured power bank now stands at 6.4 GW.
The edge here is not development capability alone. It is the scarcity of grid-connected industrial land in Sydney and Melbourne, and Goodman already owns much of it. That land is the choke point the entire domestic build-out runs through.
Goodman’s pipeline and valuation dynamics are complicated by a roughly 20% share price pullback from the August 2025 peak despite reaffirmed 9% earnings growth guidance, a compression that reflects the market recalibrating the premium it assigns rather than a change in the underlying development thesis.
NEXTDC: contracted utilisation as the revenue quality signal
NEXTDC shows the revenue leverage from hyperscale demand more directly. Pro-forma contracted utilisation rose from 228 MW in March 2025 to 412 MW by late 2025, with the forward order book expanding to 544 MW by early FY26.
The headline event came in December 2025, when NEXTDC signed a memorandum of understanding with OpenAI to develop a hyperscale AI campus and GPU supercluster at Eastern Creek in Western Sydney, with planned capacity of up to 550 MW and an estimated A$7 billion value. A A$1.5 billion capital plan is earmarked for its S4 Horsley Park campus through FY27.
The forward order book is the signal that separates NEXTDC from speculative capacity. It tells you where hyperscaler demand is actually concentrating, and it is concentrating on grid-connected sites with signed intent behind them.
Which ASX copper and resource names carry the most direct structural exposure?
Not all copper exposure on the ASX carries the same weight, so it helps to build a hierarchy rather than a list. At the top sits BHP, the large-cap anchor. More than half its earnings come from copper, and its own August 2026 Economic and Commodity Outlook directly connects data-centre capex to copper demand.
That self-authored link gives BHP analytical credibility as a structural play rather than a pure commodity bet. BHP forecasts global copper demand to exceed 50 million tonnes by 2050. Copper prices rose more than 5% in August 2026 alone, according to Charles Casey, portfolio manager at Solaris Investment Management.
| Company | Exposure type | Attribution |
|---|---|---|
| BHP | Producer (large-cap) | Own commodity outlook |
| Sandfire (ASX:SFR) | Producer | GoMarkets |
| Capstone Copper (ASX:CSC) | Producer/developer | Pendal Group |
| Develop Global (ASX:DVP) | Developer | Pendal Group |
| 29Metals | Producer | StocksDownUnder |
The mid-cap and small-cap names express the same thesis with more leverage and more risk. Pendal Group has highlighted three in particular, distinguished by asset quality rather than commodity price sensitivity alone:
- Capstone Copper (ASX:CSC): high-grade resources aligned to structural rather than cyclical demand
- Develop Global (ASX:DVP): project quality positioned for the structural copper cycle
- Firefly Metals (ASX:FFM): high-grade resource base flagged for the same demand driver
Sandfire Resources (ASX:SFR) has been included by GoMarkets in an AI-infrastructure basket, while StocksDownUnder points to 29Metals as a way to play the electrification and AI-driven copper cycle. Casey also notes lithium as a secondary structural materials theme, with supply constraints expected to persist 3-10 years.
Copper’s reclassification as a strategic infrastructure input, alongside battery metals as infrastructure inputs such as lithium and nickel, reflects a structural repositioning that institutional analysts argue the market continues to price as a cyclical trade rather than a multi-decade embedded demand story.
The distinction you need to hold is between producers with operating cash flow (BHP, Sandfire) and development-stage names where exposure is tied to project execution. The structural demand thesis is durable, but the timeline for price realisation is uncertain. That means small-cap developers stack project execution risk on top of commodity risk, not simply more of the same exposure. BHP is the lower-volatility expression; the small-caps amplify the upside but demand conviction on both the copper price and the path to production.
Where the thesis breaks down: deceleration, substitution, and valuation risk
The bull case deserves a bear case of equal rigour. Start with capex. Growth rates are set to slow sharply, even if absolute spending stays high.
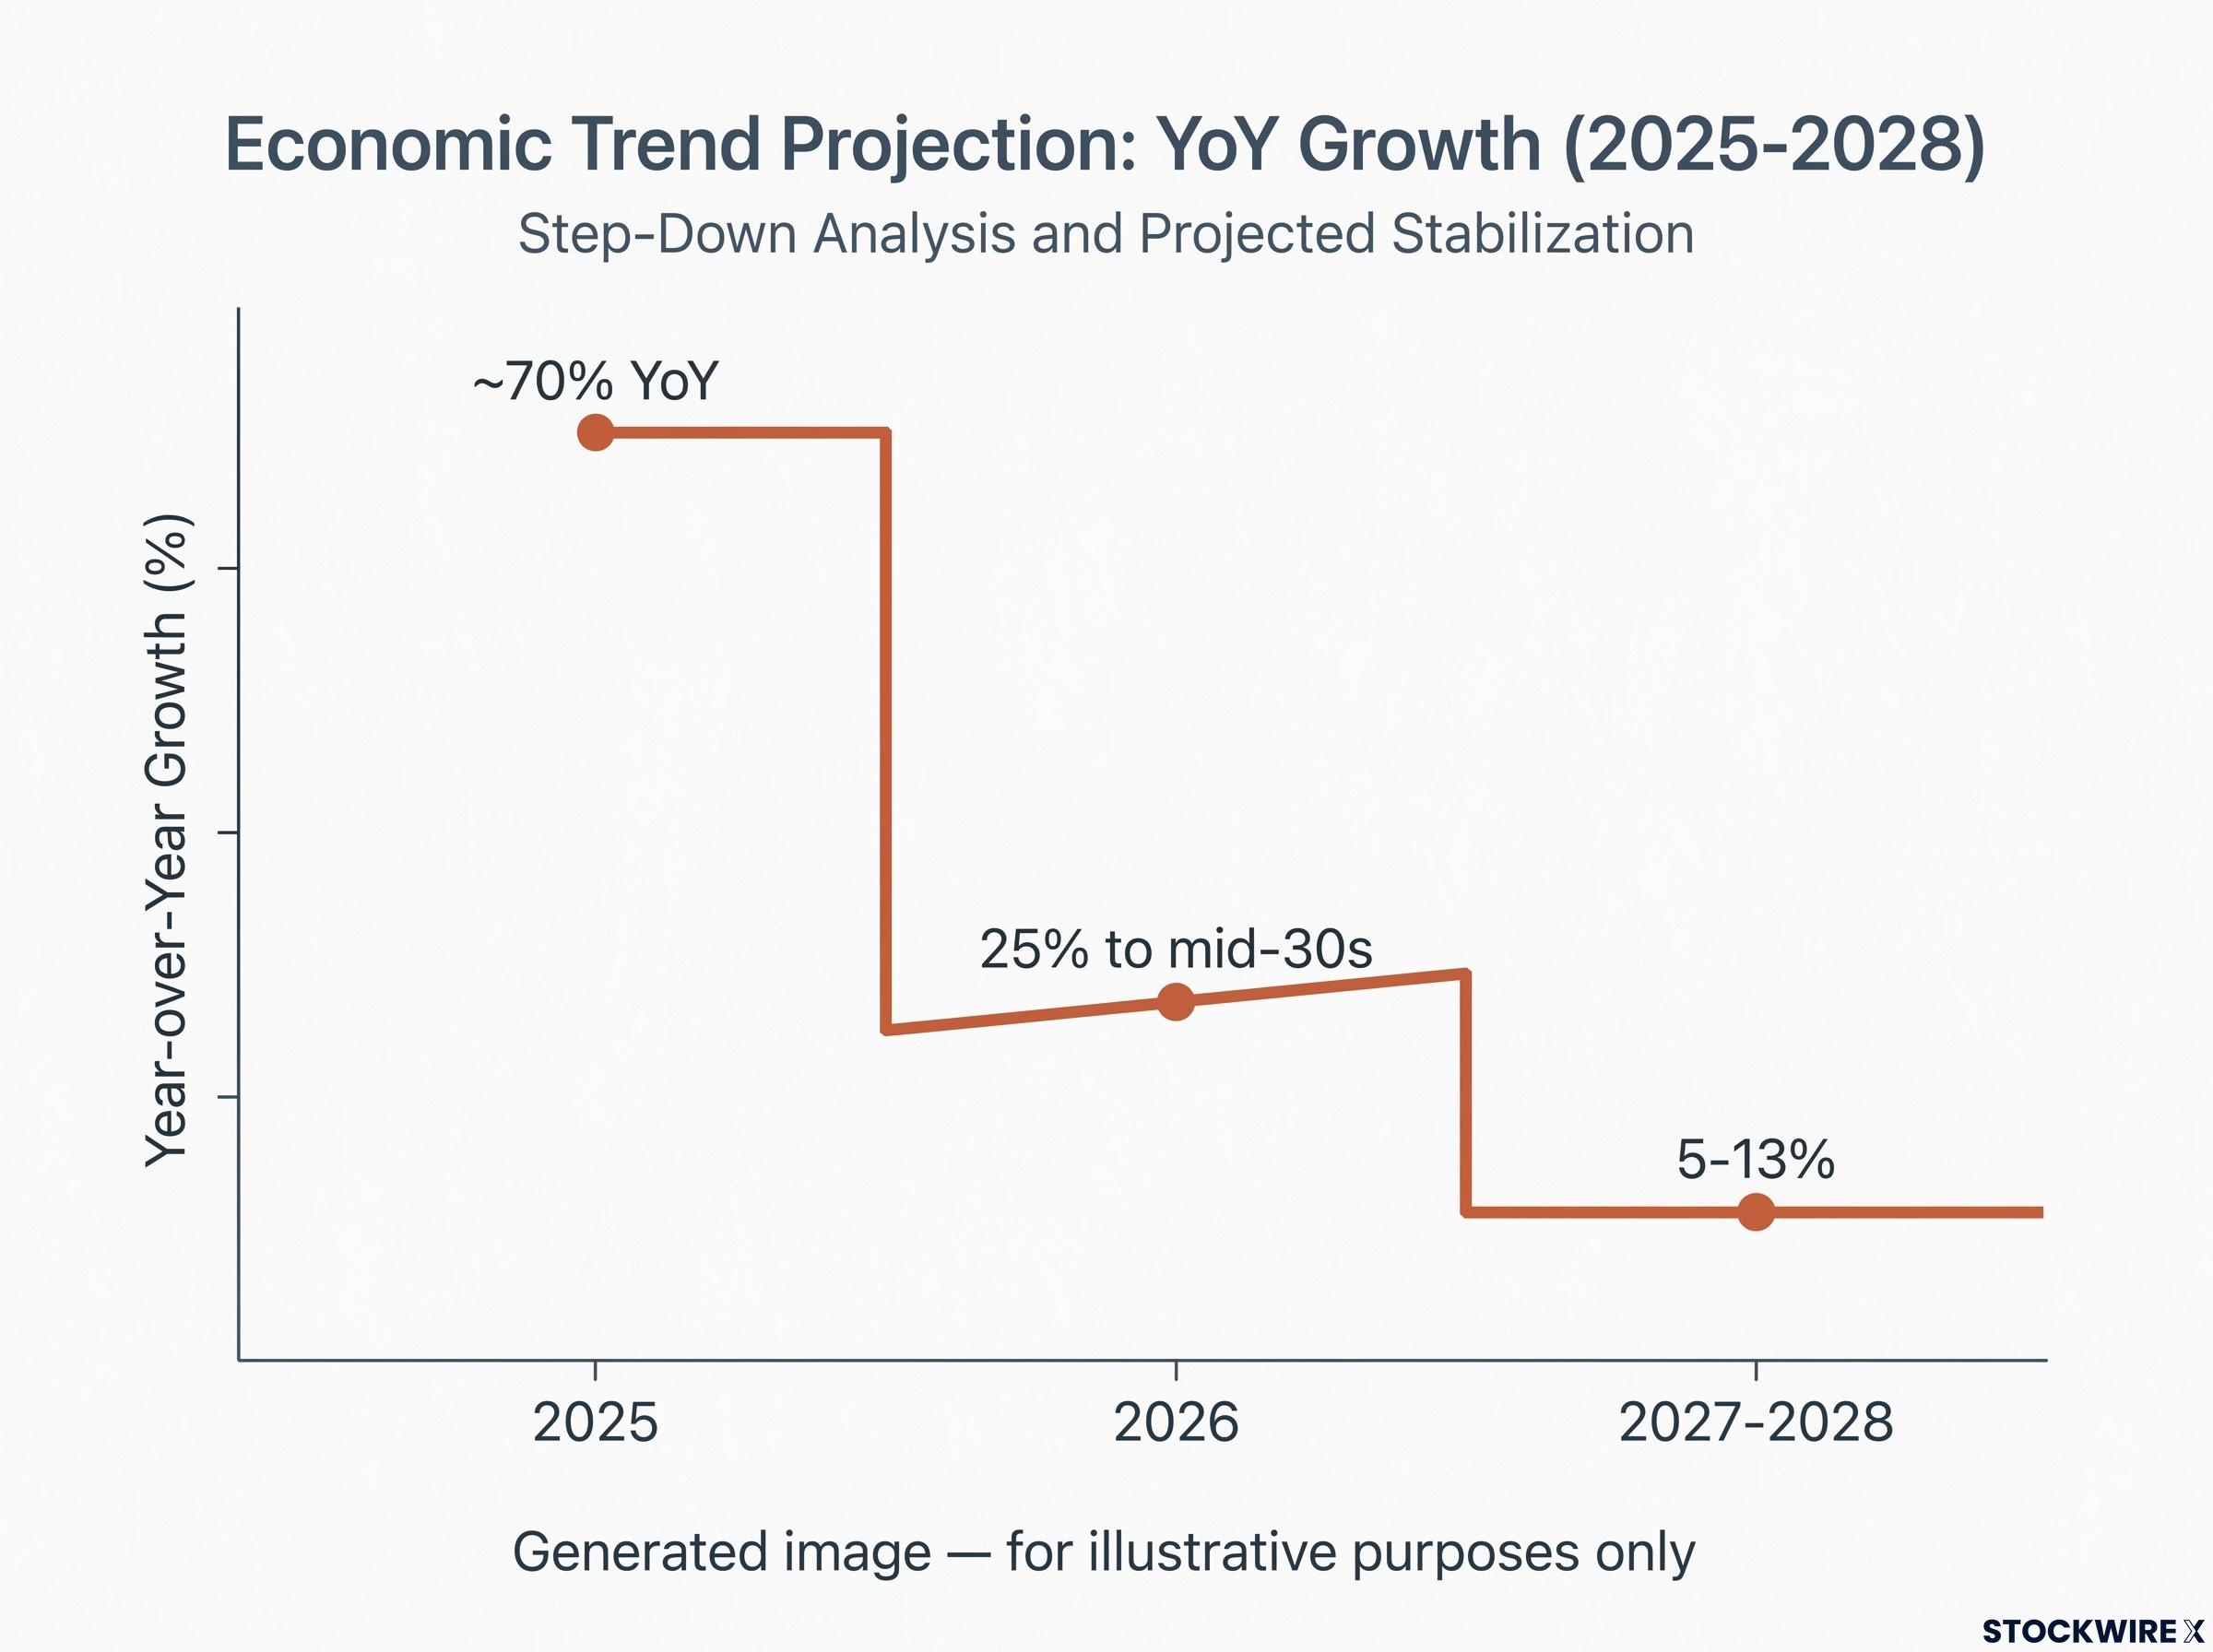
Goldman Sachs, Bank of America, UBS, and Allianz all see hyperscaler capital spending growth decelerating from approximately 70% year-on-year in 2025 to the mid-30s or 25% in 2026, then down to 5-13% by 2027 and 2028. That is not a collapse. It is a meaningful change in the rate of change, and re-rated resource names feel that most.
The demand mechanics are also contested. Macquarie’s estimate of incremental copper demand runs well below the bull case, and Morningstar flags several ways the physical build-out could disappoint.
Macquarie estimates data centres and AI might add a more modest 200,000 tonnes per year of incremental copper demand by 2030, against bull-case projections of 650,000-plus additional tonnes.
The risks group into four categories worth watching:
- Capex growth deceleration: the falling rate of hyperscaler spending compresses near-term upside for names that already re-rated
- Demand moderation and substitution: aluminium substitution, thrifting, and more efficient facility designs could reduce copper intensity per MW
- Execution risk: Goodman’s WIP grew from A$3 billion in FY2014 to A$19.7 billion in FY26, which Morningstar warns carries execution risk if pre-leasing slows
- AI-washing and narrative risk: companies invoking data-centre stories without secured contracts sit in a different risk category from those with signed agreements
Timing adds another layer. Techtarget and Reuters note that if AI training schedules shift or workloads change, facilities may be needed on different timelines or in different locations than assumed. Tighter export controls on chips could disrupt supply chains and reduce cumulative investment flows.
What this tells you is that the deceleration does not invalidate the structural copper thesis. It does compress the near-term upside for names already trading on the AI narrative, which means the valuation entry point now matters more than the thesis itself. Being able to articulate the specific conditions under which each ASX name underperforms is what separates a considered position from a momentum trade.
How to evaluate ASX AI infrastructure exposure before the next capex report
Not all ASX exposure to this theme is equal, and the analysis above points to a clear quality filter. Three variables do most of the work in separating structural positions from narrative ones.
- Contracted capacity versus announced pipeline. With only about 25% of Australia’s 21.6 GW pipeline development-ready, the question is not how much is announced but how much sits on grid-connected land with committed tenants. Goodman’s pre-leasing rate and NEXTDC’s forward order book are the operational reads here.
- Operating cash flow versus development-stage leverage. BHP and Sandfire carry the thesis with existing cash flow. Development-stage copper names amplify the upside but layer execution risk on top of commodity risk.
- Narrative supported by contracts. A data-centre story backed by a signed agreement, like NEXTDC’s OpenAI MOU, is a different proposition from one invoked to justify a valuation.
Three forward signals let you test whether the market is validating the structural case:
- Hyperscaler capex announcements in Q4 2026, which set the direction of the spending curve
- Australian grid connection approvals through the NEM process, tracked via AEMO
- The copper spot price, at US$14,045 per tonne in mid-September 2026, as the real-time barometer
Of these, the grid connection queue is arguably the most leading. AEMO data for the March 2026 quarter identifies 11 large-scale projects totalling 5.4 GW progressing through the NEM connection process, roughly 60% in NSW and 40% in Victoria. That represents committed physical infrastructure demand, and movement through the queue directly precedes construction, giving you a signal ahead of the headlines.
BHP’s forecast of copper demand exceeding 50 million tonnes by 2050 remains the large-cap anchor for the resource leg. Watch the queue, the order books, and the price together, and you can revisit your positions with a framework rather than news flow alone.
For investors wanting to stress-test the NEXTDC position before the next capex report, our deep-dive into NEXTDC’s valuation and moat assessment covers the Morningstar no-moat rating, the cumulative negative free cash flow trajectory to 2035, and the hyperscaler concentration risk that sits behind the order book headline.
This article is for informational purposes only and should not be considered financial advice. Investors should conduct their own research and consult with financial professionals before making investment decisions. Past performance does not guarantee future results, and financial projections are subject to market conditions and various risk factors. Forward-looking statements are speculative and subject to change based on market developments and company performance.