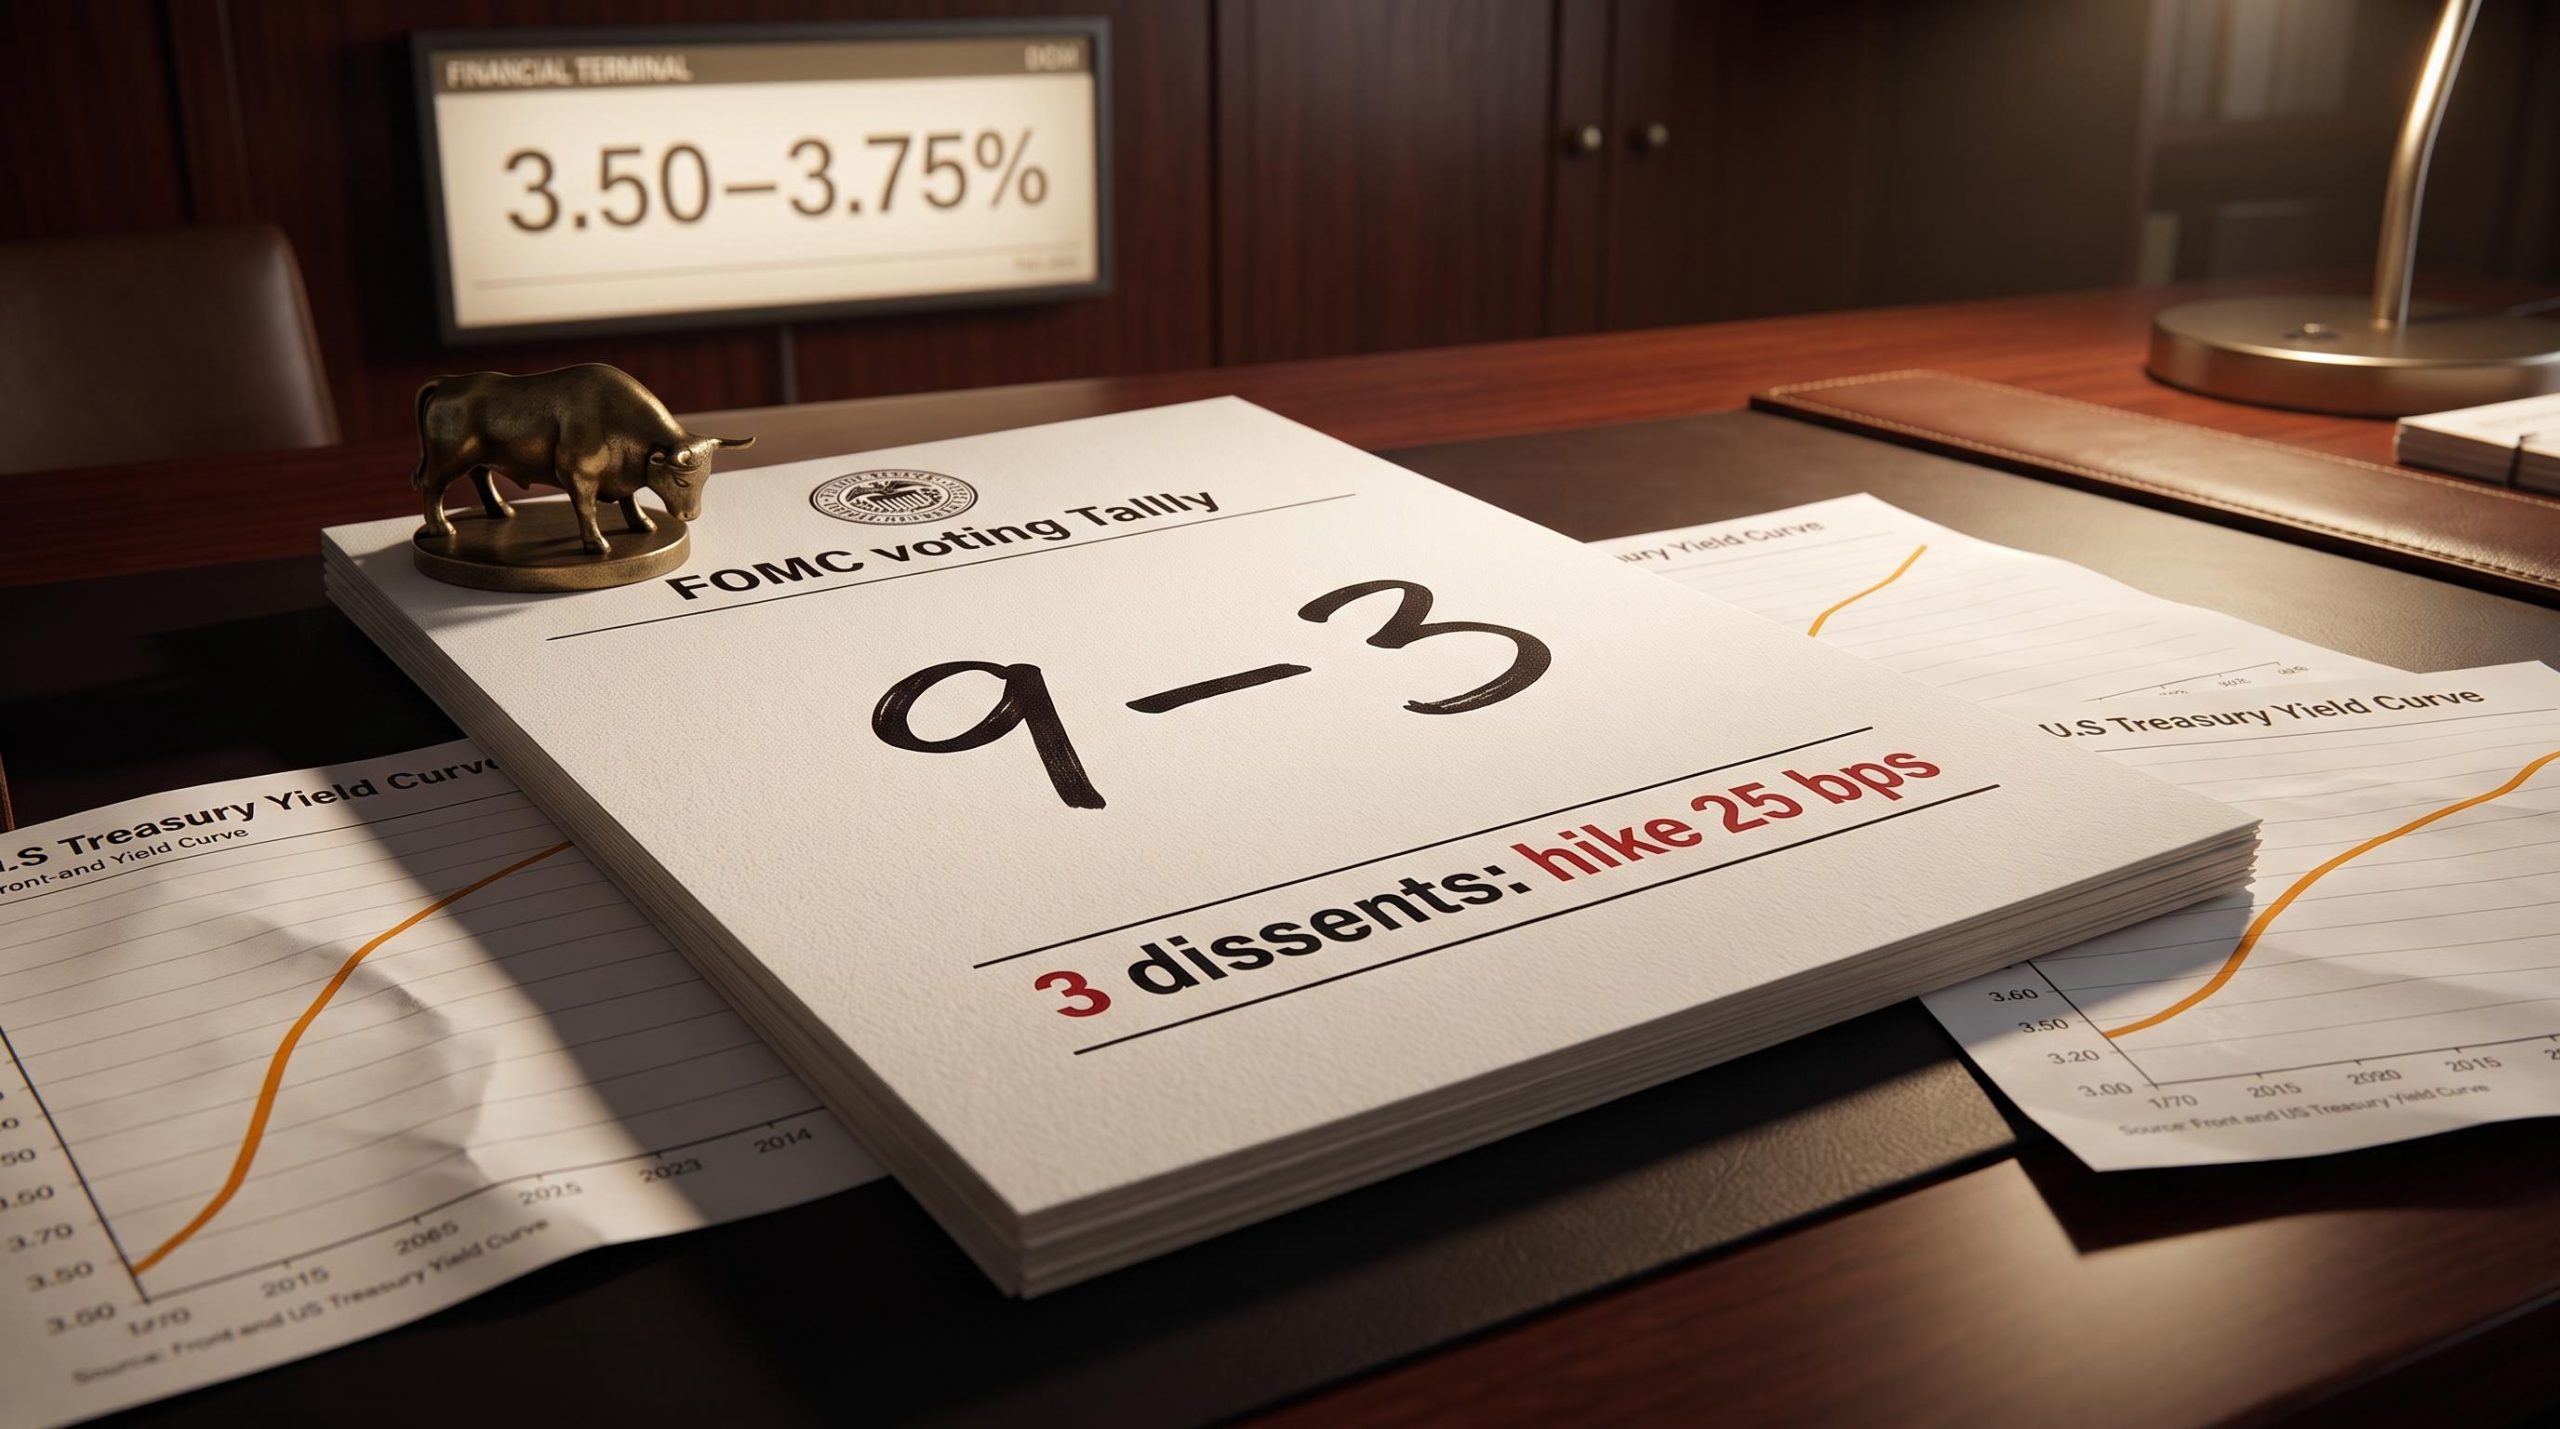
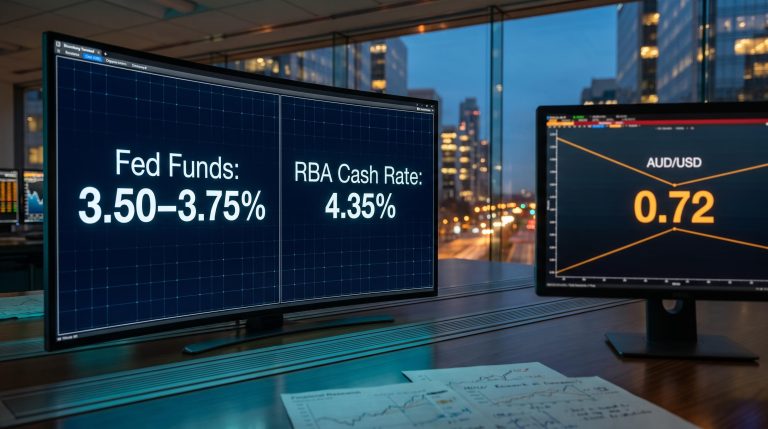
In the days before the September 2025 Federal Open Market Committee (FOMC) meeting, the market was almost unanimous on one thing: the Federal Reserve was about to raise rates. Prediction platform Kalshi put the odds of a hike at 87%. The CME FedWatch tool read 93%. Both were wrong.
On 17 September 2025, the Fed cut rates by 25 basis points, lowering the federal funds target range to 4.00%-4.25%. The gap between what the market was certain would happen and what actually happened is the story, and it frames why the forward path is harder to read than the consensus suggests.
That decision did not arrive in a vacuum. It came after more than 60 consecutive months of consumer price inflation above the 2% target, against a $9 trillion wall of maturing government debt, and during a period when political pressure on Fed independence had become a genuine market risk.
This analysis maps the four things you need before making positioning decisions in this environment: how the actual decision compared to the dominant forecast, what the bond and equity markets did in response, where major banks see rates going through 2026, and which structural risks could break the soft-landing narrative.
What the Fed actually did in September 2025, and why the consensus got it wrong
Analysts had built a tidy case for tightening. Headline consumer price inflation was still running at roughly 3.4%-4%, comfortably above target, and the argument ran that another hike was needed to defend confidence in US debt markets and demonstrate the Fed would not bend to presidential pressure against higher rates. Kalshi gave a hold just 14% odds. The conviction was near total.
The September miss also exposes a subtler problem: only 12 members vote at any given meeting, and the FOMC structure means public commentary from non-voting regional presidents can distort consensus signals without carrying binding policy weight.
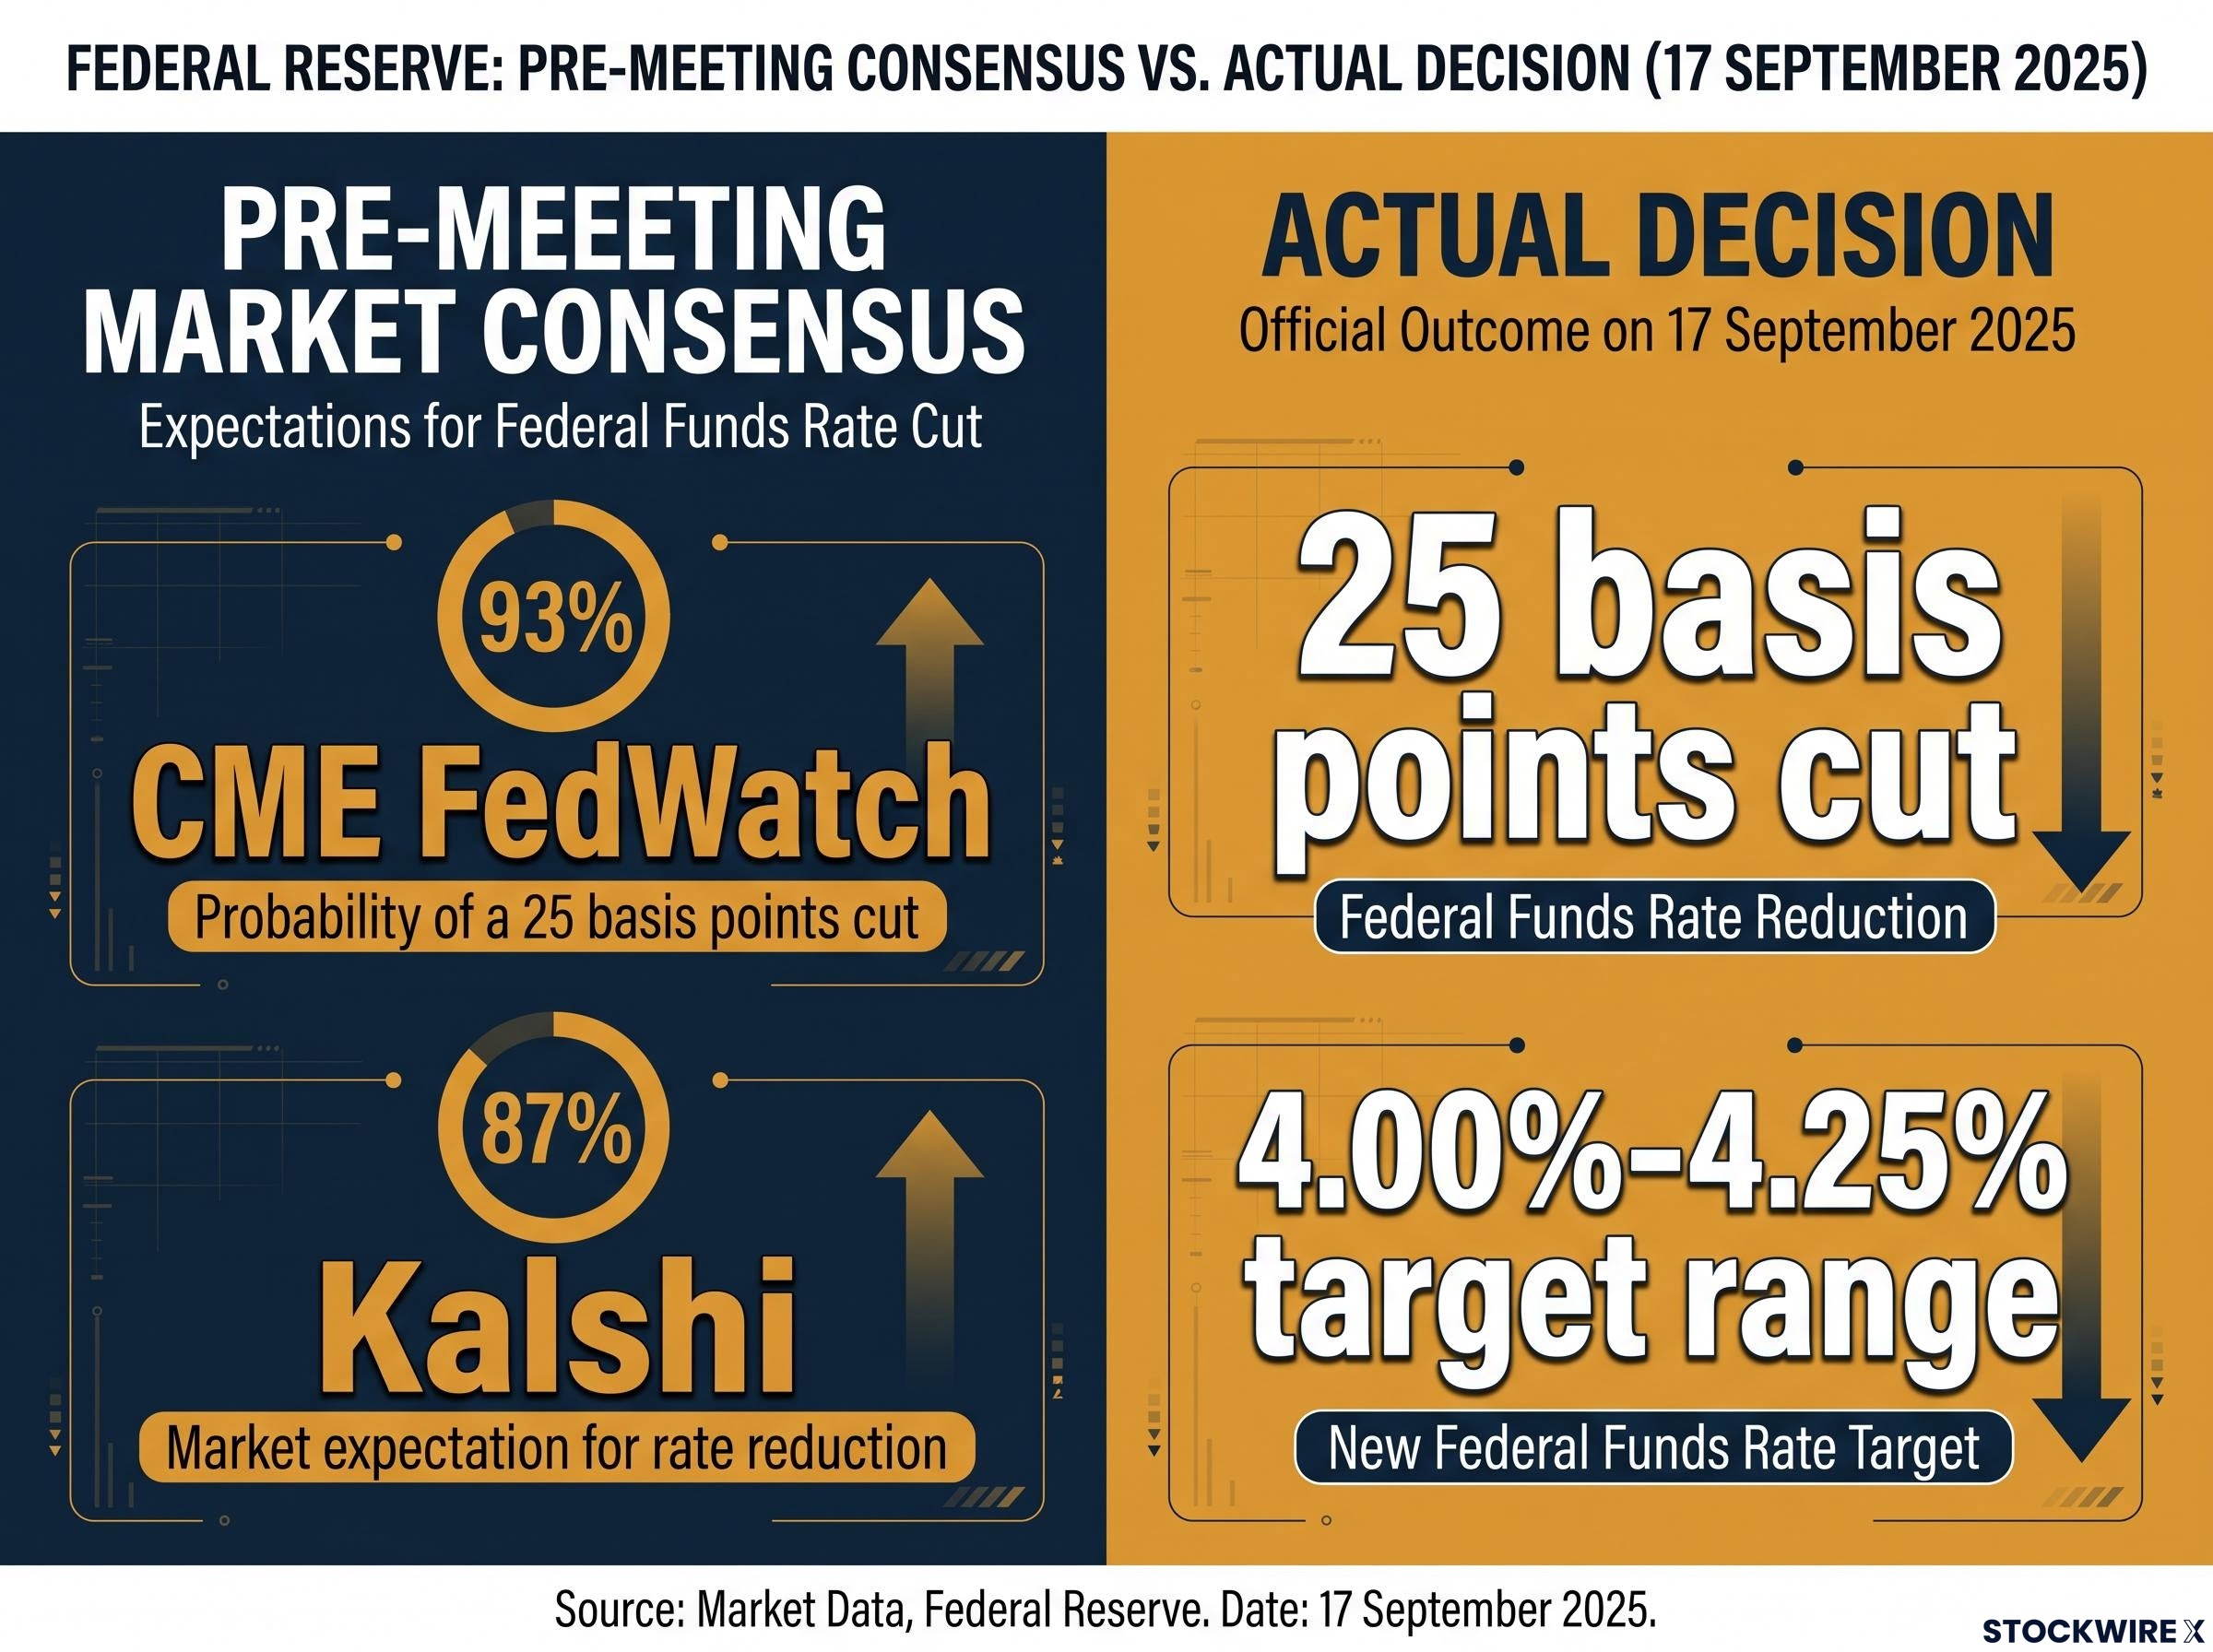
The CME FedWatch tool priced a 93% probability of a rate increase heading into the meeting. The Fed cut instead.
According to the official FOMC statement of 17 September 2025 and the minutes published on 8 October 2025, almost all members agreed to lower the target range by a quarter point, moving it from 4.25%-4.50% down to 4.00%-4.25%. This was not a split committee overruled by a chair. It was a broad agreement that the market had failed to see coming.
Several forces shifted the calculus away from the tightening the consensus expected:
- Growth risk emerging: softening activity data raised the cost of holding policy too tight, tilting the committee toward insurance against a slowdown.
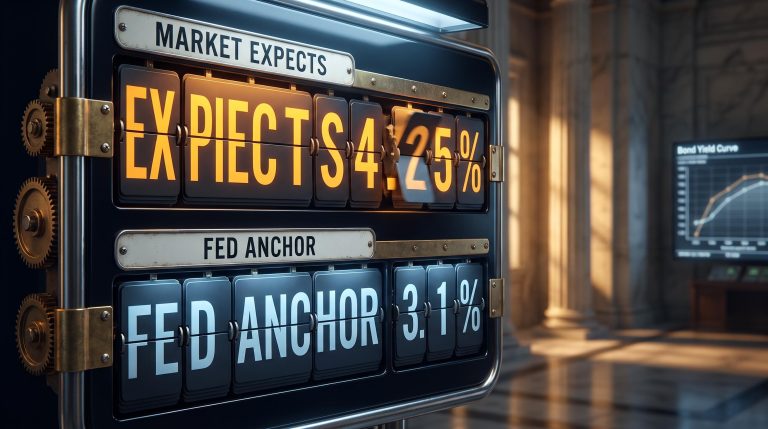
- Inflation expectations anchoring: a credible easing path reinforced control over inflation rather than undermining it, giving the Fed room to move.
- The debt maturity wall: with roughly $9 trillion of government debt rolling over in 2025, every additional basis point of tightening compounds the government’s financing burden, making further hikes structurally expensive.
Here is what that miss tells you. When a near-unanimous market consensus for a hike is overtaken by a cut, it exposes how poorly the Fed’s reaction function can be modelled from public inflation data alone. Positioning your portfolio around a single macro indicator, in this case CPI, as a reliable policy predictor carries real risk. The same single-variable error that missed the September pivot could be baked into how the market is pricing the path from here.
When big ASX news breaks, our subscribers know first
How Treasury yields moved, and what the bond market is pricing from here
If the rate cut was supposed to pull yields lower, the bond market did not fully cooperate. On 15 September 2025, the 10-year Treasury yield sat at roughly 4.04%. Immediately after the announcement it dipped below 4%, then closed near 4.07% on 17 September. By the end of that month it had climbed to 4.16%, moving up even as the Fed eased.
| Date | 10-year yield | Context |
|---|---|---|
| 15 September 2025 | ~4.04% | Pre-meeting, market pricing a hike |
| 17 September 2025 | ~4.07% | Decision-day close after the cut |
| End September 2025 | 4.16% | Yield drifting higher post-cut |
| Mid-September 2026 | ~4.95%-4.96% | St. Louis Fed DGS10 reading |
The short-end and long-end mechanics deserve unpacking. When the Fed cuts, the front of the curve responds directly to policy. The long end reflects something different: expected future short-term rates plus a term premium, the extra yield investors demand for holding longer-dated debt. Post-decision commentary described bull-flattening and bull-steepening patterns, where softer growth expectations drive flight-to-quality demand into Treasuries and a credible easing path compresses that term premium.
Why the long end is not following the Fed lower
The upward drift in the 10-year through late 2025 and into 2026, reaching roughly 4.95%-4.96% by mid-September 2026 on St. Louis Fed DGS10 data, points to a force stronger than policy pulling in the other direction. That force is supply.
By mid-September 2026 the 10-year had climbed to roughly 4.95%-4.96%, a dynamic that Chair Kevin Warsh explicitly acknowledged at Jackson Hole: market-driven tightening was doing work on the Fed’s behalf, reducing the urgency for additional rate action even as the long end drifted well above the policy rate.
With annual US interest payments already at $1 trillion, the government cannot afford yields to spike, but the sheer scale of issuance keeps them elevated.
Beyond the $9 trillion maturing in 2025 sits a broader $40 trillion rollover challenge over coming years. Each tranche of maturing debt must be refinanced at prevailing yields, and the volume of paper the market must absorb anchors the long end well above the norms of the 2010s.
For anyone holding duration, longer-dated bonds whose prices move most when yields shift, this divergence is the defining feature of the cycle. Reading it correctly is what separates an investor who treats a rate-cut cycle as automatically bond-bullish from one who sees the rollover dynamic keeping the long end sticky regardless of what the Fed does at the front of the curve.
What investors were betting on equities, and whether those bets held up
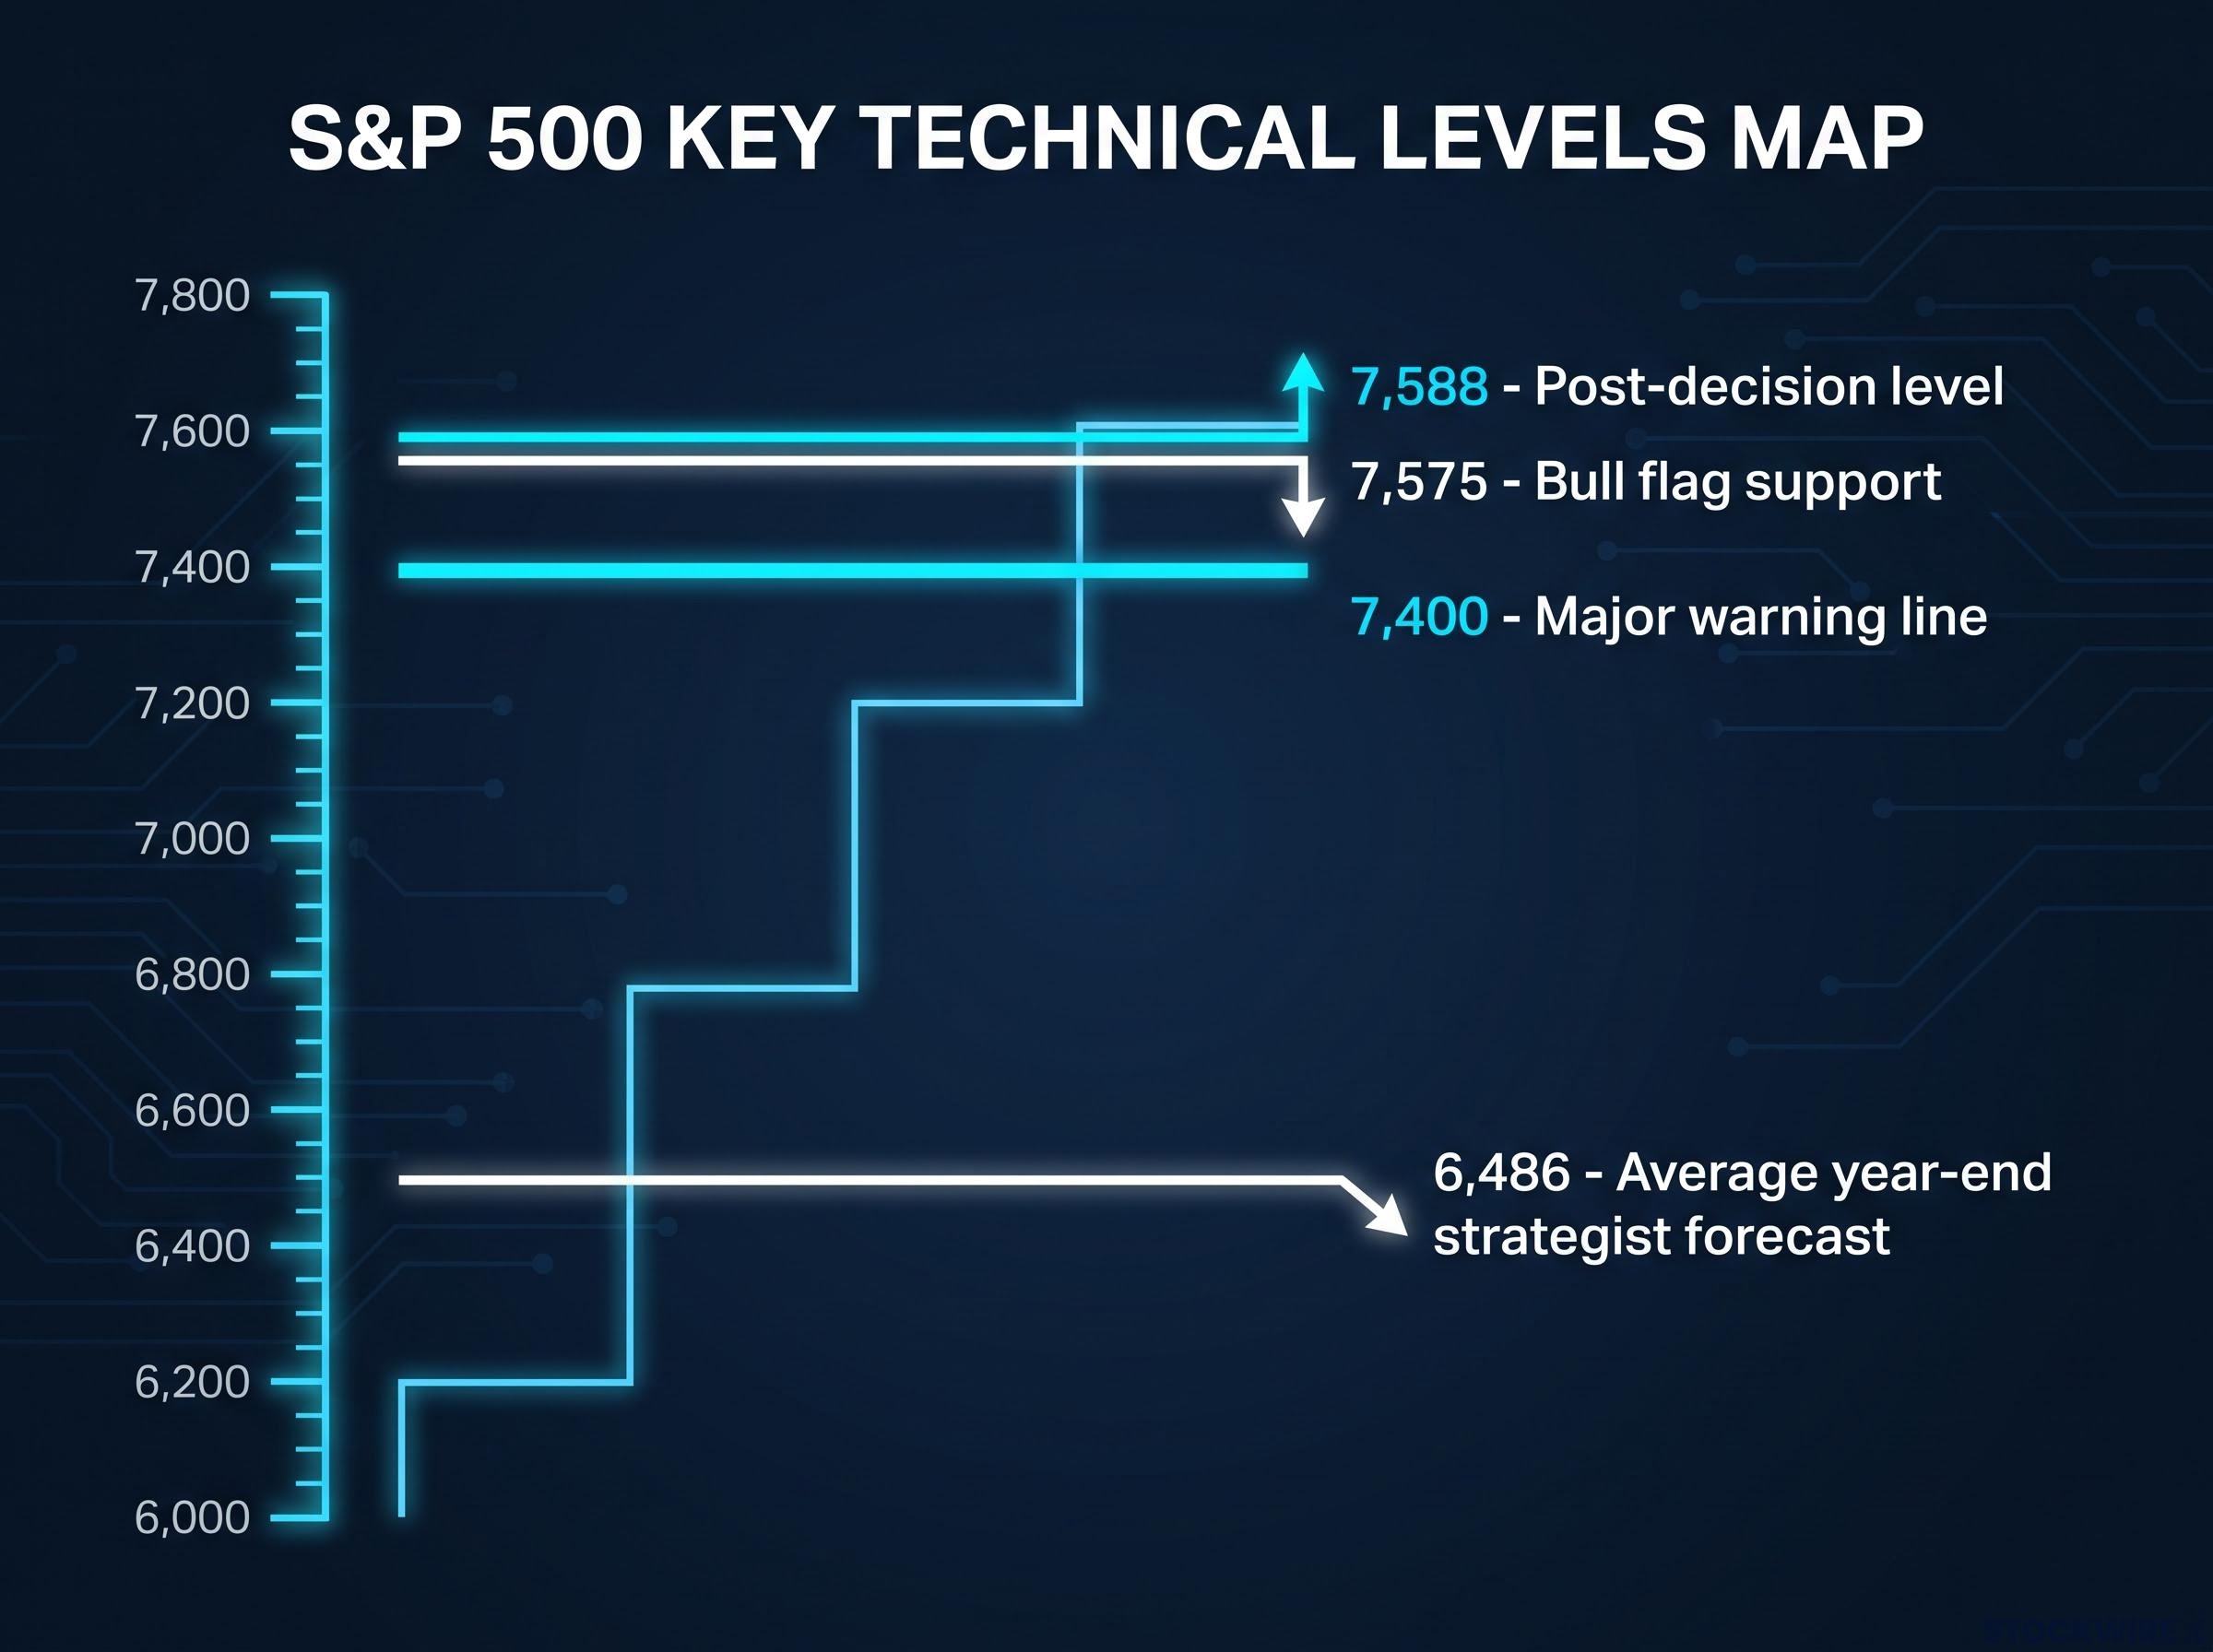
Equities entered the meeting looking nervous. The S&P 500 was trading roughly 3% below its all-time high and slipped 0.5% on 15 September 2025. Technically the picture held together: a bull flag pattern remained intact so long as support at 7,575 stayed firm, with a break below 7,400, a trend line running back to the 2021 peak, flagged as the serious warning that could open a slide toward 7,000.
After the decision, the index settled near 7,588, down 0.63% on the day but technically stable. Valuations, though, were stretched. The S&P 500 was trading nearly 3% above the average year-end strategist forecast of 6,486, meaning the market had already priced in more optimism than the strategist community was willing to underwrite.
The options market told the sharper story. Pre-meeting sentiment had skewed heavily toward bearish bets, which contrarian analysts read as bullish, since institutional money often positions against crowded retail trades.
The share of names showing inverted call skew, where out-of-the-money calls trade at a premium to at-the-money calls, jumped from 3% to 12% in a single week.
Then the resolution came. Cboe reported a record 54 million single-stock option contracts changing hands after the decision, dominated by call buying. The moment rate uncertainty cleared, institutional money moved hard toward upside exposure.
The swing from pre-decision bearish skew to post-decision call dominance is consistent with a well-documented historical pattern: equity performance across rate cycles tends to be driven more by the pace and surprise factor of policy moves than by the direction of rates alone, which is why clarity itself was enough to trigger the options reversal.
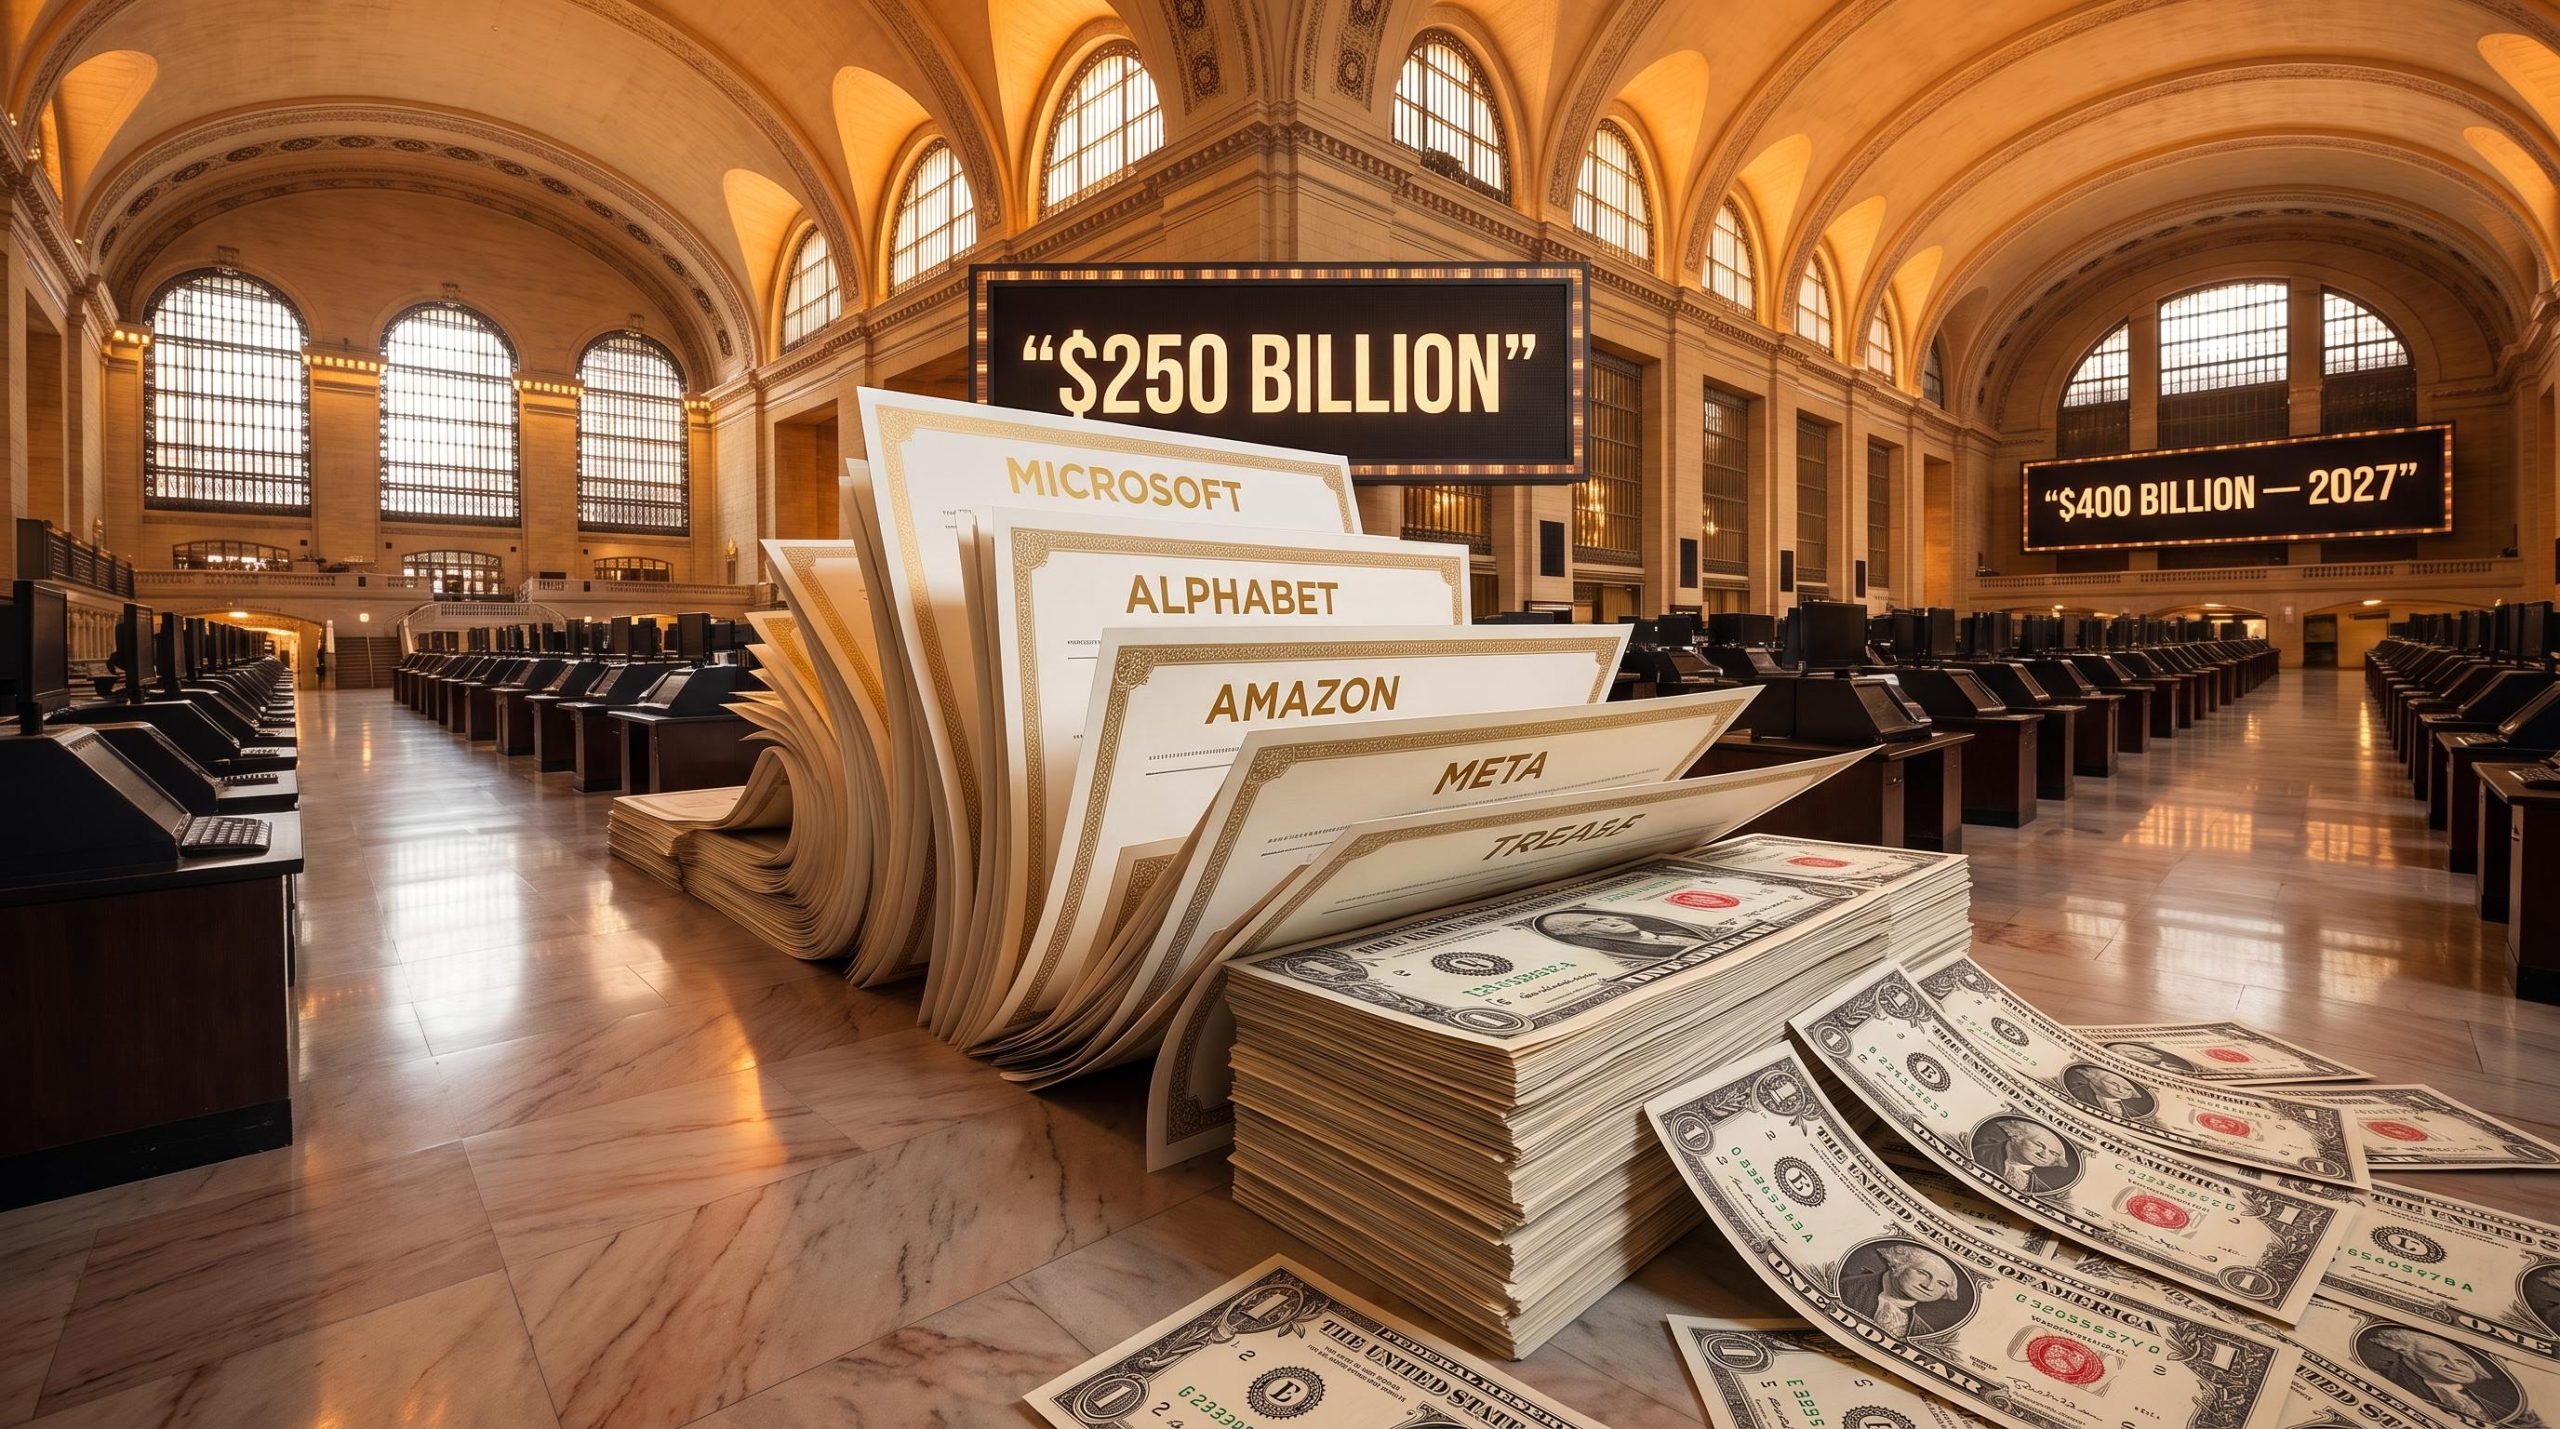
Underpinning that appetite is the capital expenditure boom around artificial intelligence, which analysts cite as the fundamental engine keeping earnings and markets supported:
- UBS estimated global AI capex at $423 billion in 2025.
- BlackRock projected $5-8 trillion in AI-related capex through 2030.
- Bloomberg estimates pegged combined major hyperscaler capex at around $200 billion in 2025, including over $90 billion in incremental spending.
Here is the read for you. The swing from pre-decision bearish skew to post-decision call dominance is a live lesson in how crowded trades unwind once uncertainty resolves. If you are weighing whether to add or trim equity exposure, understanding what drove that options reversal matters more than the index level itself, because it shows how tightly risk appetite in this market is tied to policy clarity rather than fundamentals alone.
Where major banks see rates going, and what the dispersion tells you
Ask five major banks where rates land and you get a spread, not a consensus. That spread is the point. The forecasts function less as a number to defer to and more as a map of how genuinely contested the forward path is.
| Bank | Terminal rate | Timeline |
|---|---|---|
| JPMorgan | 3.125% | One 2026 cut, one 2027 cut |
| Citigroup | 3.00%-3.25% | Serial cuts, terminal early-to-mid 2026 |
| Bank of America | 3.00%-3.25% | Two 2025 cuts, further 2026 easing |
| Deutsche Bank | 3.25%-3.50% | By end-2025, neutral ~3.375% |
| Goldman Sachs | 3.00%-3.25% | Initial 2026 easing revised into 2027 |
Goldman’s shift is instructive on its own. The bank initially targeted a 3.00%-3.25% terminal rate, then pushed its expectation for initial 2026 easing out into 2027. Even within a single institution, the forecast has moved materially, which tells you how little firm ground there is under any given timeline.
The Fed has delivered 125 basis points of cuts so far, one 50-basis-point move and three of 25 basis points, bringing the effective rate to roughly 4.09%.
Three variables that could derail the soft-landing path
The first is operational. Money-market funding frictions have begun to surface, raising expectations that the Fed will need to pause its quantitative tightening, the gradual shrinking of its balance sheet. A QT pause would ease pressure at the short end and could reshape the curve faster than any scheduled rate decision.
The second is credibility. Institutions including KfW and Scope Ratings have warned that political pressure on the Fed risks politicising monetary policy and eroding market trust. If holders of US debt begin to doubt the Fed’s independence, they demand a higher term premium, which lifts long-end yields regardless of where the policy rate sits.
The third is structural and longer-dated. The $40 trillion rollover challenge keeps refinancing costs elevated, anchoring the 10-year in a 4%-5% range, and some analysts maintain a bearish view toward 2030, projecting that today’s strong corporate profits eventually plateau and could culminate in a major correction.
The takeaway for you is that the roughly 50-basis-point spread between the most hawkish and most dovish forecasts is not noise to average away. It signals that the forward path carries far more uncertainty than the market’s pricing of a smooth glide to 3% implies, and that positioning with heavy conviction on any single terminal rate is itself a risk.
What the September decision changes, and what it does not
Pull the threads together and a clear picture emerges. The Fed cut when the market was near-certain of a hike. Bond yields drifted higher rather than simply following the policy rate down. Equity positioning flipped sharply toward optimism once uncertainty cleared. And the banks disagree by roughly 50 basis points on where rates finally settle.
Some things the September cut has settled. The direction of travel is easing, confirmed by 125 basis points of cuts already delivered. Near-term recession risk is viewed as contained relative to the acute stress of 2022. And the AI capital expenditure boom is providing a genuine fundamental underpin for corporate earnings.
Plenty remains open. The forward rate path still spans a terminal-rate range of roughly 3.00%-3.375% across the major banks, which is the live uncertainty you cannot wish away.
Rather than a verdict, carry a short watch list into the coming months:
- The long-end yield trajectory, anchored by the $40 trillion rollover challenge that keeps a return to pre-2022 norms unlikely.
- QT stress signals in money-market funding, the near-term operational variable most likely to move markets before the next FOMC meeting.
- Fed independence developments, since credibility erosion feeds directly into the term premium.
- The two S&P 500 levels worth tracking: 7,575 as support and 7,400 as the major warning.
For readers wanting a sharper framework for tracking the rollover risk, our dedicated guide to US public debt signals separates the $40 trillion gross figure from the $32 trillion investor-relevant number and identifies the auction bid-to-cover ratios and term premium movements that provide actionable early warnings.
The honest conclusion is that the soft-landing path is plausible but not assured, and the risks are specific enough to track. That framework, watching the right variables rather than reacting to the wrong ones, is what lets you resist both the reflexive optimism of a rate-cut cycle and the reflexive gloom of a high-debt world.
This article is for informational purposes only and should not be considered financial advice. Investors should conduct their own research and consult with financial professionals before making investment decisions. Past performance does not guarantee future results. Financial projections are subject to market conditions and various risk factors, and forward-looking statements are speculative and subject to change based on market developments.