The US government’s interest bill did not creep higher. It exploded. In 2022, annual debt service ran near $300 billion. By fiscal year 2025 it had reached $970 billion, and the Congressional Budget Office now projects it will cross $1.0 trillion in fiscal year 2026.
That trajectory does something most market commentary ignores: it quietly strips the Federal Reserve of the freedom people assume it has to set interest rates wherever the economy demands.
Here is the collision at the heart of the problem. A federal debt load that punishes every rate increase is arriving at the same moment as a severe global squeeze in refined fuel products. One pushes for lower rates. The other pushes prices higher. The Fed is caught between funding the government and fighting inflation, and it cannot fully do both.
This piece gives you a framework for understanding how these overlapping shocks constrain central bank options, and why that structural shift changes the strategic case for hard assets in your portfolio.
The brutal arithmetic of trillion-dollar debt service
Start with the number that policymakers cannot argue their way around. According to the CBO’s report “The Budget and Economic Outlook: 2026 to 2036”, published 11 February 2026, net interest outlays hit $970 billion in fiscal year 2025 and are projected to exceed $1.0 trillion in 2026.
This is not a distant forecast slowly maturing. It is accelerating in real time.
The CBO’s Monthly Budget Review for July 2026 shows net interest outlays rose by $117 billion, a 14% jump, in just the first ten months of fiscal year 2026, climbing from $846 billion to $963 billion versus the same period a year earlier. Debt service is not simply high. It is compounding.
The longer arc is heavier still. The CBO projects net interest climbing to $2.1 trillion by 2036, at which point it consumes nearly one-fifth of all federal spending. The Peter G. Peterson Foundation’s Monthly Interest Tracker, dated 2 July 2026, puts cumulative net interest over the coming decade at $16.2 trillion.
The CBO’s Budget and Economic Outlook projects net interest climbing to $2.1 trillion by 2036, at which point debt service consumes nearly one-fifth of all federal spending, a structural burden that narrows the fiscal space available to absorb any sustained rate-hiking cycle.
| Metric | 2022 Baseline | 2025 Actual | 2026 Projected | 2036 Projected |
|---|---|---|---|---|
| Annual net interest | ~$300B | $970B | Over $1.0T | $2.1T |
| Share of federal spending | Modest | Rising | Rising | ~One-fifth |
| Interest as % of GDP | Below average | Elevated | 3.3% | Higher still |
Now hold that against the Fed’s stated independence. Officials insist rate decisions answer only to inflation and employment, not to the Treasury’s bill. The arithmetic complicates that claim.
A 50 basis point rate increase adds roughly $50 billion to annual interest costs, pushing total debt service toward $1.2 trillion. That tells you every hike the Fed contemplates now carries an immediate fiscal penalty measured in tens of billions. It severely restricts how aggressively policymakers can defend the dollar or lean against inflation without deepening the deficit they are already struggling to fund.
The rollover dynamic is where US debt sustainability becomes acutely sensitive to rate levels: the weighted average interest rate on marketable Treasuries was already near 3.45% as of mid-2026, and every maturing low-yield security replaced at current market rates mechanically compounds the annual service bill without any new borrowing required.
When big ASX news breaks, our subscribers know first
How fiscal dominance dictates monetary policy
If you have pictured the Federal Reserve as an institution that acts freely, this section adjusts that view. The mechanism at work is called fiscal dominance, and understanding it lets you anticipate policy pivots before they are announced.
Fiscal dominance describes a situation where a government’s deficits and debt-service costs grow so large that they force the central bank to accommodate government borrowing, even at the expense of its inflation goals. When servicing the debt threatens to become unaffordable, keeping borrowing costs down quietly moves up the priority list.
The scale of the pressure is visible in one ratio. Net interest outlays equal 3.3% of GDP in 2026, well above the 50-year historical average of 2.1%. The system is carrying interest costs far heavier than its own long-run norm.
Debt service does not compete for budget space in a vacuum: mandatory spending obligations on entitlements have grown at roughly 7.5% annually against 4% revenue growth, meaning interest costs are compounding inside an already structurally stretched fiscal envelope where tax receipts cannot keep pace.
You have seen how this resolves before. The post-2008 era, with its rounds of quantitative easing, near-zero rates and swollen central bank balance sheets, showed how policymakers manage heavy debt loads: they suppress yields and support asset prices rather than let borrowing costs run free.
Here is the typical progression toward a pivot under fiscal dominance:
- Inflation slows but stays stubbornly above target.
- Real debt-service costs become fiscally and politically uncomfortable as interest rivals major spending programmes.
- The Fed pauses further hikes and starts talking up data-dependence and balance-sheet flexibility.
- As growth or markets wobble, the Fed cuts or introduces yield-friendly tools, easing conditions even with inflation unresolved.
Sprott research, in commentary dated 15 September 2026, labels this fourth stage a pivot to “QE-lite,” explicitly citing fiscal dominance and rising global debt as central drivers of gold’s recent strength.
The counterargument deserves a fair hearing. Chair Jerome Powell and other Fed officials have repeatedly stressed that the dual mandate, not the fiscal position, drives their decisions. Yet markets are increasingly pricing in the pivot anyway.
What you need to recognise is the shift in the central bank’s unwritten priorities. When debt service climbs this high, the effective mandate tilts from purely fighting inflation toward preventing Treasury market dysfunction. That change rewrites the rules for every asset class you hold.
A refined products squeeze removes the Fed’s escape route
The Fed’s one remaining escape from this trap would be a world where inflation simply fades on its own. The global fuel market is closing that exit.
Refined product supply is tightening for structural reasons, not passing ones. According to S&P Global Energy, reported via Oil & Gas Journal on 11 August 2026, global refinery runs are estimated at 7.5 million barrels per day below July 2025 levels, the product of years of underinvestment now colliding with geopolitical shocks.
Several forces are amplifying the crunch:
- War-induced refinery outages across the Middle East and Russia.
- Ukrainian drone strikes repeatedly hitting Russian refinery infrastructure.
- Disruption around the Strait of Hormuz, choking crude deliveries to operational refineries.
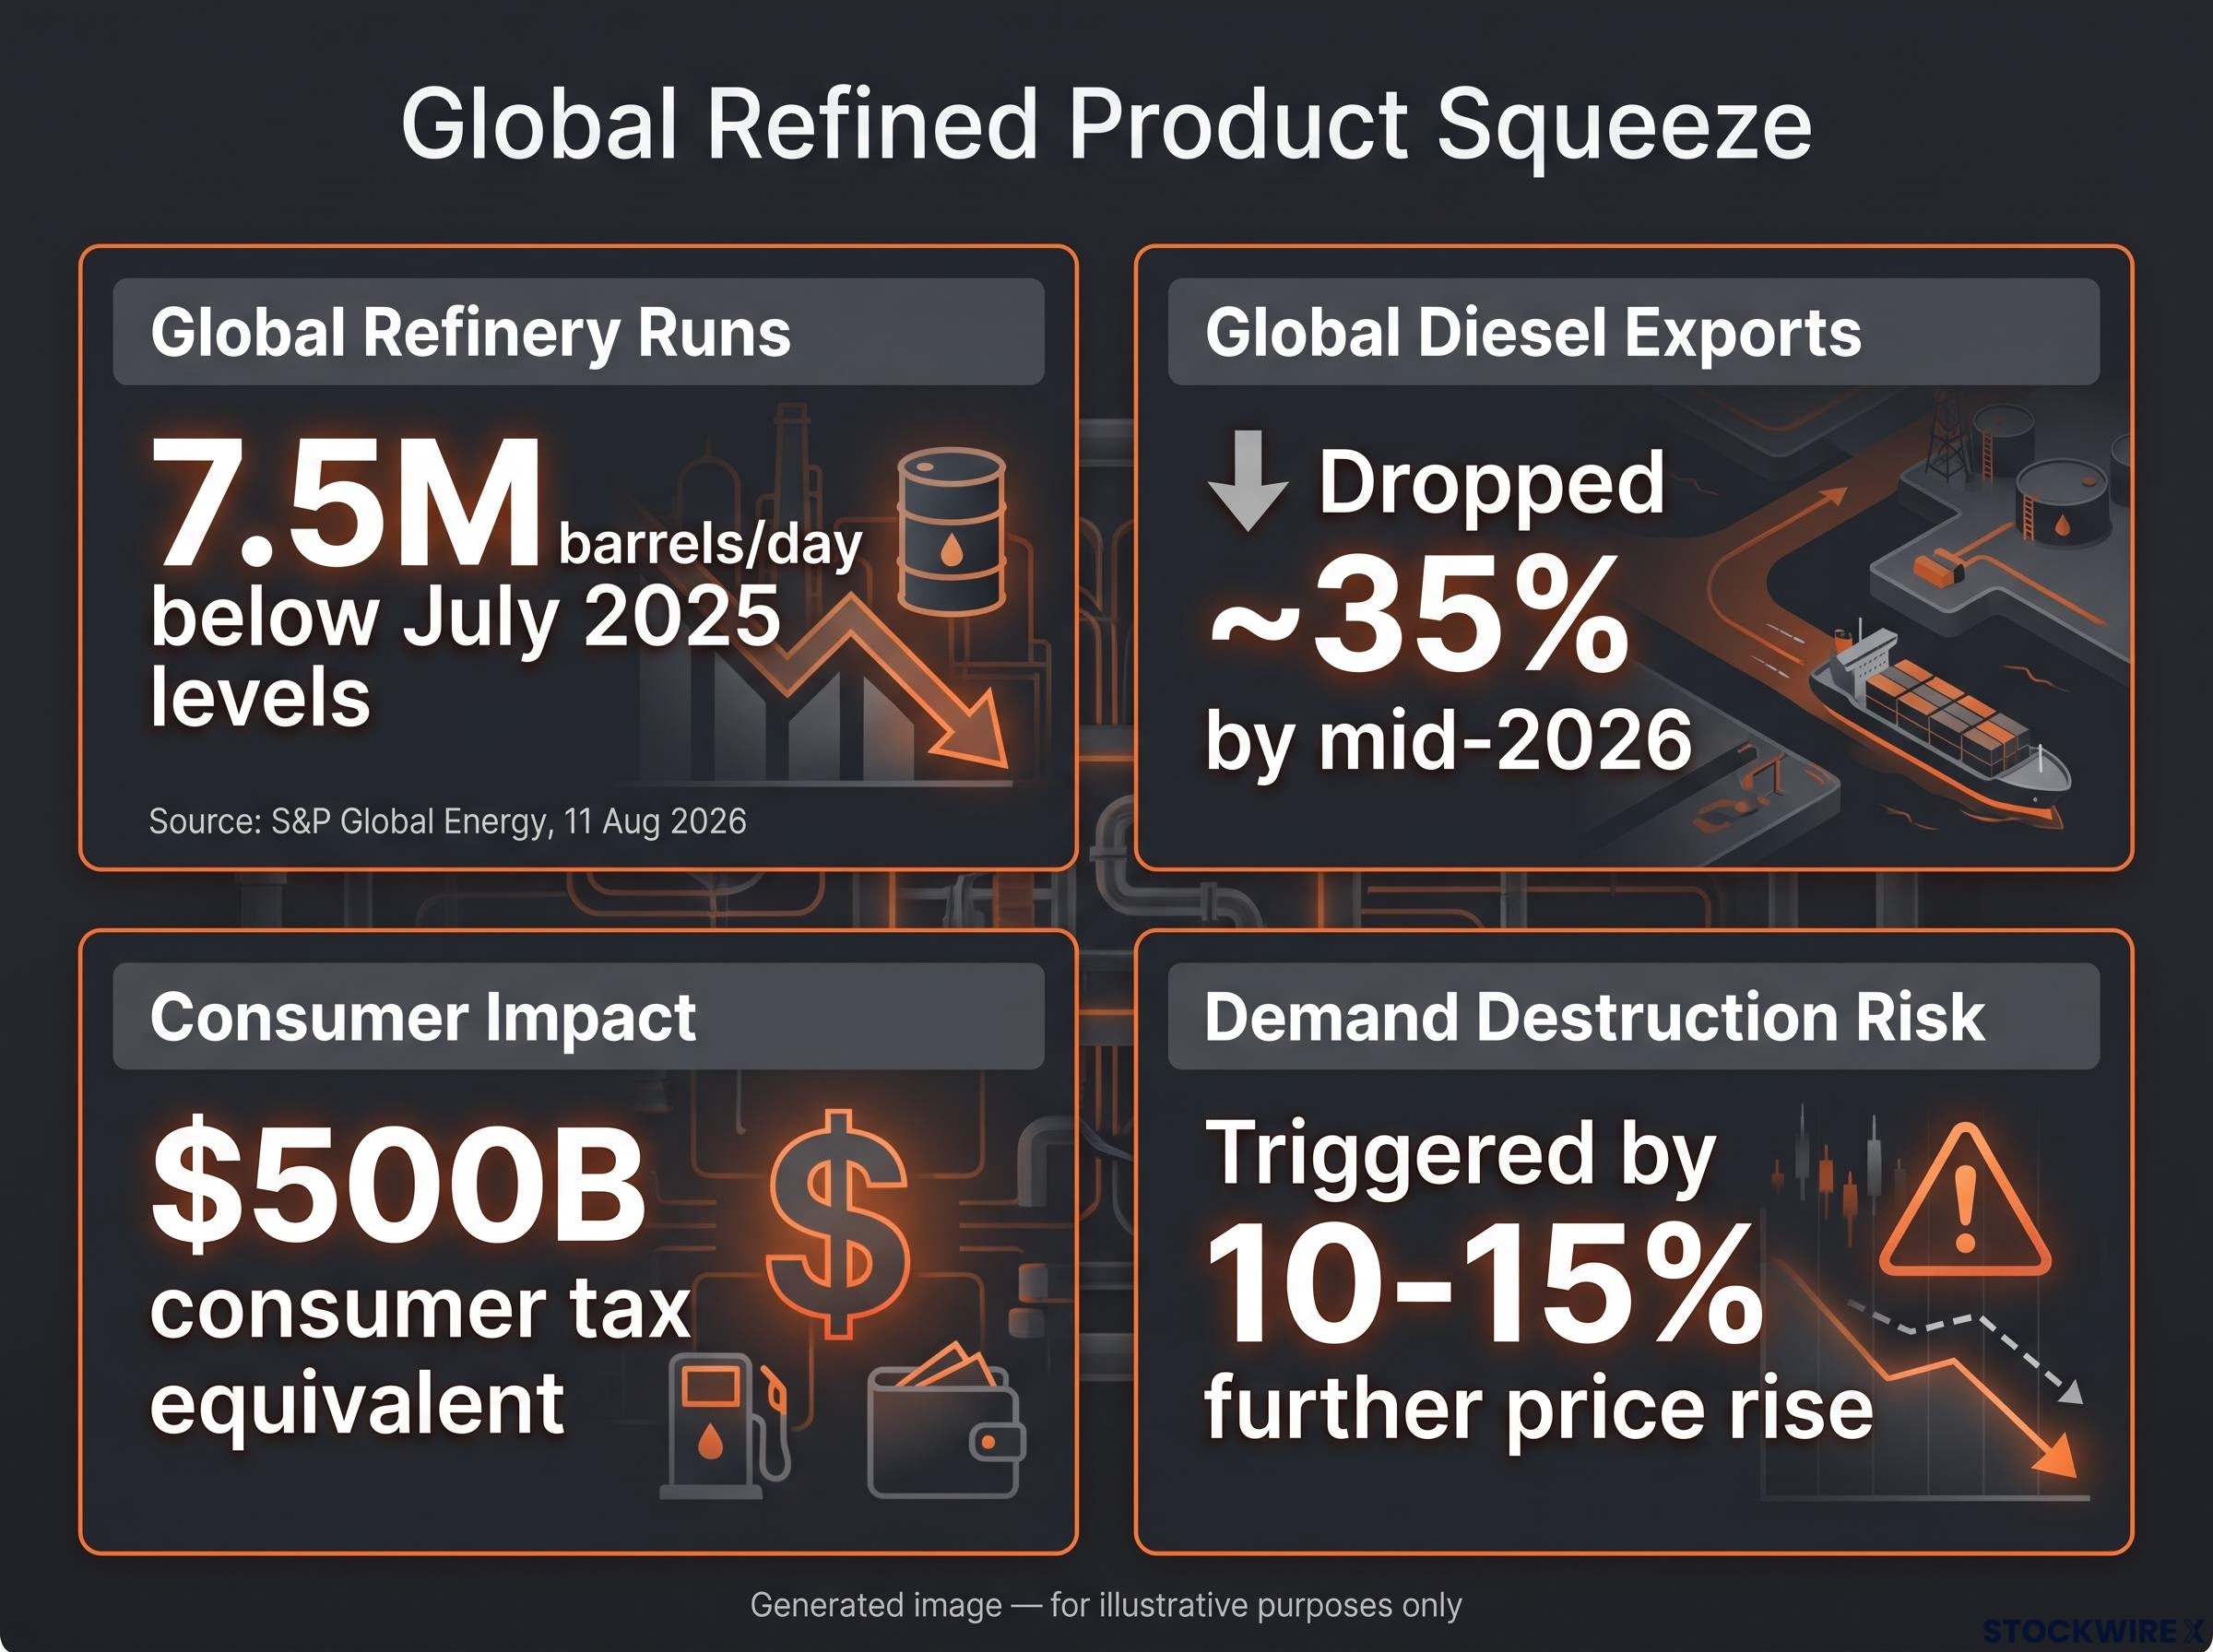
The damage cascades across the product barrel. Refiners squeezed by war and disrupted tanker traffic are prioritising high-value diesel, which starves fuel oil and other products of supply. Global diesel exports still dropped roughly 35% by mid-2026, and Rystad Energy analyst Valerie Panopio told Reuters on 7 September 2026 that fuel oil markets would stay “critically tight” through the third quarter.
Goldman Sachs, in a note dated 30 July 2026, assessed that global refining activity sits at its lowest level for this time of year since the 2020 pandemic, with diesel “at the epicenter” of the crunch.
Not every region is straining equally. The US Gulf Coast, PADD 3, continues to serve as a vital supply hub, with jet fuel stocks reported to average 13.7 million barrels per week in 2025. That resilience buffers US markets but does not resolve the global shortfall.
Now connect this back to the policy trap. Higher energy costs act as a consumer tax equivalent estimated at $500 billion, a burden heavy enough to threaten recession while simultaneously keeping headline inflation elevated. Because this inflation stems from physical refinery constraints rather than hot consumer demand, you should prepare for a scenario where interest rate tools are largely powerless to bring prices down. Raising rates cannot build a refinery.
The global refining shortfall is not self-correcting through price alone: with the Strait of Hormuz closure stranding an estimated 10-14 million barrels per day against OPEC spare capacity of only roughly 0.5 million barrels per day, the supply arithmetic rules out any near-term market rebalancing driven by alternative supply rather than forced demand collapse.
The risk of forced demand destruction
Commodity traders increasingly view demand destruction, prices climbing high enough to force consumption lower, as the only near-term mechanism capable of balancing the market. Original source analysis suggested a further 10-15% rise in refined product prices could be enough to trigger it.
The recessionary signals are already surfacing. Fuel cost pressure is squeezing transportation operators and consumers, with European stations reported running low on diesel and some US airlines potentially trimming flight capacity where fuel costs bite hardest.
Translating the macro trap into a hard asset thesis
Put the two forces together and the investment logic writes itself. A central bank that cannot hike aggressively, facing inflation it cannot tame with rates, is the exact environment in which hard assets historically outperform.
The price action is already moving in step. Sprott’s 15 September 2026 commentary notes gold reached its highest monthly close in November 2025, attributing the strength directly to fiscal dominance and the anticipated QE-lite pivot. Original source projections from the Bear Traps Report in September 2025 mapped gold toward a $6,500 threshold and silver beyond its prior highs over a one-and-a-half to three-year horizon.
Structural gold demand has been reinforced by a buyer base that did not exist a decade ago: central bank net purchases exceeded 1,000 tonnes annually after the 2022 freezing of Russian reserves, while Asian-listed gold ETFs reached roughly 30% of global gold ETF market capitalisation, creating a demand floor that operates independently of Western investor sentiment.
The 1970s offer the historical template. Sustained stagflation, where energy shocks kept prices high while growth stalled, was a period in which precious metals performed strongly as monetary anchors held their value against a debasing currency.
The two metals play distinct roles. Gold is the purer monetary safe-haven, a store of value when confidence in paper money and sovereign balance sheets erodes. Silver carries a dual identity: part monetary hedge, part industrial input, giving it more upside in a reflationary run but more vulnerability if growth collapses.
The core case is straightforward. When central banks are forced to choose between capping government borrowing costs and fighting inflation, you want exposure to assets that cannot be printed into existence to solve a sovereign debt problem.
Counterarguments and opportunity costs
The thesis is not without holes, and honest allocation weighs them. The most serious headwind is real yields. Gold and silver pay no income, so if the Fed keeps real interest rates positive even while cutting nominal rates, the opportunity cost of holding metals rises and can cap their gains despite the debt backdrop.
A second risk is that markets have already priced the pivot in. After a move to record monthly closes, some strategists argue the fiscal narrative is largely embedded in current prices, leaving limited upside absent a fresh shock.
Silver carries a specific vulnerability. Its heavy industrial demand means a severe recession could impair a meaningful slice of its consumption, pulling prices down even while the monetary case for precious metals stays intact.
This article is for informational purposes only and should not be considered financial advice. Investors should conduct their own research and consult with financial professionals before making investment decisions. Past performance does not guarantee future results, and these projections are speculative and subject to change based on market developments.
Navigating a cycle defined by constraints
The tension defining this cycle is simple to state and hard to escape. An interest bill approaching $1 trillion and climbing collides with a fuel market structurally short of supply, and the Federal Reserve sits in the middle with fewer good options than its rhetoric suggests.
The practical takeaway is that Fed policy over the next 12 to 18 months will be shaped more by fiscal arithmetic and physical supply bottlenecks than by the demand-side models that dominated the last cycle. Expect the pull toward easier conditions to persist even where inflation stays uncomfortable, because the alternative is a debt-service burden the Treasury struggles to fund.
For investors, that argues for structuring expectations around financial repression rather than clean disinflation, with hard assets positioned as a hedge against currency debasement while respecting the real-yield and recession risks that could interrupt the run.
This is not a passing phase waiting to normalise. The debt is structural, the energy underinvestment is structural, and the constraints on monetary policy are now a fixed feature of the regime rather than a temporary one.