The Bank of Japan raised interest rates to their highest level in 31 years last week, and the yen promptly fell. That is not a typo, and it is not a market malfunction.
It is one of the most instructive patterns in currency trading, and understanding it is the key to reading almost any central bank decision. On 18 September 2026, the BoJ, the US Federal Reserve holding at 3.75-4.00%, and a US Dollar Index (DXY) climbing toward the 101.00 mark all pointed in the same direction: dollar strength, yen weakness, and a currency market where the intuitive reading is often the wrong one.
Any forex market analysis worth reading has to explain why. After this, you will have a working model for how a rate hike can weaken a currency, what the widening US-Japan rate differential means for the yen and for FX pricing more broadly, and where the genuine risks to the current dollar bull case sit. Currency risk is no longer a background variable for internationally exposed investors. It is a primary performance driver, and the mechanics below are how you keep ahead of it.
Why the BoJ’s rate hike sent the yen lower, not higher
The BoJ lifted its short-term policy rate from 1.00% to 1.25% on 18 September 2026, approved by a 7-2 vote, taking Japanese borrowing costs to their highest point in three decades. By any conventional reading, a rate hike should attract capital and lift the currency.
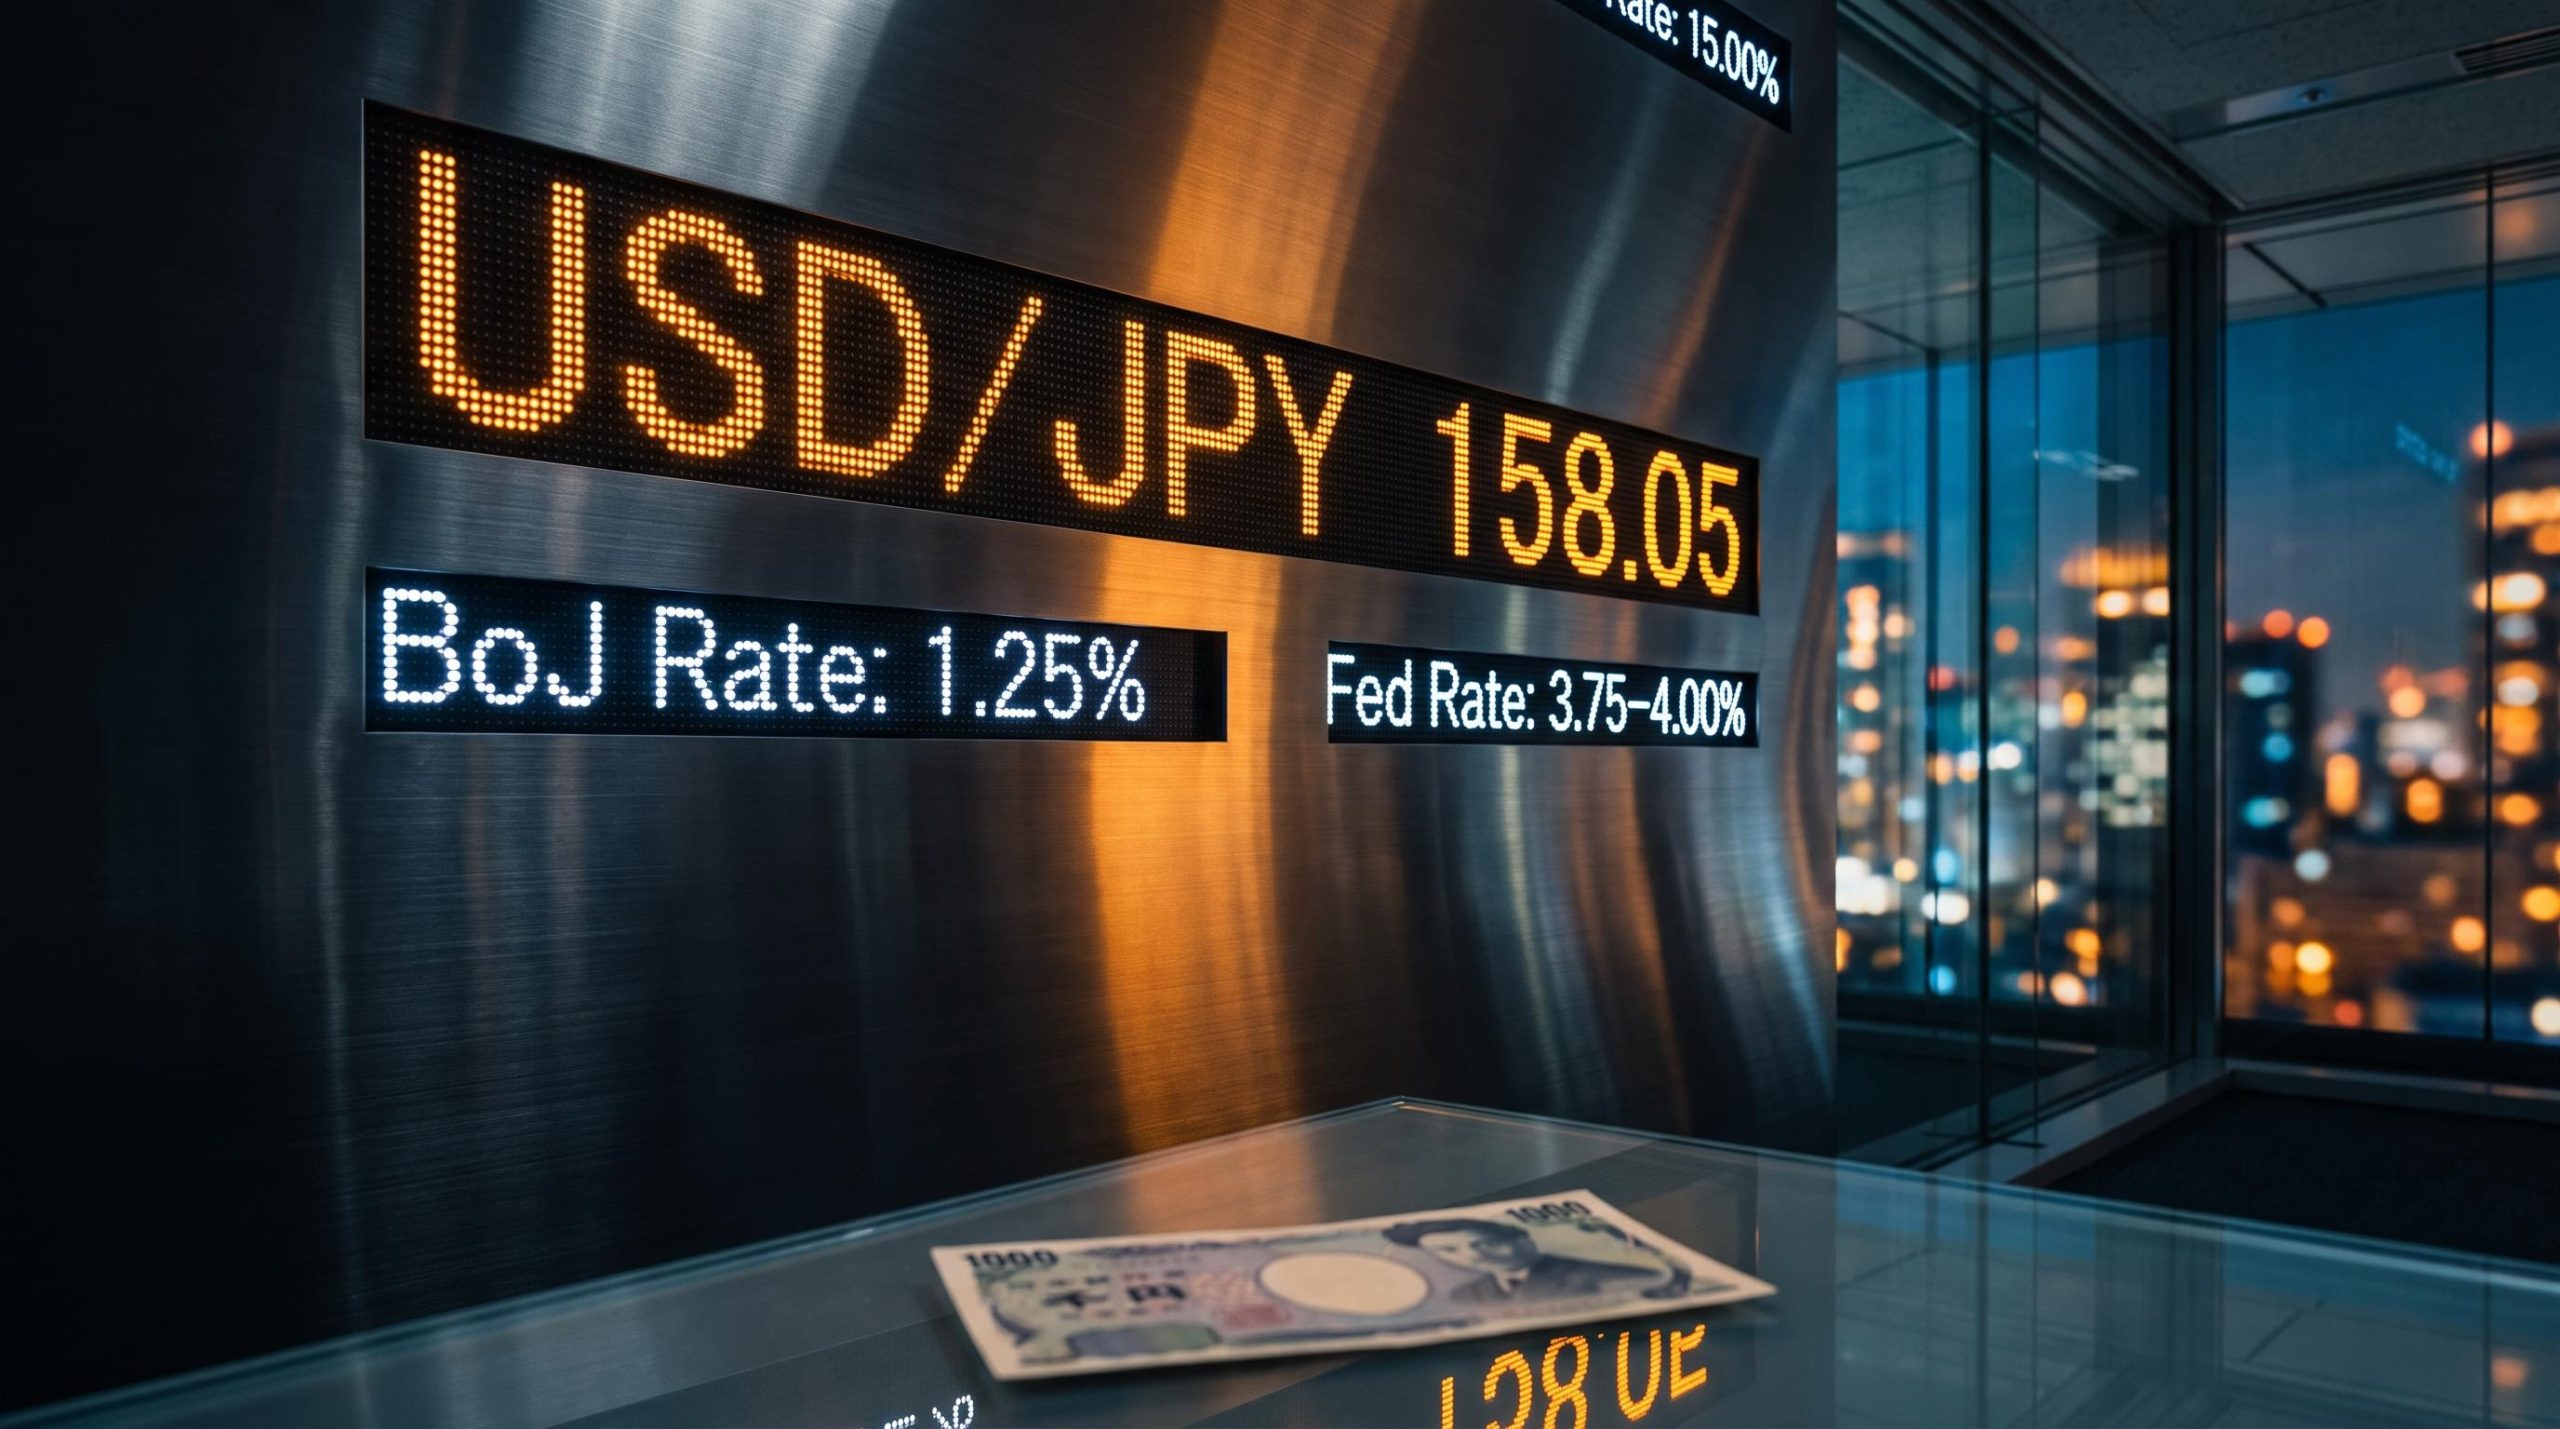
Instead, according to Reuters, USD/JPY rose as much as 1.3% to a two-week high of 158.05 yen in the hours after the announcement. The yen went on to post its worst weekly performance since October 2025, per PrimeXBT. A hawkish move by BoJ standards produced a decisively weaker currency.
The intuitive failure here is rooted in how central bank rate mechanics actually transmit to currency markets: it is the gap between what was expected and what was delivered, not the rate level itself, that drives the sharpest repricing in currencies, bonds, and FX pairs.
The two dissenting votes are central to why. As Reuters noted, they raised doubt about the likelihood of further hikes, and that doubt is what the market actually traded on.
EBC’s analysis found that markets interpreted the decision and communication as “less hawkish than feared,” allowing USD/JPY to climb above 157.
The lesson for reading any central bank is direct. The rate change itself is secondary to what the market believes comes next. A hike delivered with cautious forward guidance is not a bullish signal for the hiking currency, and the composition of the vote can matter as much as the headline decision.
The “buy the rumour, sell the fact” mechanism in practice
This is where the sequence of price action tells the story. The hike had been widely forecast for weeks, so it was already priced into the yen before the announcement arrived.
According to Investing.com, USD/JPY first dipped from around 156.19 to 155.90 in the immediate aftermath, the brief flicker of a textbook yen rally. Then it reversed and climbed toward 157.20 as traders digested the cautious guidance and the split vote.
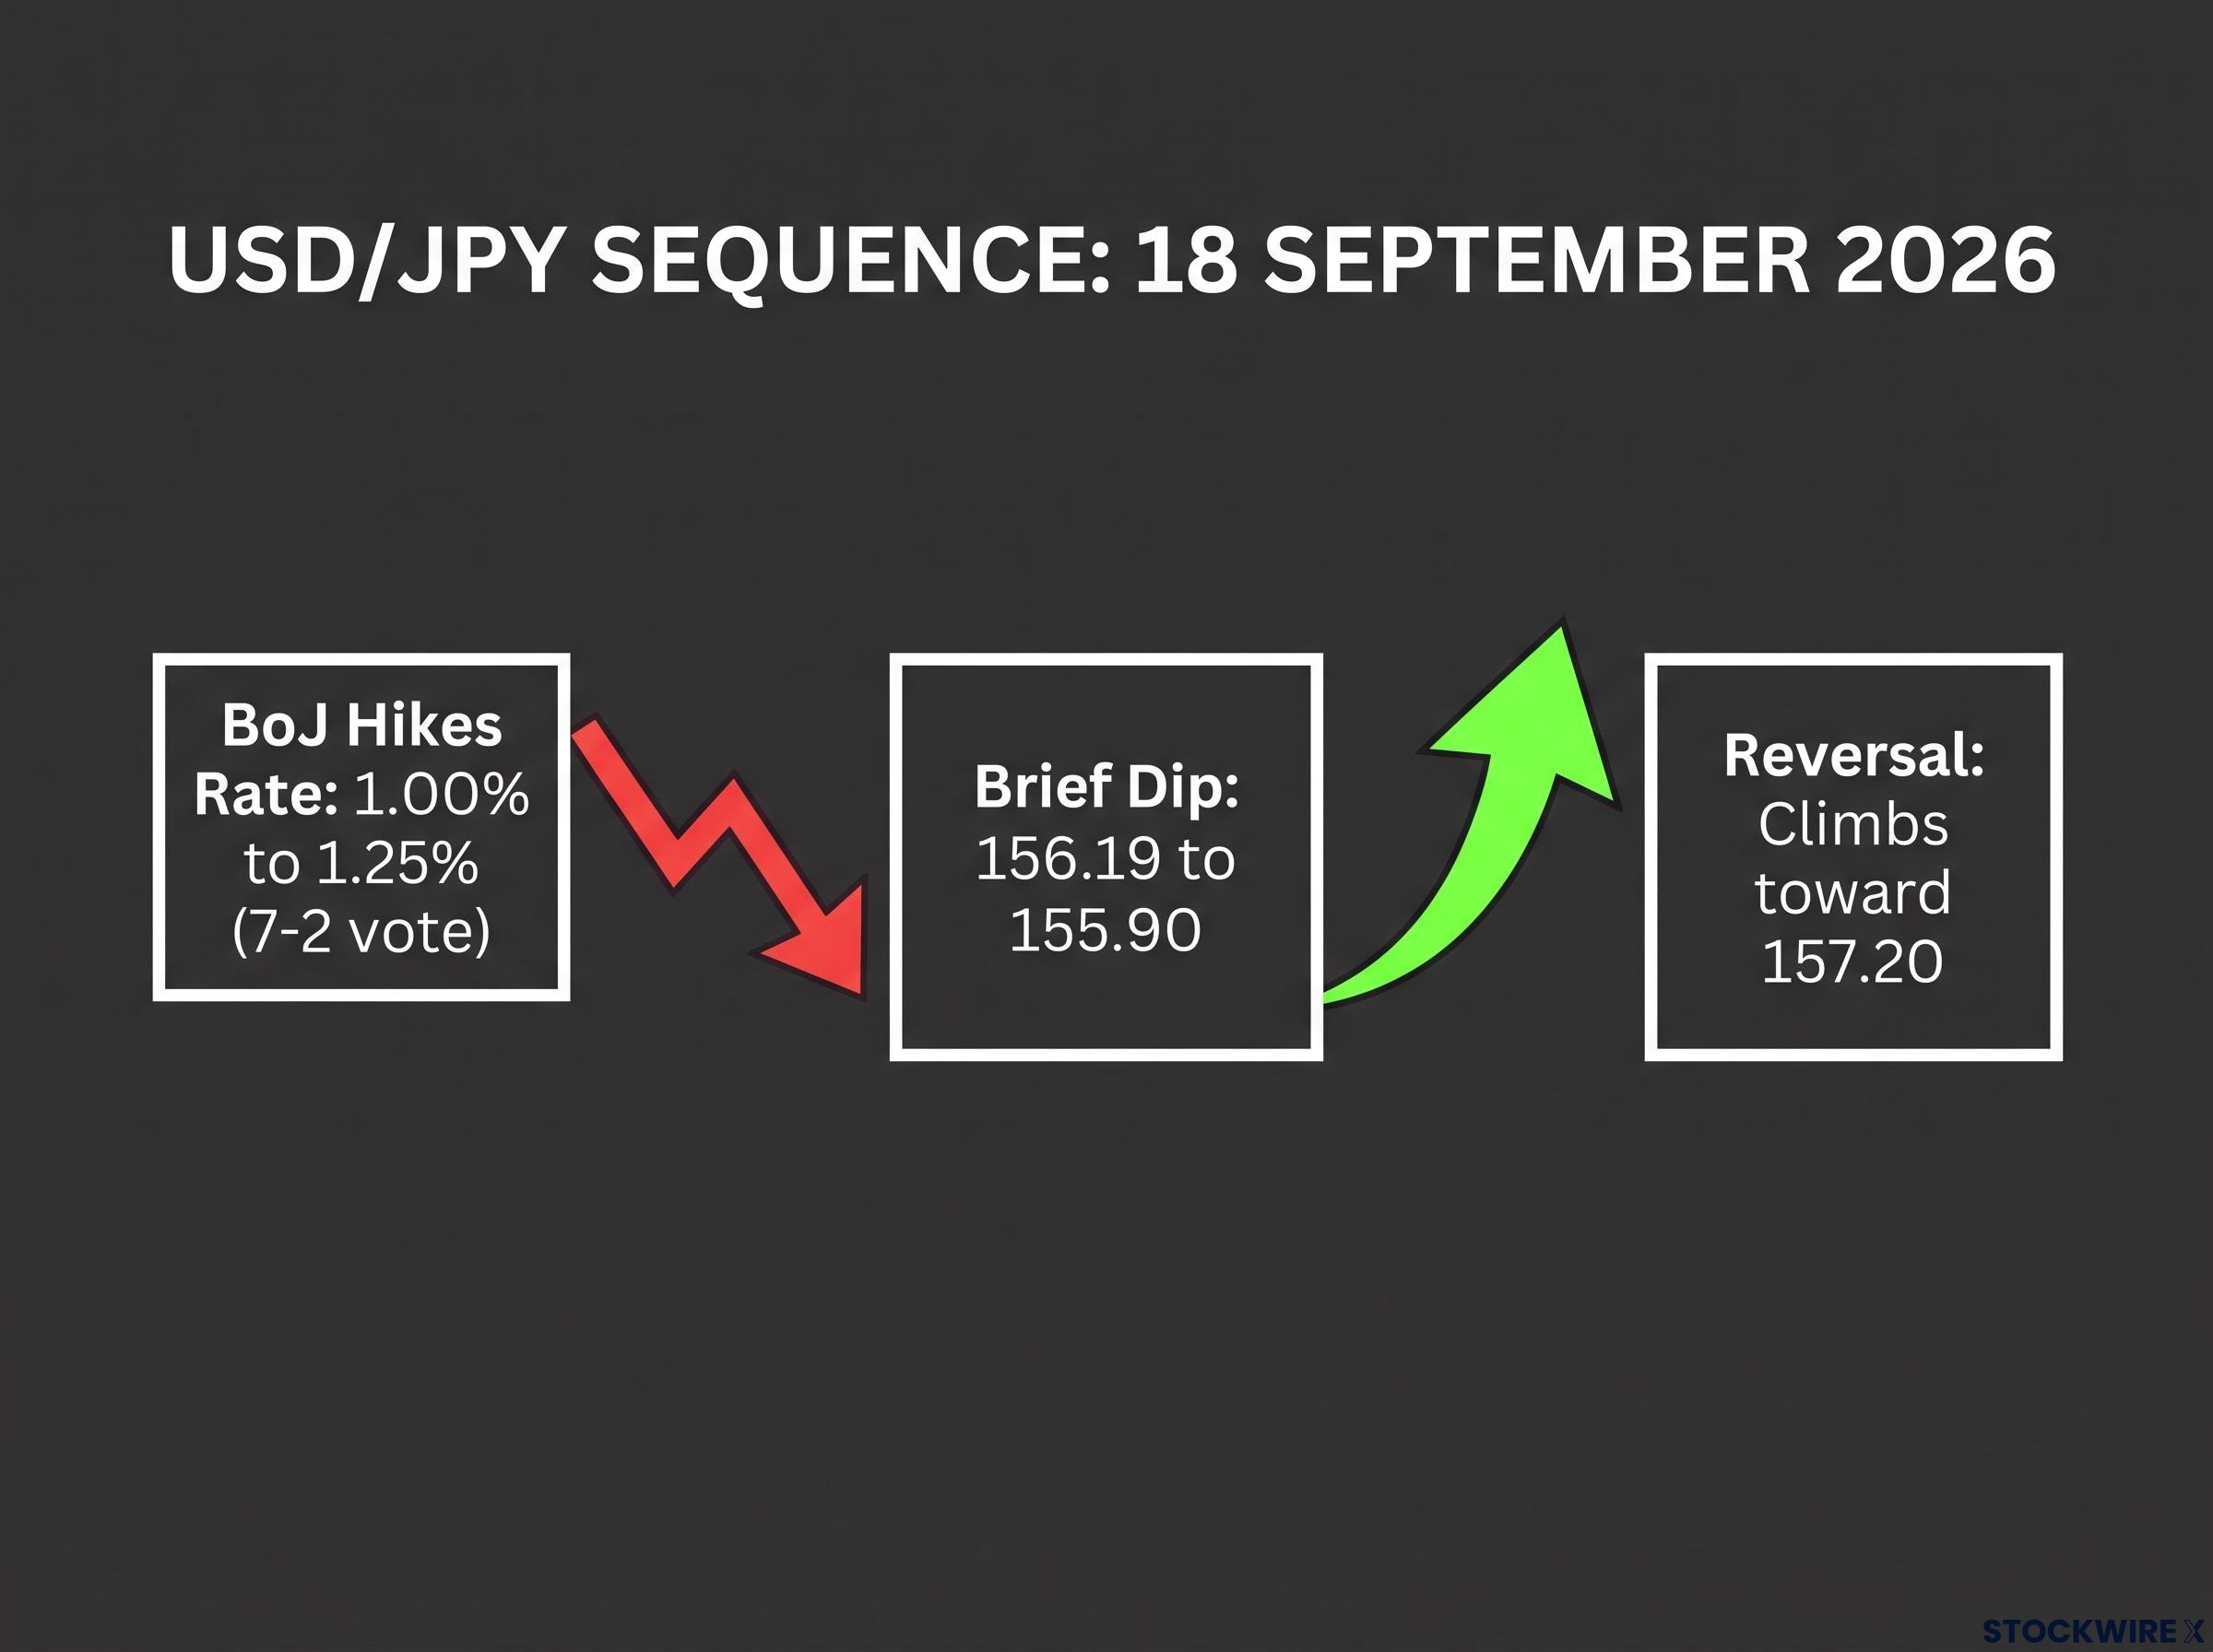
That reversal is the mechanism at work. When a hike is fully anticipated and the onward path looks uncertain, markets reduce their expectations for further tightening. Japanese yields stay relatively low, the carry trade (borrowing in low-yielding yen to buy higher-yielding assets elsewhere) keeps its appeal, and the currency that just raised rates ends up drifting lower. Across 18-21 September 2026, USD/JPY traded between roughly 155.9 and 158.05, biased firmly toward continued yen weakness.
When big ASX news breaks, our subscribers know first
The US-Japan rate differential and what it means for USD/JPY’s trajectory
Beneath the day-to-day turbulence sits a single structural force: the gap between US and Japanese interest rates. The BoJ now sits at 1.25%, while the Fed holds at 3.75-4.00%, a differential of more than 250 basis points.
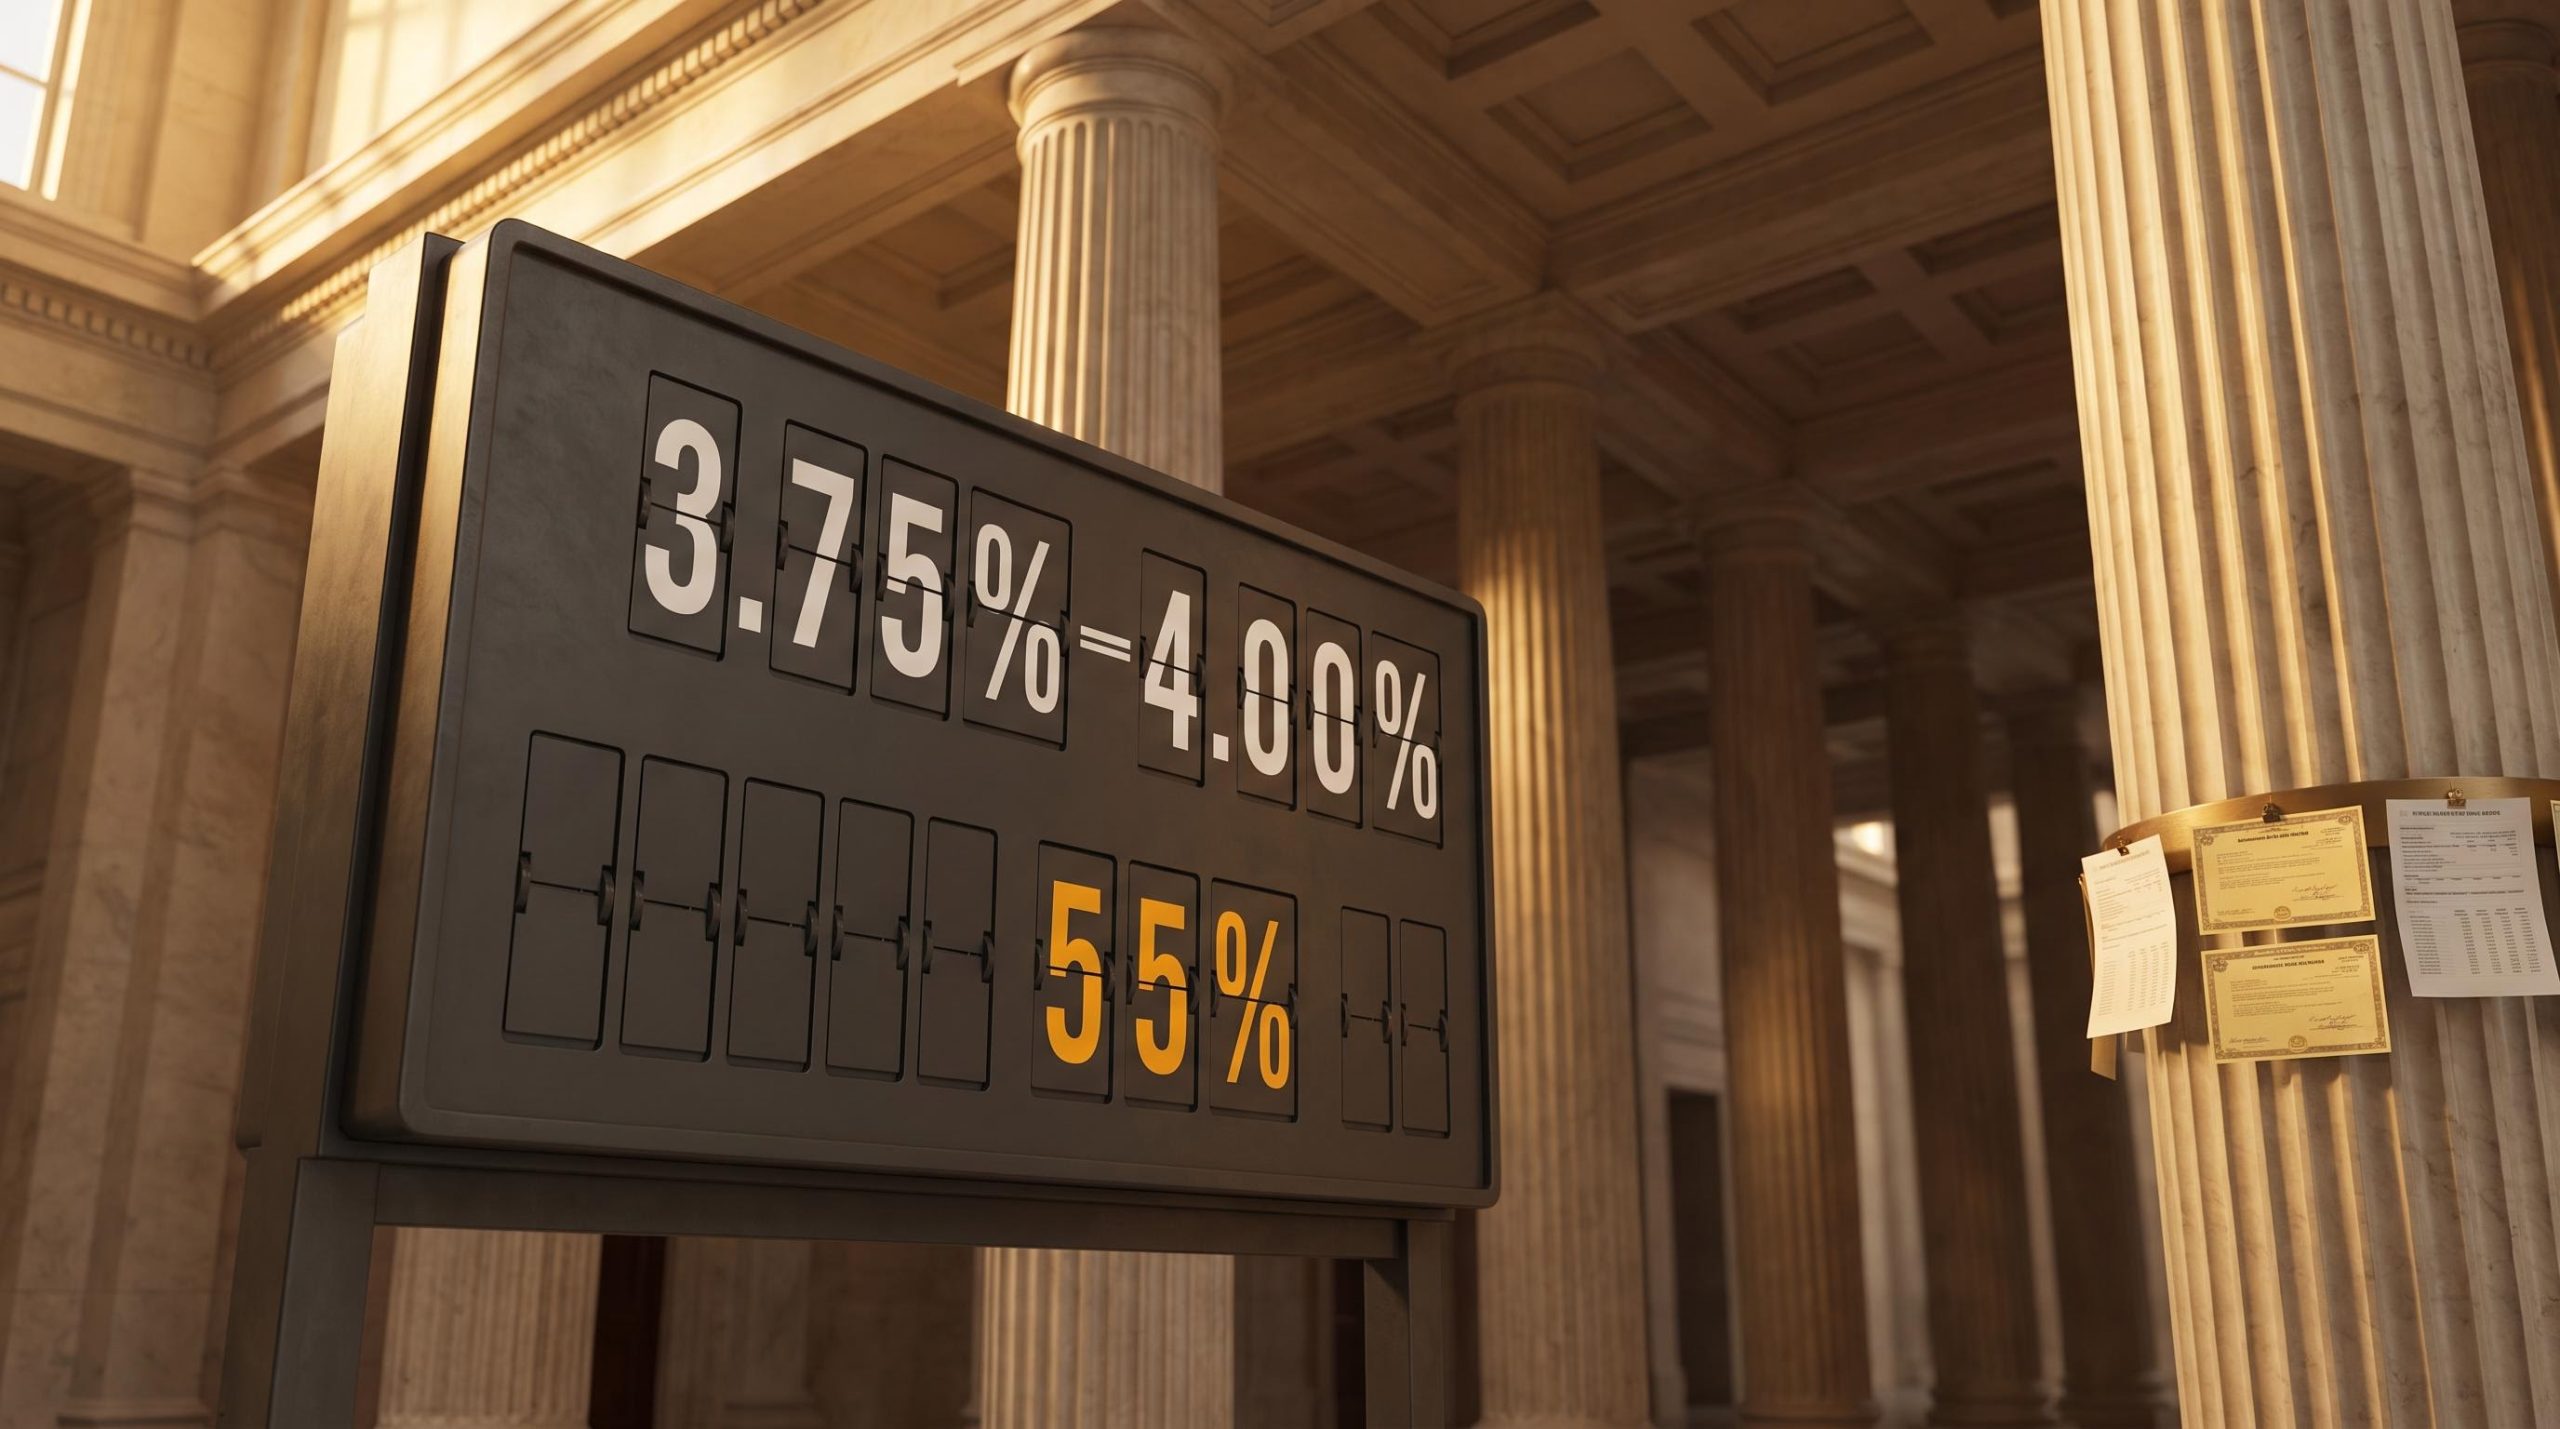
The Fed’s September 2026 rate decision confirmed the new Federal Funds Rate target range at 3.75-4.00%, locking in the interest rate gap that underpins the carry trade dynamic and keeps structurally cheaper yen borrowing economically rational for global investors.
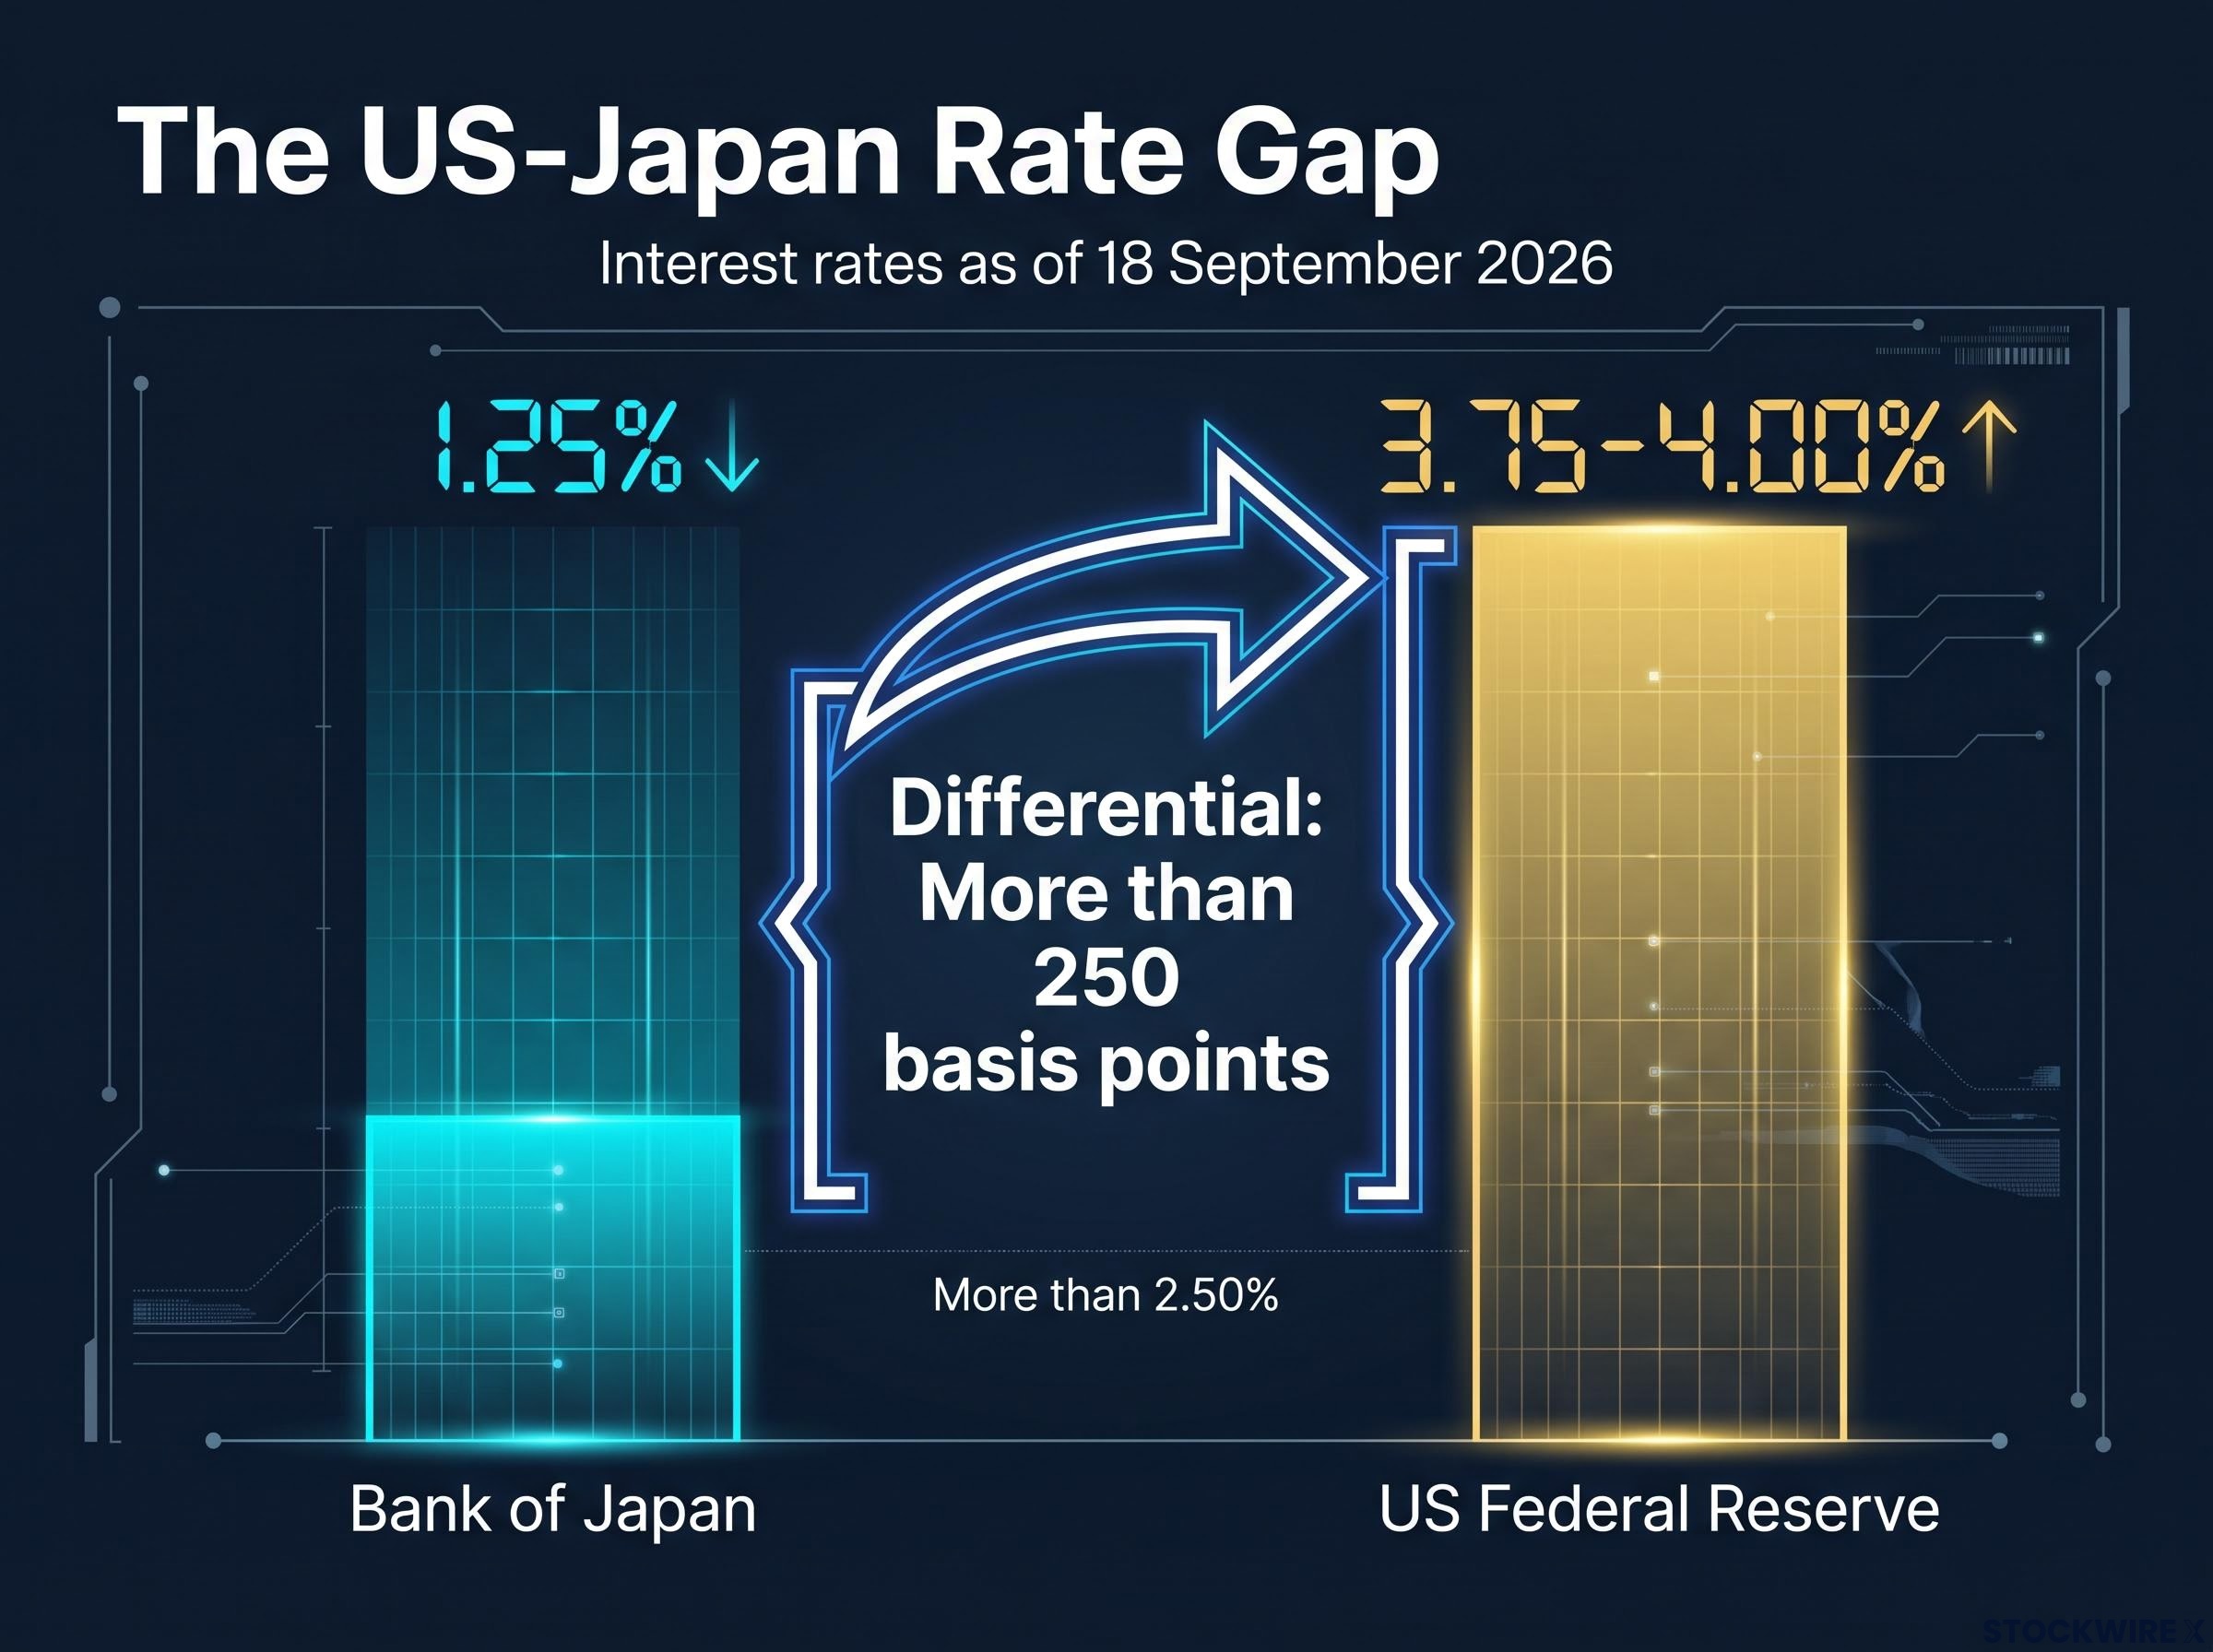
That gap is the anchor for sustained yen pressure. PrimeXBT frames the dynamic as the Fed re-entering a tightening phase while the BoJ only slowly exits ultra-low rates. For as long as it persists, holding dollar-denominated assets pays you meaningfully more than holding yen, and the carry trade that funds itself in cheap yen remains economically attractive.
The medium-term outlook reflects that. RoboForex, in its 21 September 2026 forecast, put USD/JPY’s target at 159.17 with upward momentum intact, working from a spot level of 156.84. TradingNews has floated a broadly similar 159-160 projection, though that figure remains unverified in the research and should be treated as directional rather than firm.
Here is where the trade turns asymmetric. PrimeXBT reported that the BoJ conducted a rate check, contacting market participants to gauge FX conditions, a step widely read as a potential prelude to intervention. Prior intervention zones sit near the 158-160 range, precisely where the technical targets are heading.
| Central Bank | Current Rate | USD/JPY Implication | Key Risk |
|---|---|---|---|
| Bank of Japan | 1.25% | Rate too low to close the gap; yen stays pressured | Intervention near 158-160; faster-than-expected tightening |
| US Federal Reserve | 3.75-4.00% | Sustains carry trade; supports USD/JPY upside | Dovish pivot or pause removes the anchor |
| Current spot: 156.84 (21 Sep 2026) | RoboForex target: 159.17 | ||
So the read for anyone holding JPY-denominated assets is twofold. The differential tells you the carry trade is structurally alive and the upside in USD/JPY is real. The intervention threat tells you that upside is increasingly bounded, a ceiling that can drop without warning rather than erode gradually. The consensus from PrimeXBT and EBC is unambiguous: without more aggressive BoJ action, the yen stays under pressure, but the closer USD/JPY climbs toward those historic intervention zones, the more the trade becomes a policy-risk gamble rather than a pure yield play.
How dollar dominance ripples across AUD/USD and USD/CAD
The systemic context for all of this is a dollar carried higher by the Fed. Per PrimeXBT, the DXY posted a 1.1% weekly gain to 100.22 on 18 September 2026, its best weekly showing since mid-June. When the dollar has that kind of momentum, individual currency pairs stop trading on their own local stories.
The DXY breakout above 100 was not a single-factor event: the unanimous Fed hike to 3.75%-4.00%, Middle East geopolitical risk layering safe-haven demand on top of yield differentials, and a clean technical breakout all converged in the same week to produce the dollar’s strongest showing since mid-June.
Consider the snapshot across the three that matter here:
- DXY: up 1.1% to 100.22 on the week, driven by the Fed’s move to 3.75-4.00% (PrimeXBT)
- AUD/USD: testing the 0.7100 threshold in the Asian session, weighed down by dollar strength and soft domestic data (FXStreet)
- USD/CAD: near 1.4090, up 0.21% on the day, even with crude oil above $90 per barrel (FXStreet)
That last data point is the one that should reframe how you think about pairs. Crude above $90 is normally a tailwind for the Canadian dollar. It was not enough.
What commodity-linked currencies tell us about dollar momentum
The Australian and Canadian dollars are commodity-linked currencies, meaning their value tends to track the prices of the raw materials each country exports, iron ore and coal for Australia, oil for Canada. When commodity prices rise, these currencies usually get some insulation against a strengthening dollar.
In this instance, the insulation failed. Higher crude did nothing to lift the loonie against a Fed-powered dollar, and USD/CAD still ticked up 0.21% on the day. The dollar’s structural momentum simply overrode the commodity signal.
The pairs did not move identically, though, and that matters. Mitrade’s directional data from BoJ decision day showed the dollar down 0.20% against the Aussie but up 0.10% against the loonie, a small divergence, but a real one. It tells you that commodity currencies still respond idiosyncratically and reward pair-specific analysis. The broader takeaway for your risk assessment is blunter: analysing any single pair without accounting for the dollar’s structural pull gives you an incomplete, and potentially misleading, picture of where the real risk lies.
What currency market divergence means for international investors
Everything above translates into portfolio-level consequences, and they land differently depending on what you hold. Three groups feel this environment most directly:
- Holders of JPY-denominated assets: Japanese exporters gain as weak-yen overseas revenue converts into more yen, while importers and domestic-demand firms absorb higher input costs, particularly energy. Bondholders now face both currency risk and the prospect of rising local rates eroding valuations.
- Investors in AUD and CAD markets: a sustained dollar rally drags on non-USD returns once translated back into a USD base, a drag that domestic fundamentals or commodity prices alone will not reveal.
- Global bond portfolio managers: US Treasuries look relatively attractive at a 3.75-4.00% funds rate against Japanese Government Bonds anchored to a 1.25% policy rate, reshaping carry and hedging calculations across the book.
For Japanese equity investors specifically, the picture splits cleanly. Yen weakness flatters the exporters and squeezes the importers, so treating “Japanese equities” as a single directional bet on the currency misreads the exposure entirely.
Then there is the cost of protecting against all of it.
Rising FX volatility erodes the yield pickup you earn from international diversification. In a high-volatility carry-and-rates regime, hedging costs climb precisely when you most want the hedge, and the yield advantage that justified the foreign exposure can be quietly consumed by the cost of insuring it.
The yen’s worst week since October 2025 is the concrete illustration of that volatility, and the BoJ’s rate check is the live wire. As PrimeXBT and EBC frame it, continued yen weakness is the base case while the Fed stays hawkish and the BoJ moves cautiously, but intervention can produce rapid yen appreciation and reverse carry positions without warning.
When the dollar bull case breaks down
Every argument in this piece rests on one condition: the Fed staying hawkish. Remove that anchor, and the structure weakens fast.
That conditionality is already visible in the data. The DXY touched above 101.00 on the original reporting day, but across the 16-22 September 2026 window it settled back into a 99.7-100.7 range, closing at 100.54 on 22 September 2026 per Investing.com and TradingEconomics. The recent highs are not permanent fixtures.
Reuters and PrimeXBT both frame a Fed pivot or pause as the primary vulnerability. If inflation moderates or growth deteriorates enough for the Fed to stop tightening, the fundamental support for the dollar diminishes, and the index could drift back toward or below the 99-100 range.
The intervention variable: asymmetric and rapid
The second risk behaves differently from the first. A BoJ rate check, as PrimeXBT described, is authorities gauging market conditions, often a signal that intervention is being considered.
That makes it a non-linear ceiling on USD/JPY rather than a gradual one. If the pair pushes into the prior intervention zones near 158-160, official action can trigger a sharp, rapid yen appreciation that reverses multiple dollar pairs at once, not just the yen crosses.
Coordinated yen intervention carries a structural logic that unilateral action lacks: when Japan sells Treasuries to fund dollar sales, it floods the US bond market with supply and pushes yields higher, which is precisely why the US joined the August 2026 operation by selling euro reserves rather than allowing Japan to act alone.
Watch these three conditions, in order of immediacy:
- Fed forward guidance: any softening in the hawkish stance, whether on inflation or growth, undercuts the dollar’s core support.
- USD/JPY proximity to 158-160: the closer the pair gets, the higher the odds of a sudden, disorderly reversal.
- Global growth deterioration: sustained dollar strength raises imported inflation and dollar-debt burdens in non-USD economies, which can provoke policy responses that feed back into FX.
The takeaway is that current dollar strength is a conditional trade, not a structural inevitability. Monitoring Fed guidance and USD/JPY’s distance from intervention zones is the most efficient way to see a reversal coming.
This article is for informational purposes only and should not be considered financial advice. Investors should conduct their own research and consult with financial professionals before making investment decisions. Past performance does not guarantee future results, and financial projections are subject to market conditions and various risk factors. Forward-looking statements are speculative and subject to change based on market developments.
Reading the FX landscape as a forward-looking investor
Three threads run through the week’s currency action. The BoJ paradox shows that a rate hike weakens a currency when guidance is cautious and the next move looks uncertain. The 250-plus basis point US-Japan rate differential anchors continued yen pressure while making the USD/JPY trade asymmetric near intervention zones. And the dollar’s dominance is conditional, holding only as long as the Fed stays hawkish.
The data window here, 18-22 September 2026, is a snapshot of a moving picture. The live inputs to keep watching are Fed forward guidance, the BoJ’s tightening pace, and USD/JPY’s proximity to the 158-160 intervention band.
For readers wanting to track the dollar’s momentum quantitatively as Fed guidance evolves, our full explainer on DXY technical levels walks through the 20-day EMA and RSI framework institutional analysts use to distinguish trend continuation from a failed breakout near the 99.69-99.80 support cluster.
What you now have is a framework rather than a forecast. The next central bank decision or sharp FX move you encounter can be read through these mechanics, which beats reacting to the headline and hoping the intuitive interpretation happens to be right.