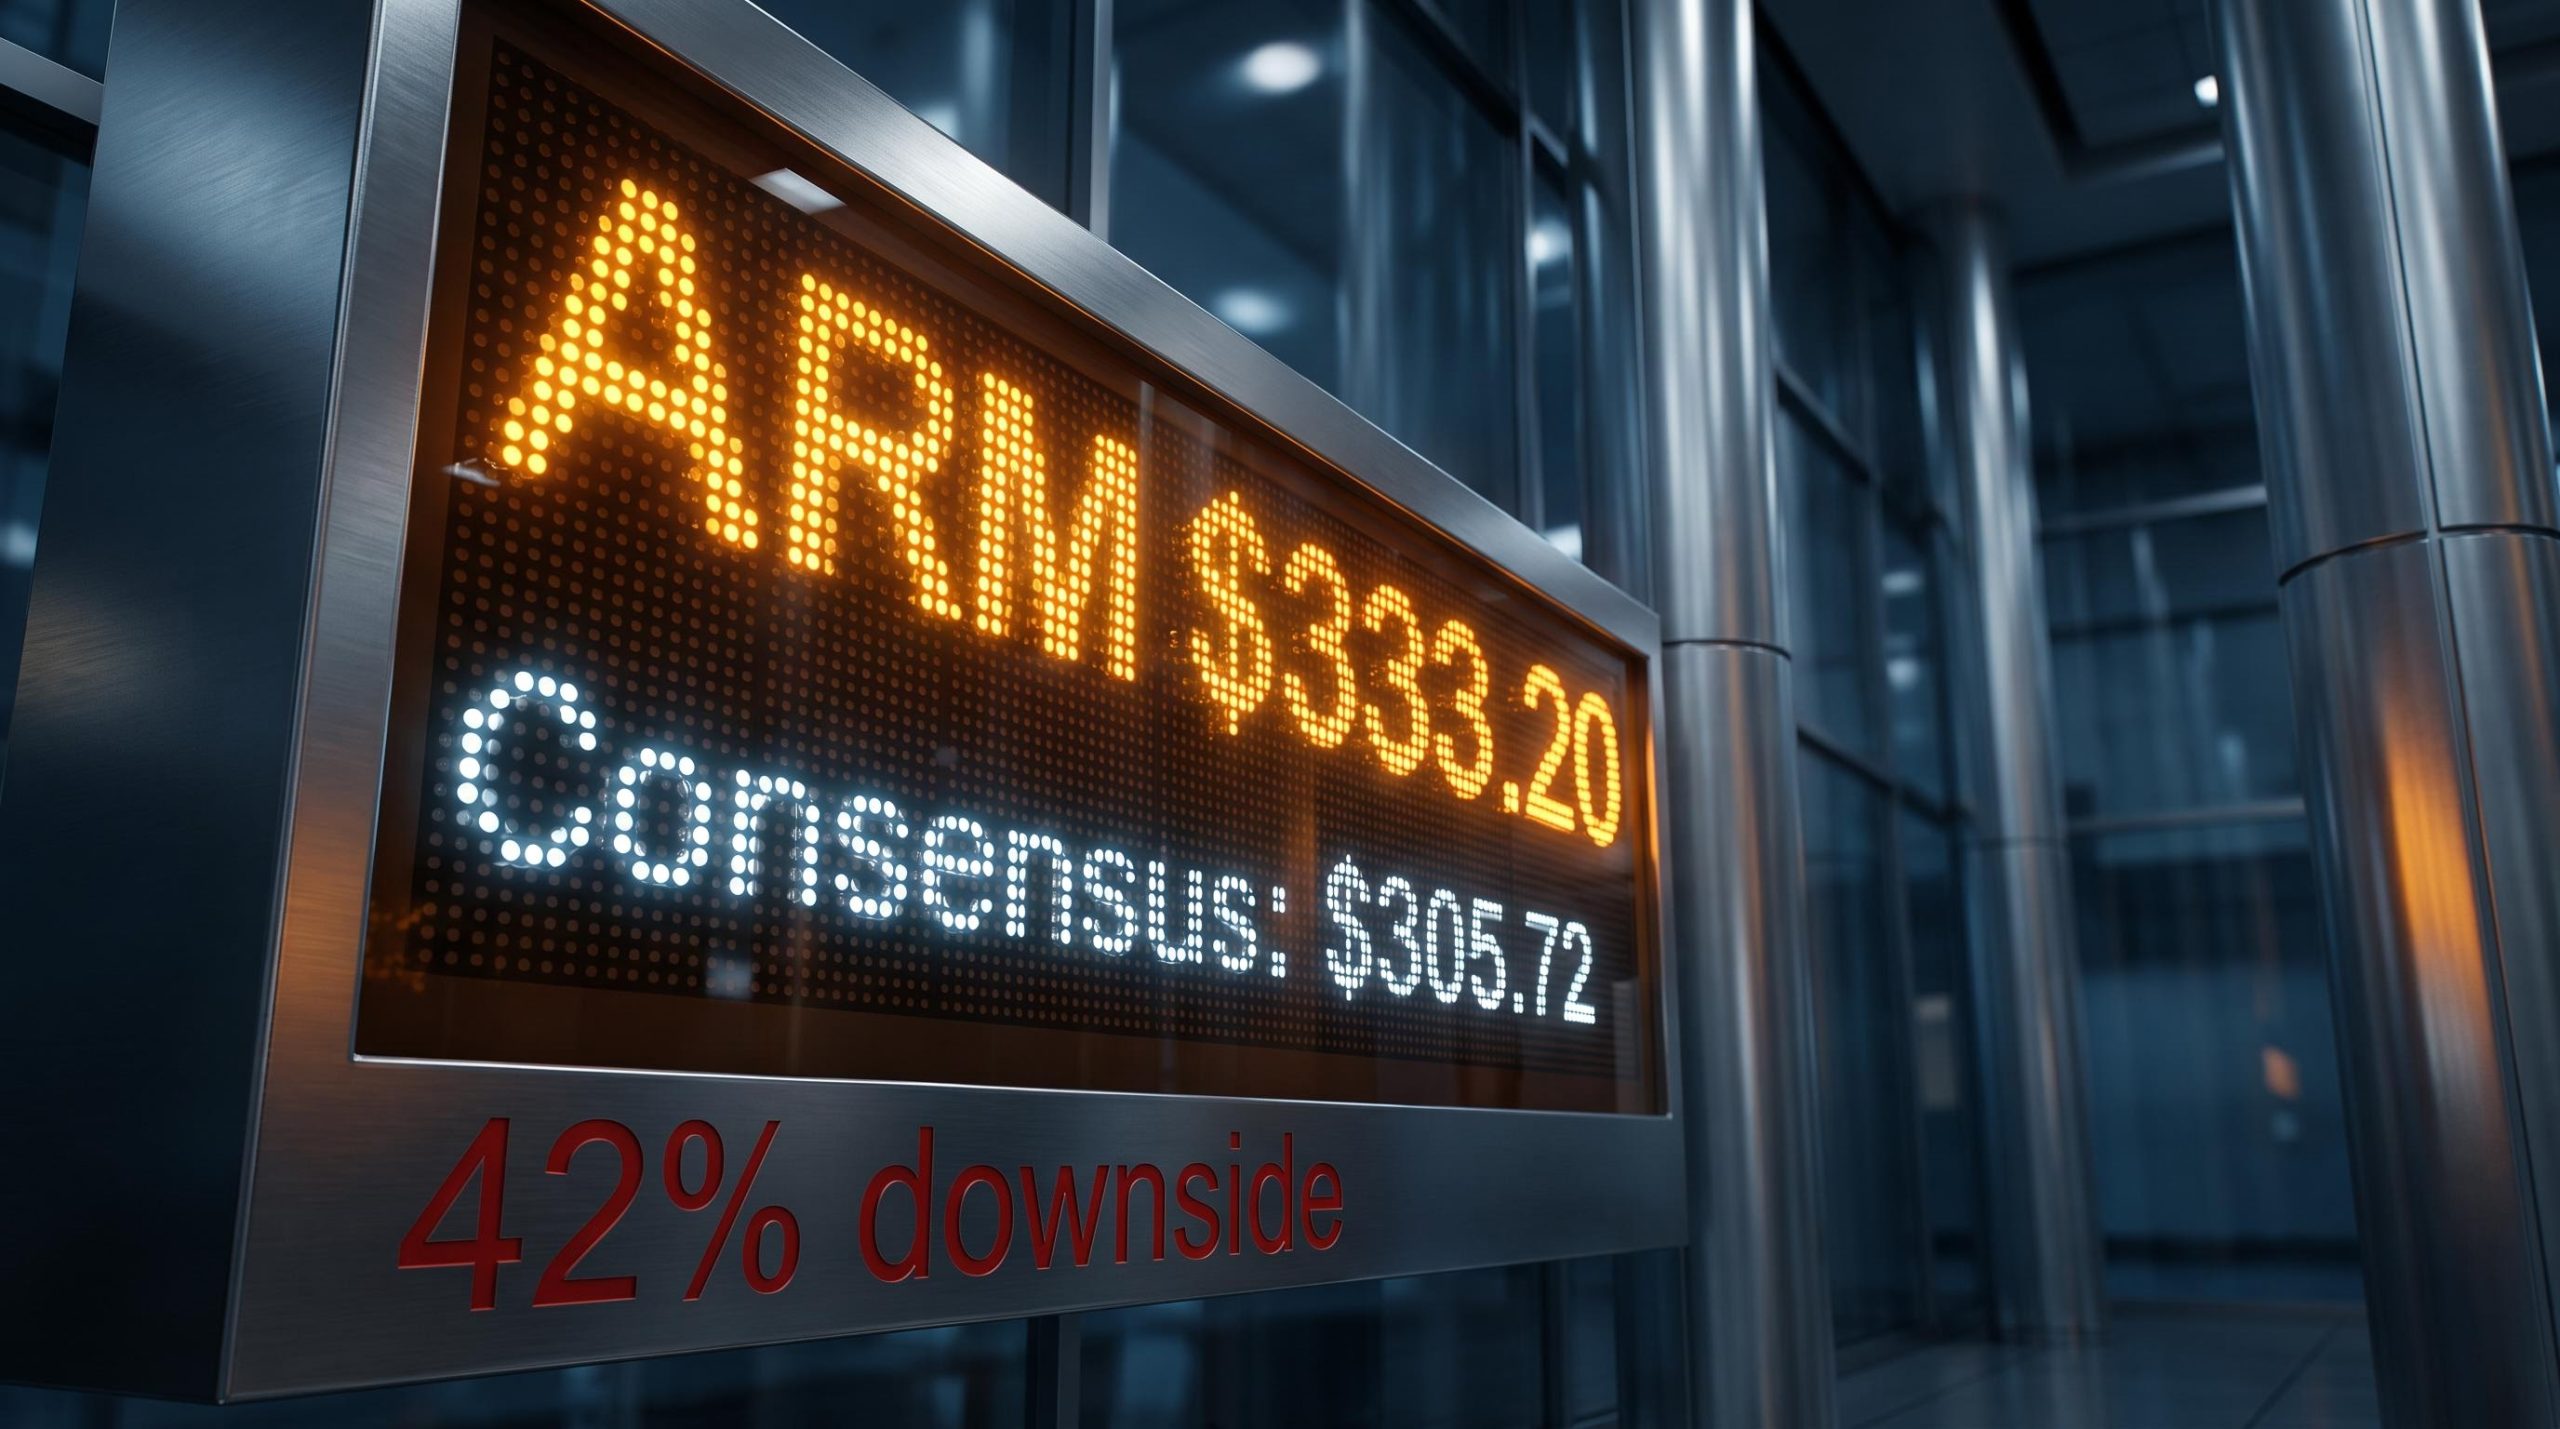
ARM Holdings closed the week at $333.20 after a 36% gain, yet the consensus analyst target sits at $305.72 and a fundamental fair value model implies roughly 42% downside from here. That gap between price and target is not a rounding error; it is the central tension every investor in this stock now has to resolve.
The full-year results that drove the surge were genuinely strong: $4.92 billion in revenue, 22.8% growth, and gross margins of approximately 97.5%. But strong results and a justifiable price are two separate things, and at a 143x forward price-to-earnings (P/E) ratio, the stock is pricing in a future that demands near-flawless execution through at least fiscal year 2028.
This analysis stress-tests the valuation against realistic growth scenarios, maps the artificial intelligence (AI) demand cycle that underpins the bull case, and walks through three concrete technical entry points with specific price levels and risk-reward ratios. After this, you will have a framework for deciding whether ARM is worth owning at the current price, waiting for a pullback, or fading on a failed breakout.
What the full-year results actually show
Start with what the business did, because on operating quality alone, ARM delivered. Full-year revenue reached $4.92 billion, up 22.8% year-on-year, and profit expanded roughly 27% over the same period.
That detail matters more than it first appears. When profit grows faster than revenue, it signals operating leverage: the business is converting each additional dollar of sales into a larger share of profit than before, rather than spending it back out on costs.
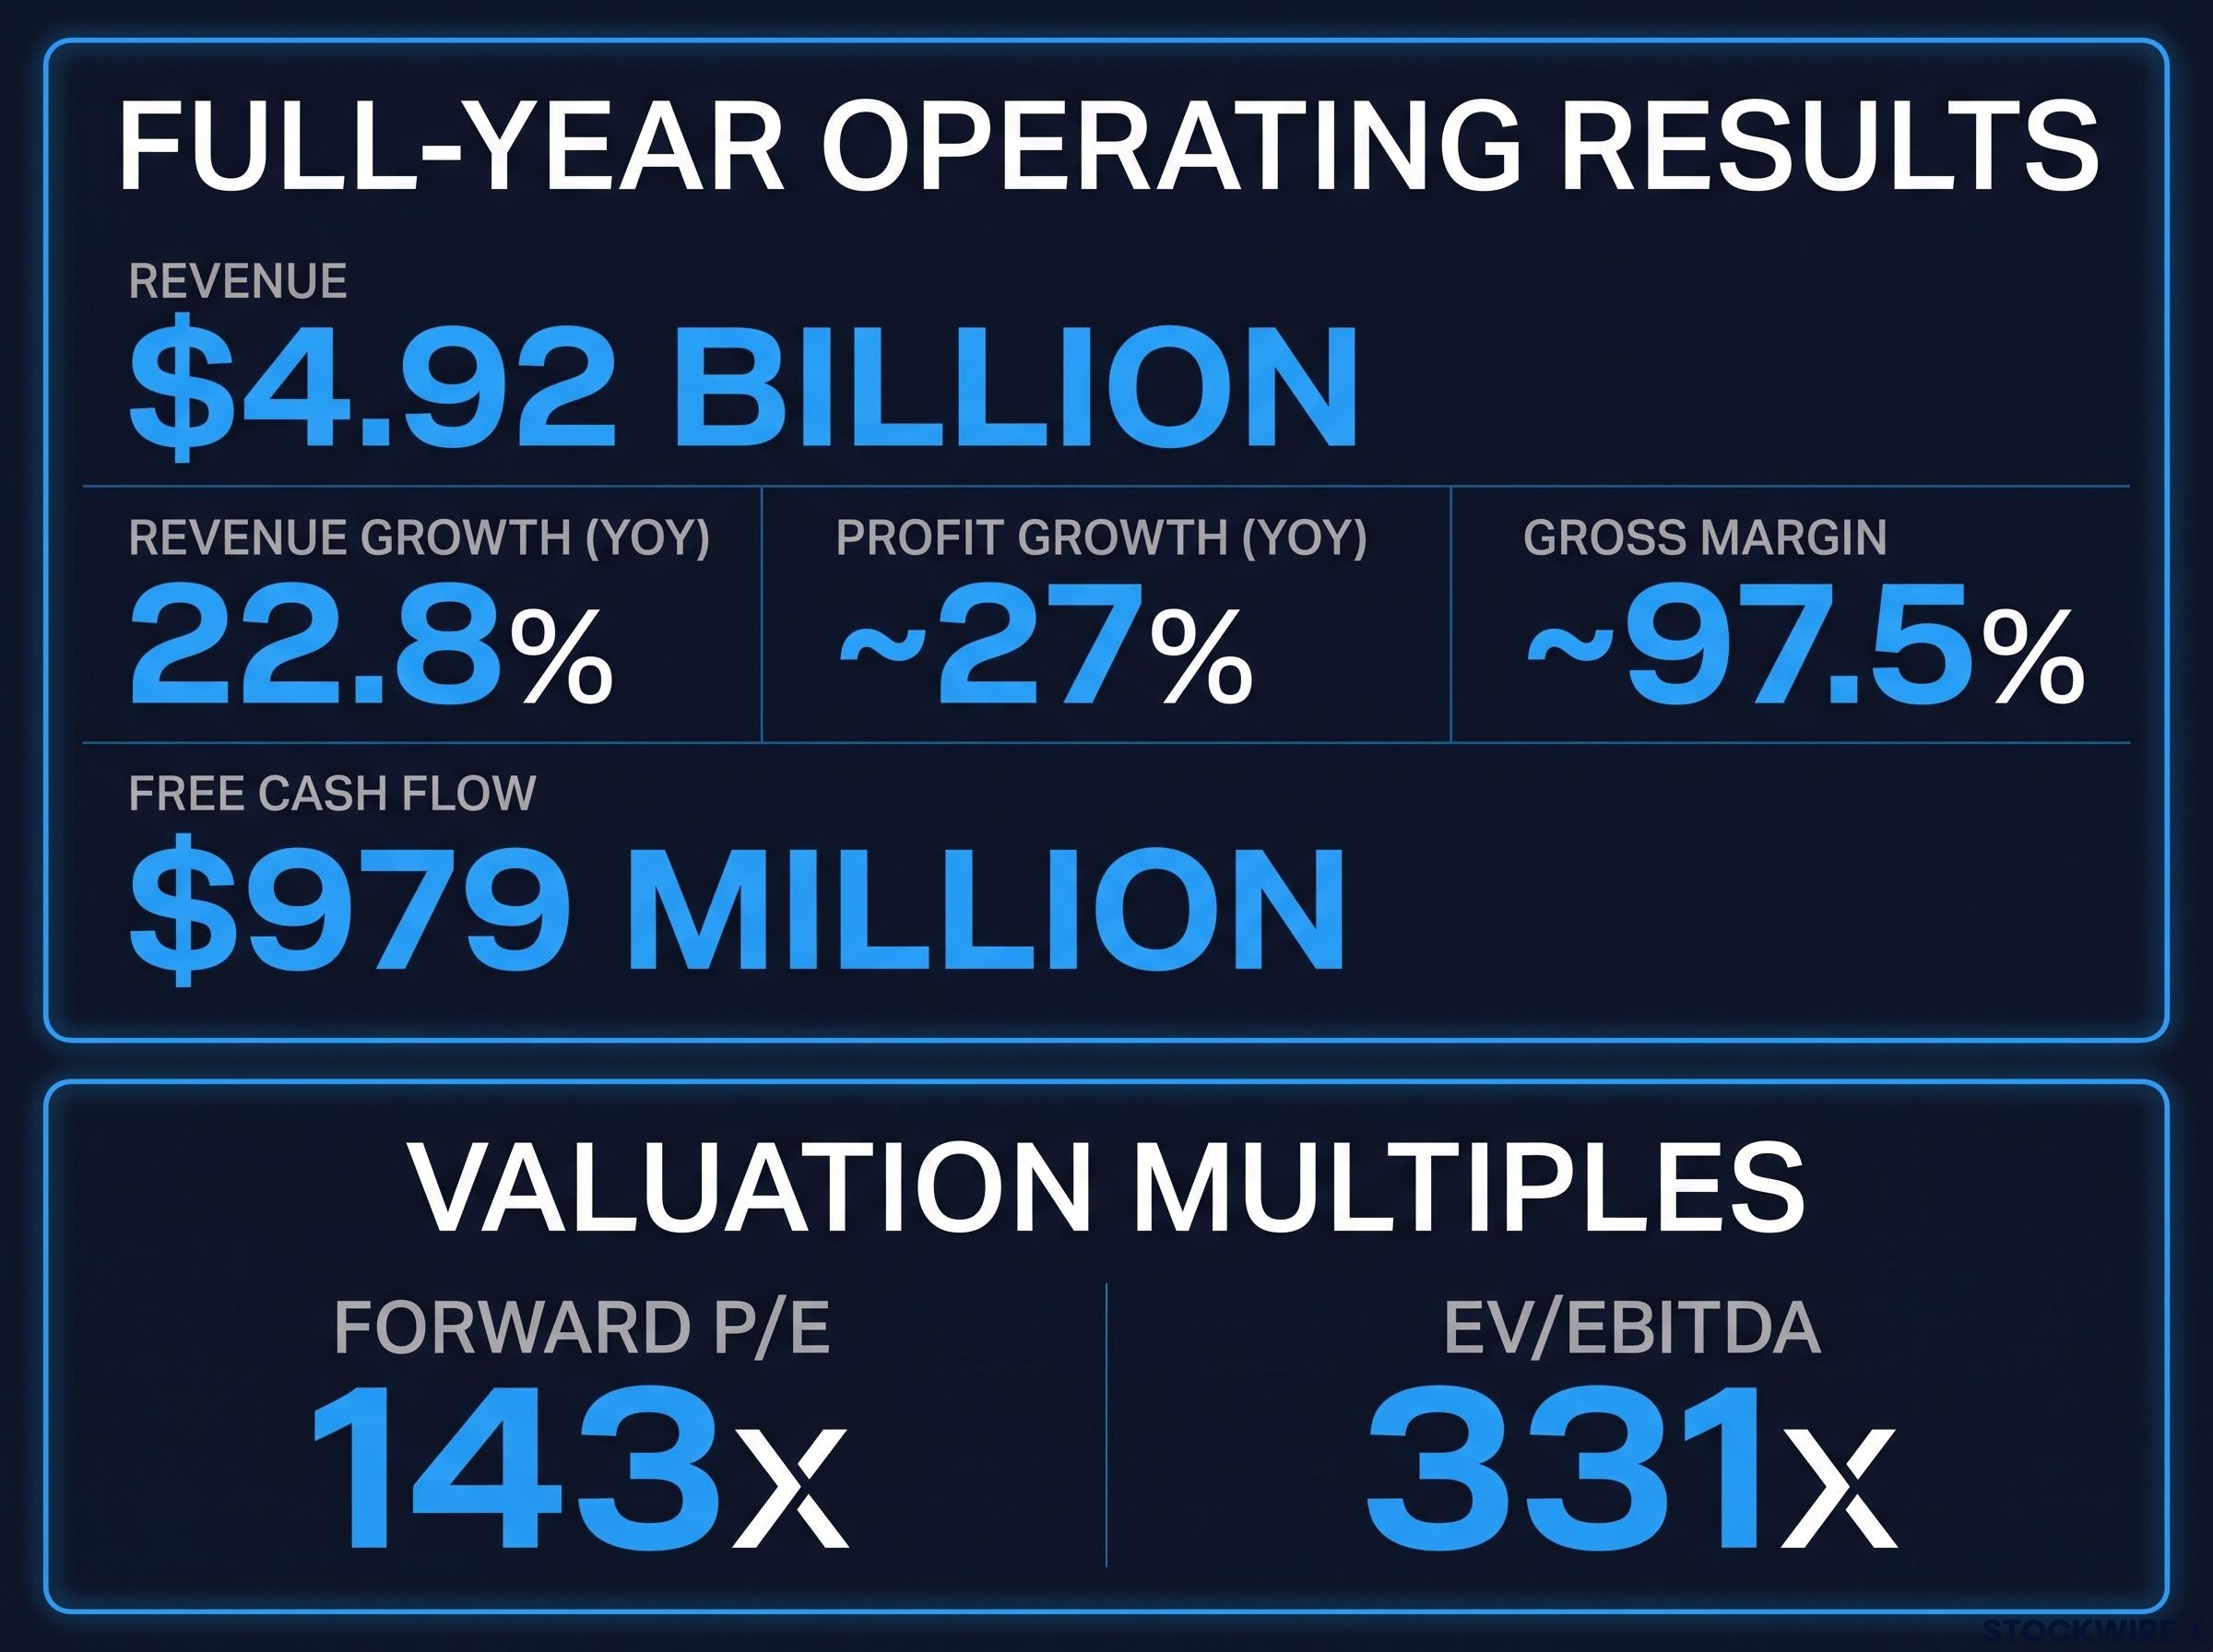
The margin picture is where ARM separates itself from the rest of the sector. A gross margin near 97.5% is not something a traditional chip manufacturer can replicate, because those firms carry the capital cost of fabrication plants and physical production. ARM licenses its chip architecture and collects royalties on chips others build, so the incremental cost of each additional licence is close to nothing.
Free cash flow of $979 million confirms the model is not just profitable on paper but genuinely cash-generative. And demand, according to management, is broad-based across the fastest-growing corners of computing.
“Demand across data centres, automotive robotics, and edge computing is exceptionally strong,” said Rene Haas, Chief Executive Officer of ARM, who also pointed to accelerating momentum in the company’s newer AGI CPU segment, where the demand pipeline sits at approximately $2 billion.
Here is the full-year picture in one view.
| Metric | Full-Year Result |
|---|---|
| Revenue | $4.92 billion |
| Revenue growth (YoY) | 22.8% |
| Profit growth (YoY) | ~27% |
| Gross margin | ~97.5% |
| Free cash flow | $979 million |
None of this is in dispute. What the results cannot answer on their own is whether the growth rate can accelerate from here, and that is the only question that justifies the current multiple. A business generating $979 million in free cash flow at 97.5% margins is structurally sound, but your entry price decides whether that soundness becomes a return or a loss. At $333.20, the price already reflects several more years of accelerating growth, not the strong-but-steady growth the results actually delivered.
When big ASX news breaks, our subscribers know first
Can a 143x forward P/E be defended, and what would have to be true?
The results tell you ARM is a good business. The valuation asks a harder question: how good does the future have to be to justify paying this price?
Start with the multiples. ARM trades at approximately 143x forward P/E and roughly 331x EV/EBITDA. EV/EBITDA measures a company’s total value, including debt, against its earnings before interest, tax, depreciation, and amortisation. It strips out financing and accounting effects to show what you are paying for the underlying operating profit, and at 331x, you are paying an extraordinary amount.
The growth rate ARM must sustain to close the valuation gap
Now the arithmetic. To compress ARM’s forward P/E down to the level of megacap AI peers, analysts estimate the company would need annual revenue growth of between 49% and 74% through fiscal year 2028. That range assumes physical chip manufacturing gradually dilutes net margins toward approximately 30% as ARM moves further into producing its own silicon.
Set that against the 22.8% growth ARM just reported. The valuation does not require ARM to keep growing at its current pace; it requires ARM to more than double that pace and hold it for three years.
The consensus phrase for what this demands is “near-flawless execution.” That is the real risk. At 143x forward earnings, any guidance miss or product delay would likely trigger a correction far larger than the same stumble would cause in a stock trading nearer its earnings.
The debate over AI bull market runway is not confined to ARM: Paul Tudor Jones estimated in May 2026 that one to two years of the AI cycle remain, drawing a direct parallel to 1999 and framing current semiconductor valuations as a risk horizon rather than an immediate exit signal.
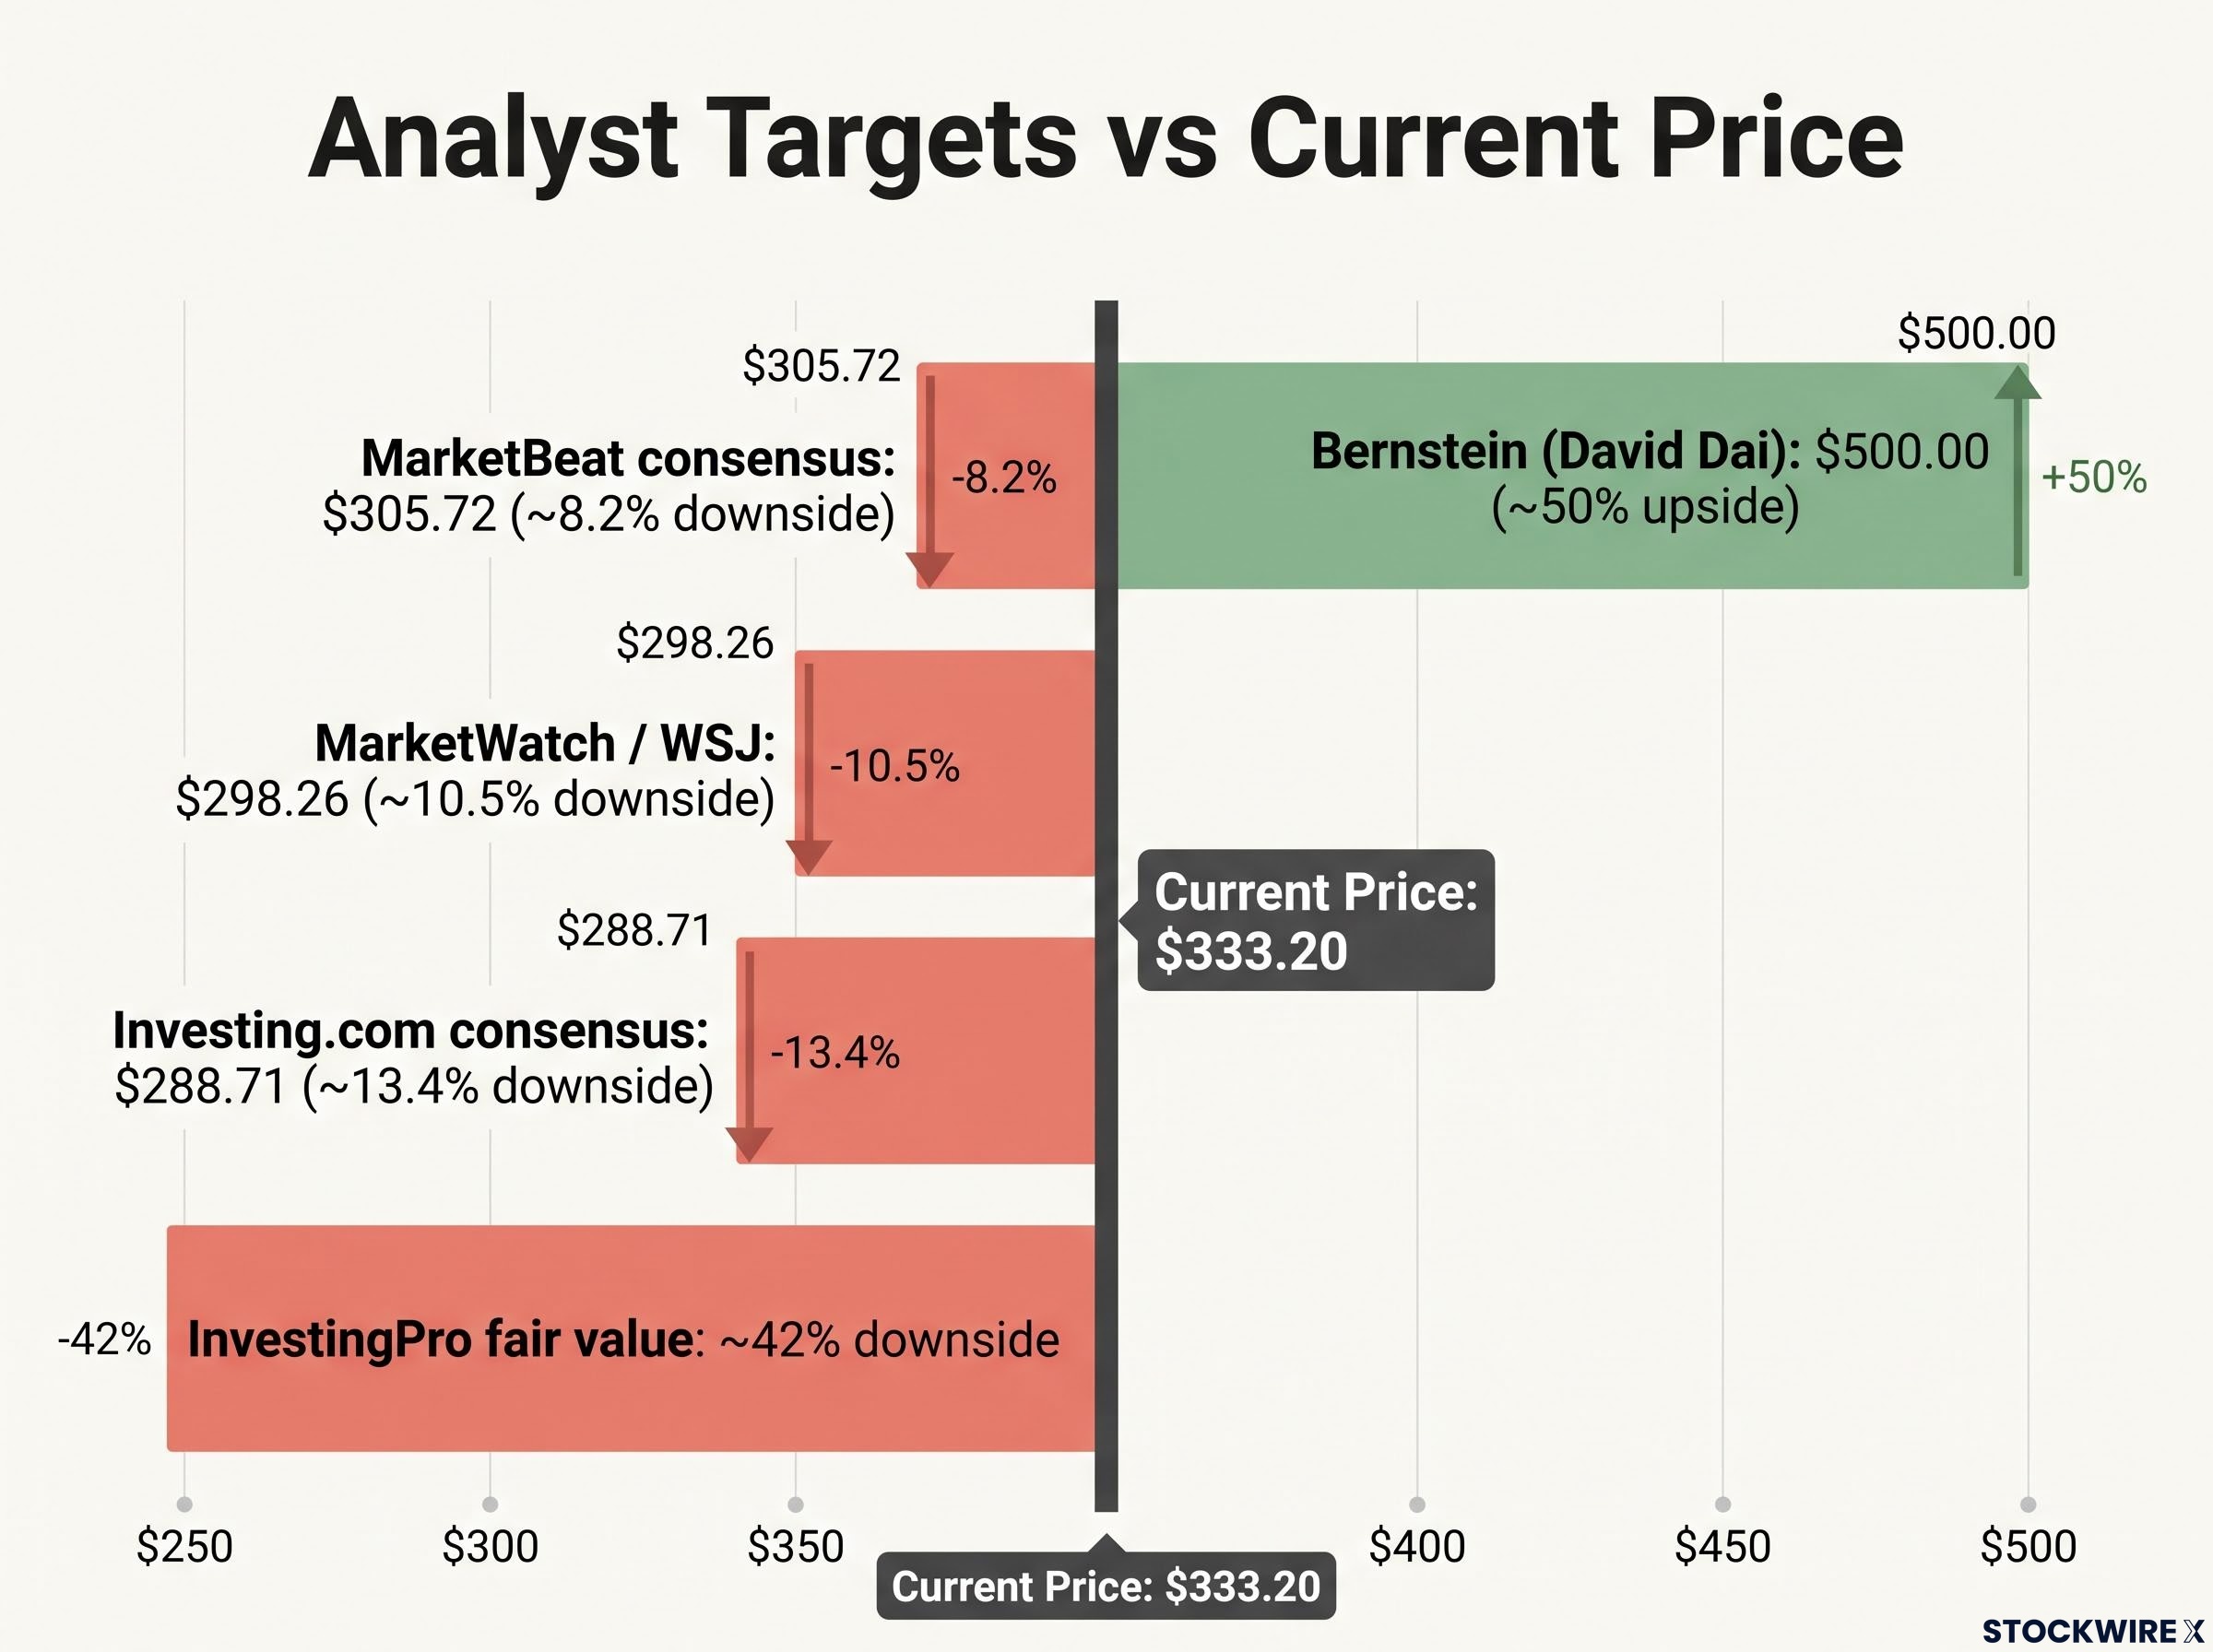
The analyst community reflects exactly this split. Bernstein’s David Dai raised his target from $300 to $500 on 17 June 2026, maintaining an Outperform rating, effectively endorsing the aggressive growth path. At the other end, Investing.com’s InvestingPro fair value model points the opposite way.
The InvestingPro fair value model implies roughly 42% downside from the post-surge price, the most bearish read surfaced across accessible sources and a direct challenge to the premium the market is currently paying.
Here is how the targets line up against the $333.20 close.
| Source | Target | Implied vs $333.20 |
|---|---|---|
| Bernstein (David Dai) | $500.00 | ~50% upside |
| MarketBeat consensus | $305.72 | ~8.2% downside |
| MarketWatch / WSJ | $298.26 | ~10.5% downside |
| Investing.com consensus | $288.71 | ~13.4% downside |
| InvestingPro fair value | Implies ~42% downside | ~42% downside |
Look closely at the consensus. Of 27 brokerages tracked by MarketBeat, 18 rate ARM a Buy, and yet the average target of $305.72 still sits below the current price. That combination matters for how you read the setup. It is not a contrarian signal to buy; it is a warning that the institutional community has already priced in the good news it can see. Your upside from here requires believing something the consensus does not yet believe, which is a very different proposition from buying a stock the market has overlooked. It is worth noting that SoftBank’s margin loan expansion was reported at $25 billion, a reminder that ownership structure remains a live factor around the stock.
The AI demand cycle: structural opportunity, cyclical delivery
The bull case for ARM rests almost entirely on AI, and the structural argument for it is legitimate. The question is whether believing in that story means believing in this price, and those are two separable decisions.
ARM’s positioning across the AI cycle is genuinely strong. Its AGI CPU segment, developed in collaboration with Meta, targets agentic AI workloads (systems that plan and act autonomously rather than simply responding to prompts), with a demand pipeline of approximately $2 billion. Alongside that sit its established exposures across data centres, automotive robotics, and edge computing.
Why ARM’s royalty model is both the opportunity and the risk
The mechanism behind ARM’s scale is the licensing and royalty model. ARM designs chip architecture and collects a fee on every chip built using it, without manufacturing anything itself. That gives ARM enormous leverage: as AI deployment scales, its royalty stream scales with it, at almost no incremental cost.
The same mechanism is the constraint. ARM does not control end-market adoption rates, so its revenue depends on how many chips actually ship. And supply matters here as much as demand.
Gartner and IDC have flagged that AI hardware is limited by advanced-node wafer capacity, advanced packaging bottlenecks, and high-bandwidth memory supply. These constraints can inflate near-term margins during tight supply while simultaneously capping the volume of chips shipped, which limits how much of the demand cycle ARM’s royalties can capture in any given period.
The AGI CPU supply gap is not a new risk: when ARM reported Q4 FY2026 results in May, CFO Jason Child confirmed that supply had been secured for only roughly 45-55% of the $2 billion demand pipeline, with TSMC’s 3nm and 2nm capacity constraints acting as the primary bottleneck.
Then there is the shape of the cycle itself. McKinsey, Goldman Sachs, and Morgan Stanley broadly characterise AI compute demand as structural: new, long-duration workloads that will require sustained investment for years. But they are equally clear that the investment arrives in cyclical waves, with hyperscaler capex surging during build-outs and then slowing or plateauing once capacity catches up.
Several second-order risks sit on top of that cycle for 2026 and beyond:
Contracted hyperscaler backlog is the strongest counter-argument to a near-term capex plateau thesis: more than $2.3 trillion in legally undelivered commitments sits across Amazon, Alphabet, Microsoft, and Oracle, shifting the core risk question from whether demand will materialise to whether infrastructure can be built fast enough to fulfil signed obligations.
- Hyperscaler capex sustainability, and how long Big Tech maintains current AI datacentre spending before prioritising returns discipline
- Energy-infrastructure and environmental constraints that could slow or redirect datacentre build-outs
- Regulatory developments, including export controls on advanced chips and emerging AI-governance frameworks
Here is the read you should take from all of this. The AI demand cycle is real and long-duration, but “structural” does not mean “linear.” If hyperscaler capex plateaus for even one or two quarters, ARM’s royalty growth slows, and at 143x forward earnings, a slower quarter reprices the stock even when the five-year thesis stays intact.
Three entry scenarios for investors weighing a position now
If the fundamentals are sound and the valuation is stretched, the practical question becomes timing. That is where the technical setup earns its place, because it tells you how much of the good news is already crowded into the price.
Reading the technical setup before choosing a scenario
The primary trend is bullish. ARM trades above its Ichimoku cloud, above the SuperTrend indicator at $270.16, and comfortably above its 200-day simple moving average at $209.19. Momentum, though, is running hot.
The relative strength index (RSI), which measures the speed of recent price moves on a scale of 0 to 100, sits at 71.37, above the conventional overbought threshold of 70 defined in J. Welles Wilder’s original framework. The money flow index (MFI), which adds trading volume to that momentum read, is at 87.29. And the price is roughly 29% above its 20-day moving average, a substantial extension.
Overbought does not mean immediately bearish. Semiconductor precedents such as Nvidia and AMD sustained elevated RSI for weeks during strong runs before cooling. But near-term drawdown potential rises materially at these levels, and the map the scenarios navigate is defined by support at $311.90, resistance at $338.80, and a deeper support zone at $283.20-$285.00 that marks the breakout base.
Three scenarios, in ascending order of risk:
- Pullback entry, for those who want the best risk-adjusted setup and are willing to wait
- Breakout entry, for those who want momentum confirmation before committing
- Counter-trend short, for higher-risk traders fading the extension
| Scenario | Entry Trigger | Stop-Loss | Target | Reward-to-Risk |
|---|---|---|---|---|
| Pullback entry | Near $305.00 | $275.00 | $400.00 | ~3.2:1 |
| Breakout entry | Daily close above $338.80 | $275.00 | $354.00 (first) | Not specified |
| Counter-trend short | Stall between $338.00-$354.00 | $360.00 | $285.00 | Not specified |
The pullback scenario is the one with the cleanest arithmetic behind it.
A pullback entry near $305.00, with a stop at $275.00 and a target of $400.00, carries a reward-to-risk ratio of approximately 3.2:1, the most favourable and most reader-actionable setup in the technical read.
The breakout scenario waits for confirmation: entry only on a daily close above resistance at $338.80, stopped at $275.00, with a first target of $354.00. The counter-trend short is the aggressive play, entered if the price stalls between $338.00 and $354.00, stopped tightly at $360.00, targeting the $285.00 breakout base.
The principle that applies across all three is the same. At an RSI of 71.37 and 29% above its 20-day moving average, ARM is not in a buy-anywhere zone. Your entry point is doing more work than your thesis right now, which is exactly why position sizing and stop discipline matter more here than in a stock trading quietly at its moving average.
Semiconductor cycle timing adds a structural dimension to the entry point question: TSMC’s locked-in 2026 capital budget of $52-56 billion and Samsung’s estimated $70-80 billion annual outlay mean a 2027-2029 supply wave is already baked in, and investors who wait for red confirmation in quarterly results are, by one analysis, structurally too late to exit without material losses.
Making a disciplined call when price has moved faster than the thesis
Pull the three threads together and the picture sharpens. ARM’s operational quality is not the debate: 22.8% revenue growth, 97.5% gross margins, $979 million in free cash flow, and profit growing faster than sales are the marks of a genuinely strong business.
The debate is the price. At $333.20, ARM demands annual growth of 49% to 74% through fiscal year 2028, a hurdle that no publicly available consensus model reaches except Bernstein’s most aggressive scenario. That is the gap between a good company and a good entry.
Two catalysts could close that gap faster than the consensus expects:
- A material acceleration in AGI CPU revenue from the approximately $2 billion demand pipeline
- A sector-wide re-rating of AI semiconductor multiples, driven by continued hyperscaler capex
Neither is implausible, but neither is the base case, and that is the point. The gap between $333.20 and the $305.72 consensus is not noise; it is the market signalling that the 36% surge has already absorbed the good news it can identify. Your next move should be calibrated to that gap, not to the momentum of the week just passed.
For investors who believe the long-term thesis but respect the valuation risk, the disciplined path is to define an entry before the stock dictates one to you. The pullback scenario near $305.00, with its 3.2:1 reward-to-risk, offers the most defensible risk-adjusted route for anyone not already positioned, while the InvestingPro 42% downside case and Bernstein’s $500 target frame the full range of what you are choosing between.
This article is for informational purposes only and should not be considered financial advice. Investors should conduct their own research and consult with financial professionals before making investment decisions.
Past performance does not guarantee future results. Financial projections are subject to market conditions and various risk factors, and the forward-looking scenarios discussed here are speculative and subject to change based on market developments and company performance.