The US federal government now spends more on its mandatory obligations alone, entitlements, debt interest, and veterans affairs, than it collects in all tax revenue combined. That is before a single discretionary dollar is appropriated for defence, infrastructure, or anything else.
Sit with that arithmetic for a moment, because it is not a projection. It is a current condition.
Deficit anxiety has circulated through financial markets for roughly two decades, treated mostly as a distant risk. What has changed is the compounding: mandatory spending is growing at around 7.5% a year while revenues grow at around 4%, and the gap widens every year regardless of how the economy performs. The bond market has noticed, and it is pricing a risk that fiscal commentary long filed under “someday.”
Most coverage of this either catastrophises or waves it away. Here is the framework for separating signal from noise: which numbers actually matter, what Treasury Secretary Scott Bessent’s market interventions really are and why sophisticated investors find them alarming, and how to think about the fork between managed decline and genuine yield curve control.
The arithmetic that changed: when mandatory spending outpaced every dollar collected
Start with the figure that reframes everything. According to the original source analysis, during the first three quarters of the current fiscal year, combined spending on entitlements, debt interest, and veterans affairs equalled 105% of total federal tax receipts, before any discretionary spending was counted at all.
Treat that number with appropriate care. It is the source’s own calculation over a rolling three-quarter window, and no official statistic matching it exactly appears in published data.
The official baseline is slightly less severe but points the same direction. The Congressional Budget Office (CBO) puts mandatory outlays including interest at $4.2 trillion in FY2025, or 14.0% of GDP, against total federal revenues of $5.2 trillion, or 17.1% of GDP. Mandatory spending accounts for 74% of the federal budget in 2025.
The operative fact is not the exact percentage. It is the growth-rate asymmetry underneath it.
The structural engine Mandatory spending categories are expanding at roughly 7.5% annually. Revenues are growing at roughly 4%. That differential is what widens the gap every single year, independent of recessions, booms, or election cycles.
What this tells you is that no plausible revenue scenario closes this gap on its own. You cannot grow your way out of a spread that compounds against you. Only structural spending reform changes the trajectory, and that is a political question, not an arithmetic one.
| Fiscal year | Mandatory outlays (% of GDP) | Mandatory spending (% of federal budget) |
|---|---|---|
| FY2025 | 14.0% | 74% |
| FY2026 | 14.2% | Rising |
| FY2036 (projection) | Rising | 80% |
What the 10-year trajectory tells us beyond the headline figure
The CBO’s 2026-2036 outlook confirms the direction. Total federal outlays are projected to climb from 23.3% of GDP in 2026 to 24.4% by 2036, while revenues stay roughly flat, edging from 17.5% to 17.8%.
The debt-to-GDP ratio, the figure most commonly cited in fiscal commentary, compares a stock of accumulated obligations to an annual flow of economic output rather than to government revenue, which is why interest payments as a share of tax receipts tell a more direct story about affordability than the headline percentage does.
Most of that increase is not discretionary. Mandatory spending plus interest accounts for the bulk of the projected $4.4 trillion rise in outlays over the decade.
Extend the line further and the picture sharpens. Under current-law assumptions, CBO projects federal debt held by the public rising from 100% of GDP in 2025 to 156% by 2055. That is the destination if nothing changes.
When big ASX news breaks, our subscribers know first
What Treasury Secretary Bessent is actually doing in the bond market
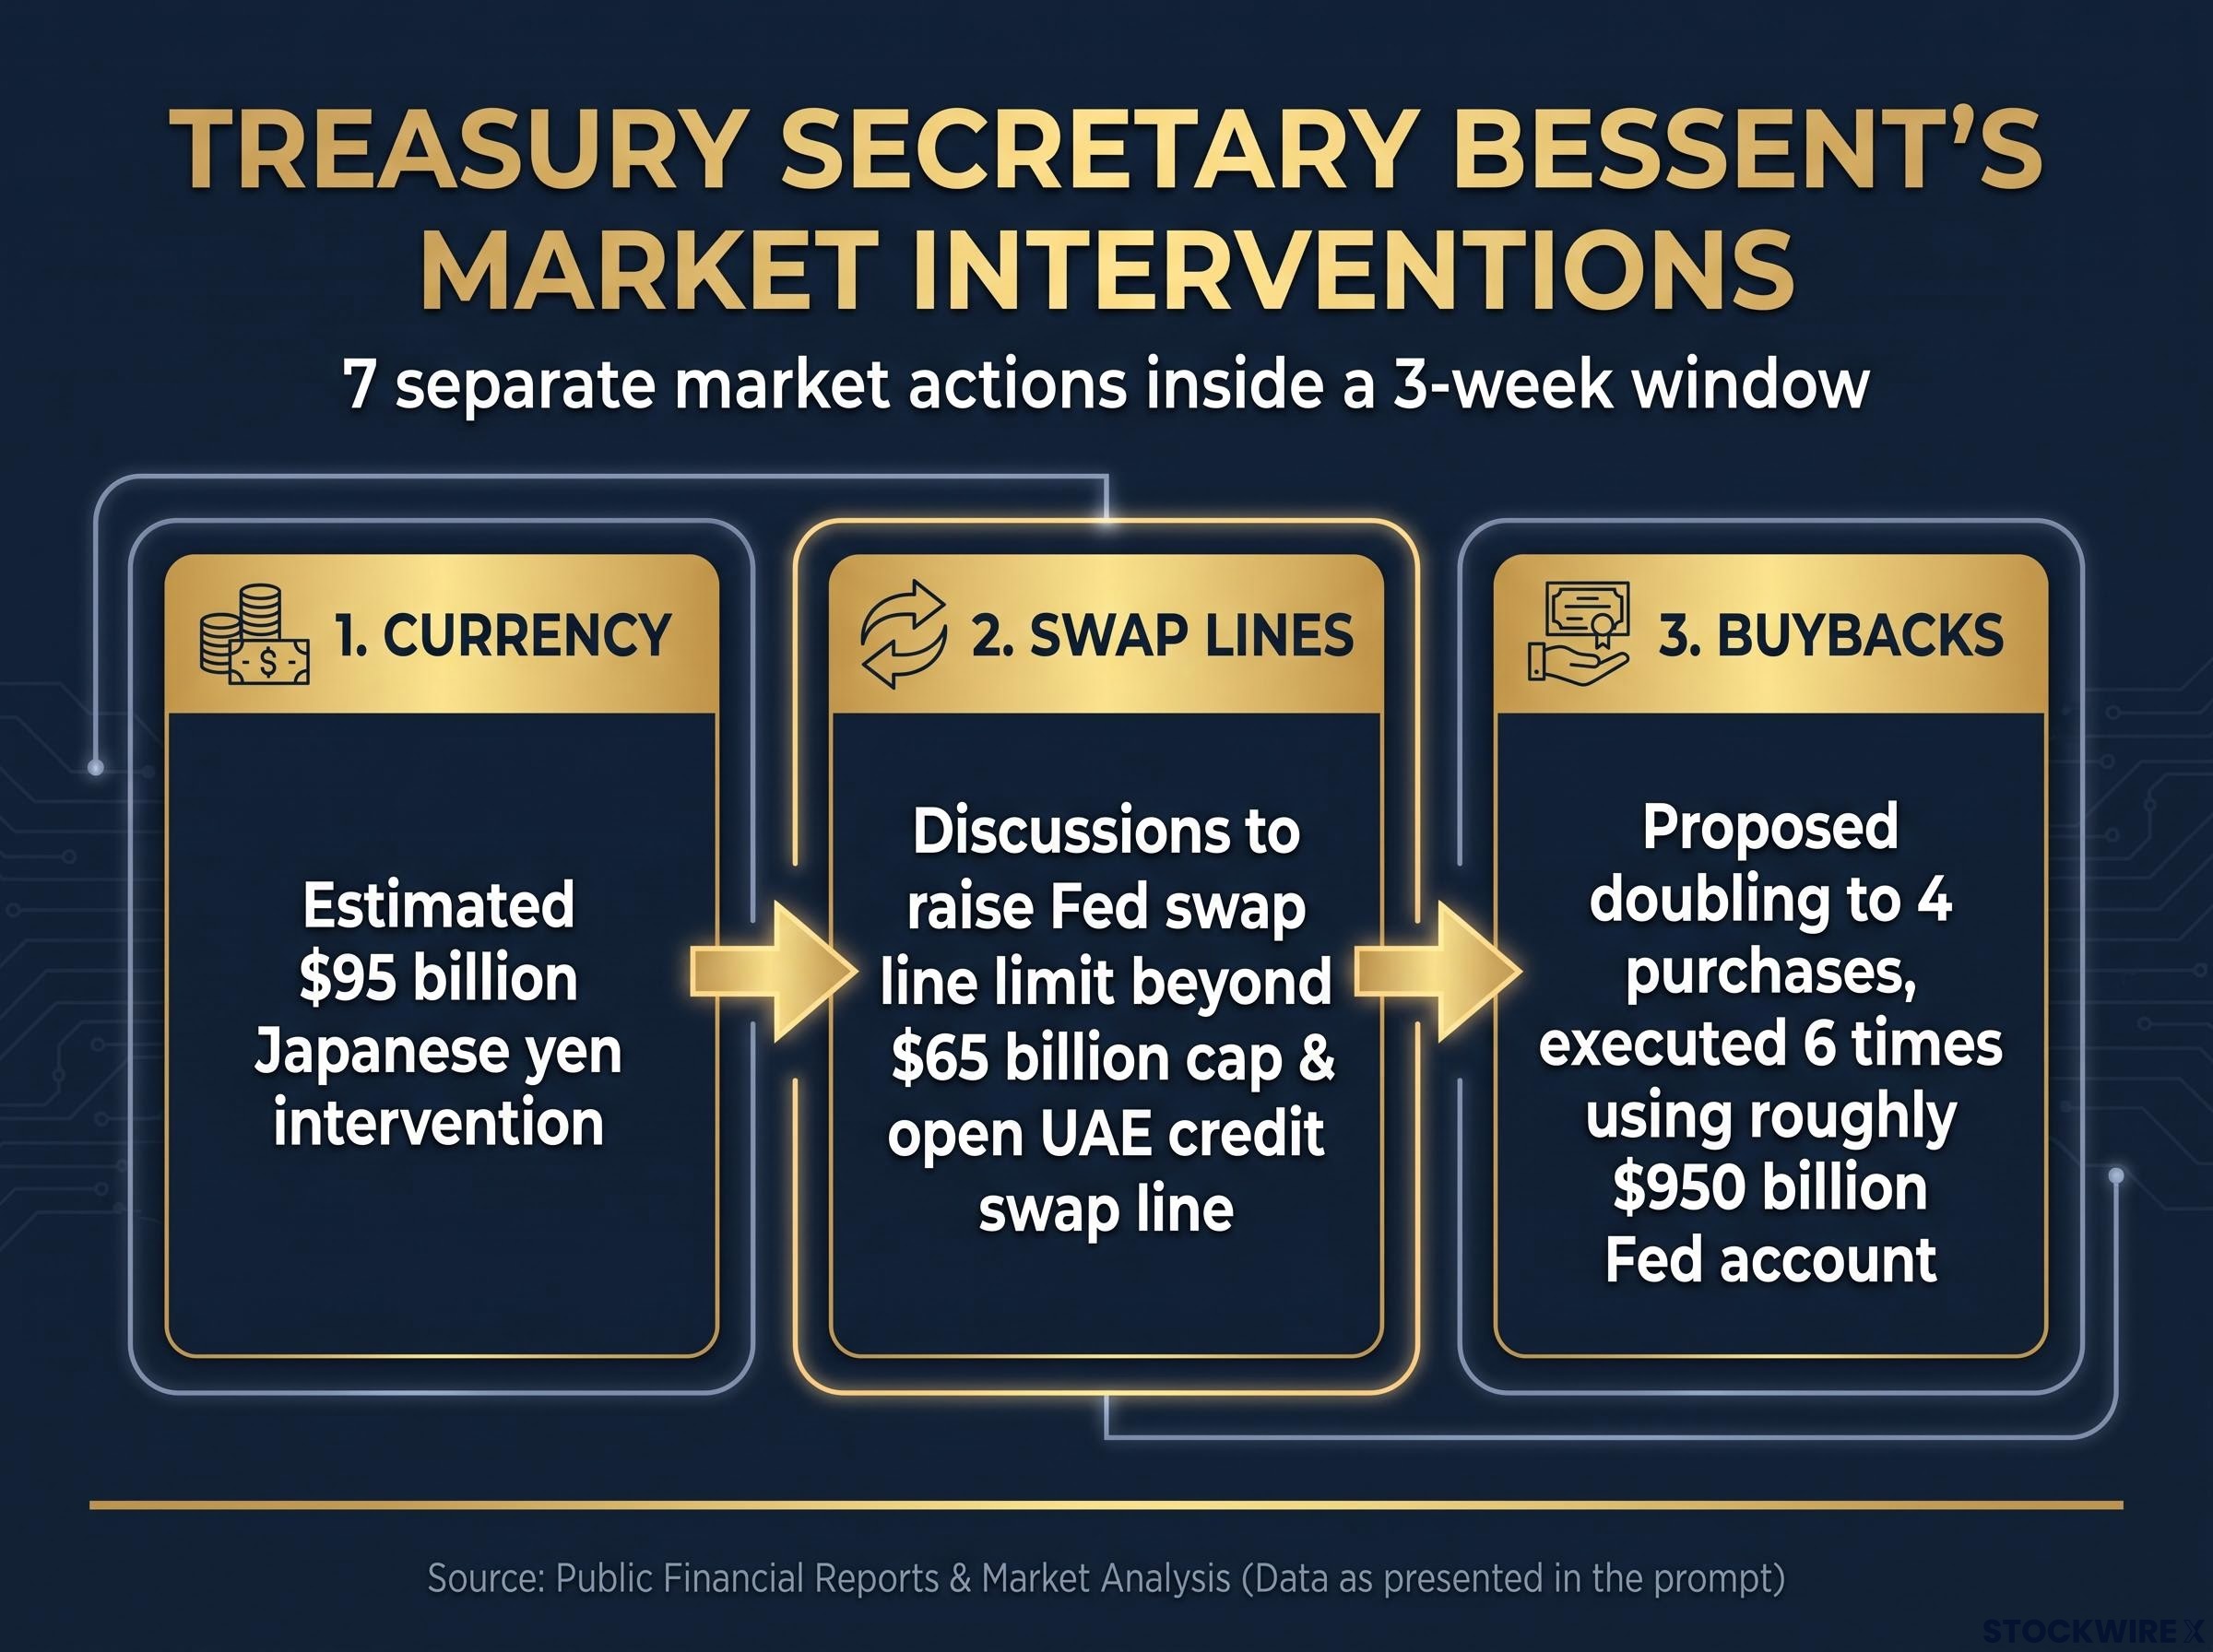
The scale of Bessent’s activity is visible only when you stack the interventions on top of one another. The original source counts roughly seven separate market actions inside a three-week window.
Start with the largest single move. The Treasury carried out a Japanese yen intervention estimated at $95 billion, described as potentially the largest such action on record.
Then came the plumbing. Bessent held discussions about raising Federal Reserve swap line limits beyond the existing $65 billion cap, and about opening a UAE credit swap line, an arrangement historically restricted to the five largest central banks.
Then the buybacks. What was proposed as a doubling of periodic Treasury purchases, from two instances to four, was ultimately executed six times, with the Treasury’s roughly $950 billion account at the Federal Reserve cited as the proposed funding source.
Here is the sequence of escalation:
- Currency: a $95 billion yen intervention, potentially a record.
- Swap lines: discussions to lift the $65 billion cap and extend a credit line to a central bank outside the usual five.
- Buybacks: a proposed doubling that became a sixfold execution.
Be precise about the objective. Bessent’s stated goal is not to lower rates outright but to slow the pace at which long-term rates rise, and the mechanism targets the longer end of the curve, the 30-year bonds and the duration that feeds into mortgage rates, rather than the short end the Fed controls through the federal funds rate.
Signalling operations of this kind are designed to reprice speculative risk through deliberate ambiguity rather than through mechanical purchase volume, which is why the 30-year yield fell sharply on the buyback announcement and then largely retraced within days, a pattern consistent with a deterrent calibration rather than a structural anchor.
There is a wrinkle. Bessent’s public assertions of informational advantages over currency market participants have themselves been cited as contributing to rising rates by unsettling investors.
The signal for you is in the clustering. A Treasury operating in normal conditions does not need seven interventions in three weeks, and the reach for tools reserved for the world’s largest central banks suggests the constraint is real rather than precautionary.
The invoice Billionaire investor Stanley Druckenmiller has called the long-term Treasury yield “the only fiscal disciplinarian the U.S. has left,” arguing that a 30-year bond forced to clear at 5.5% is an “invoice” for fiscal policy, not a crisis.
Understanding yield curve control: the policy tool markets fear most
You have probably heard the phrase yield curve control. Fewer people can say exactly what separates it from what the Treasury is doing now, and that distinction is the whole story.
Yield curve control, or YCC, is a central bank commitment to cap or peg yields at specific points on the curve using unlimited bond purchases. Because those purchases are funded by newly created money, it is functionally equivalent to quantitative easing, sometimes called money printing light.
Buybacks are a lighter-touch tool. Officially they are liquidity management, retiring older, less-liquid bonds, and they carry no binding commitment to hold any yield at any level. The difference between the two is the difference between tactical management and structural monetary regime change.
Two historical precedents bracket the risk. In 2016, the Bank of Japan targeted short-term rates at about -0.1% and 10-year yields around 0%, successfully maintaining stimulus but risking enormous balance-sheet expansion and squeezing bank profitability.
The United States has its own precedent. During and after the Second World War, the Federal Reserve ran de facto YCC, pegging short-term T-bill yields at 0.375% and capping long-term bonds at 2.5%, an arrangement unwound in the 1950s amid concerns it fuelled inflation and constrained monetary policy.
| Regime | Intervention type | Key outcome or risk |
|---|---|---|
| Japan 2016 | Formal YCC: -0.1% short, ~0% 10-year | Stimulus held, but balance sheet ballooned and bank margins compressed |
| US WWII | De facto YCC: 0.375% T-bill peg, 2.5% long-bond cap | Financed war debt, later fuelled inflation and constrained the Fed |
| Current US | Bond buybacks, no binding yield peg | Interventions more concentrated than four decades of experience |
Both precedents ended the same way: monetary policy became constrained by the peg rather than the peg serving policy. What this means for you is straightforward. If the US slides toward formal YCC, the Fed forfeits the independent rate-setting authority it currently uses to manage inflation.
How the current intervention trajectory compares to historical thresholds
Buybacks are not YCC because there is no binding yield commitment. The line gets crossed when the Treasury or Fed announces an explicit target and pledges unlimited purchases to defend it.
The original source characterises the current concentration of interventions as more numerous than anything observed in four decades of market experience. That is a description of proximity, not arrival.
One market signal tells you where investors currently price the odds. The incomplete transition to explicit money printing is cited as a primary reason gold has not risen further despite the fiscal pressure. If the market believed full YCC were imminent, that restraint would likely give way.
The bond market revolt and what yields are actually pricing
The bond market’s behaviour is not panic. It is a rational pricing exercise, and the yield levels are the output of four identifiable pressures rather than sentiment.
Strategists attribute the surge in long-term yields to a specific set of forces:
- Persistent large deficits
- An exploding supply of new Treasuries
- Reduced balance-sheet demand from the Federal Reserve
- Rising inflation risk
The numbers put that in context. As of 14 September 2026, according to market data cited in the research, the 10-year Treasury yield reached approximately 4.955%, touching 5% intraday, while the 30-year sat at 5.33%. The national debt has surpassed $40 trillion.
Then there is the cost of carrying it. Treasury data show an average interest rate of 3.49% on total interest-bearing debt, with $1.27 trillion of interest paid fiscal year-to-date as of early September 2026, and annualised net interest costs estimated at over $1.1 trillion, now surpassing the entire defence budget.
The rollover mechanics underneath that interest figure matter as much as the total: the weighted average rate on marketable Treasuries sat near 3.45% as of mid-2026, meaning every maturing legacy security that reprices at today’s yields widens the gap between the current interest bill and the eventual steady-state cost.
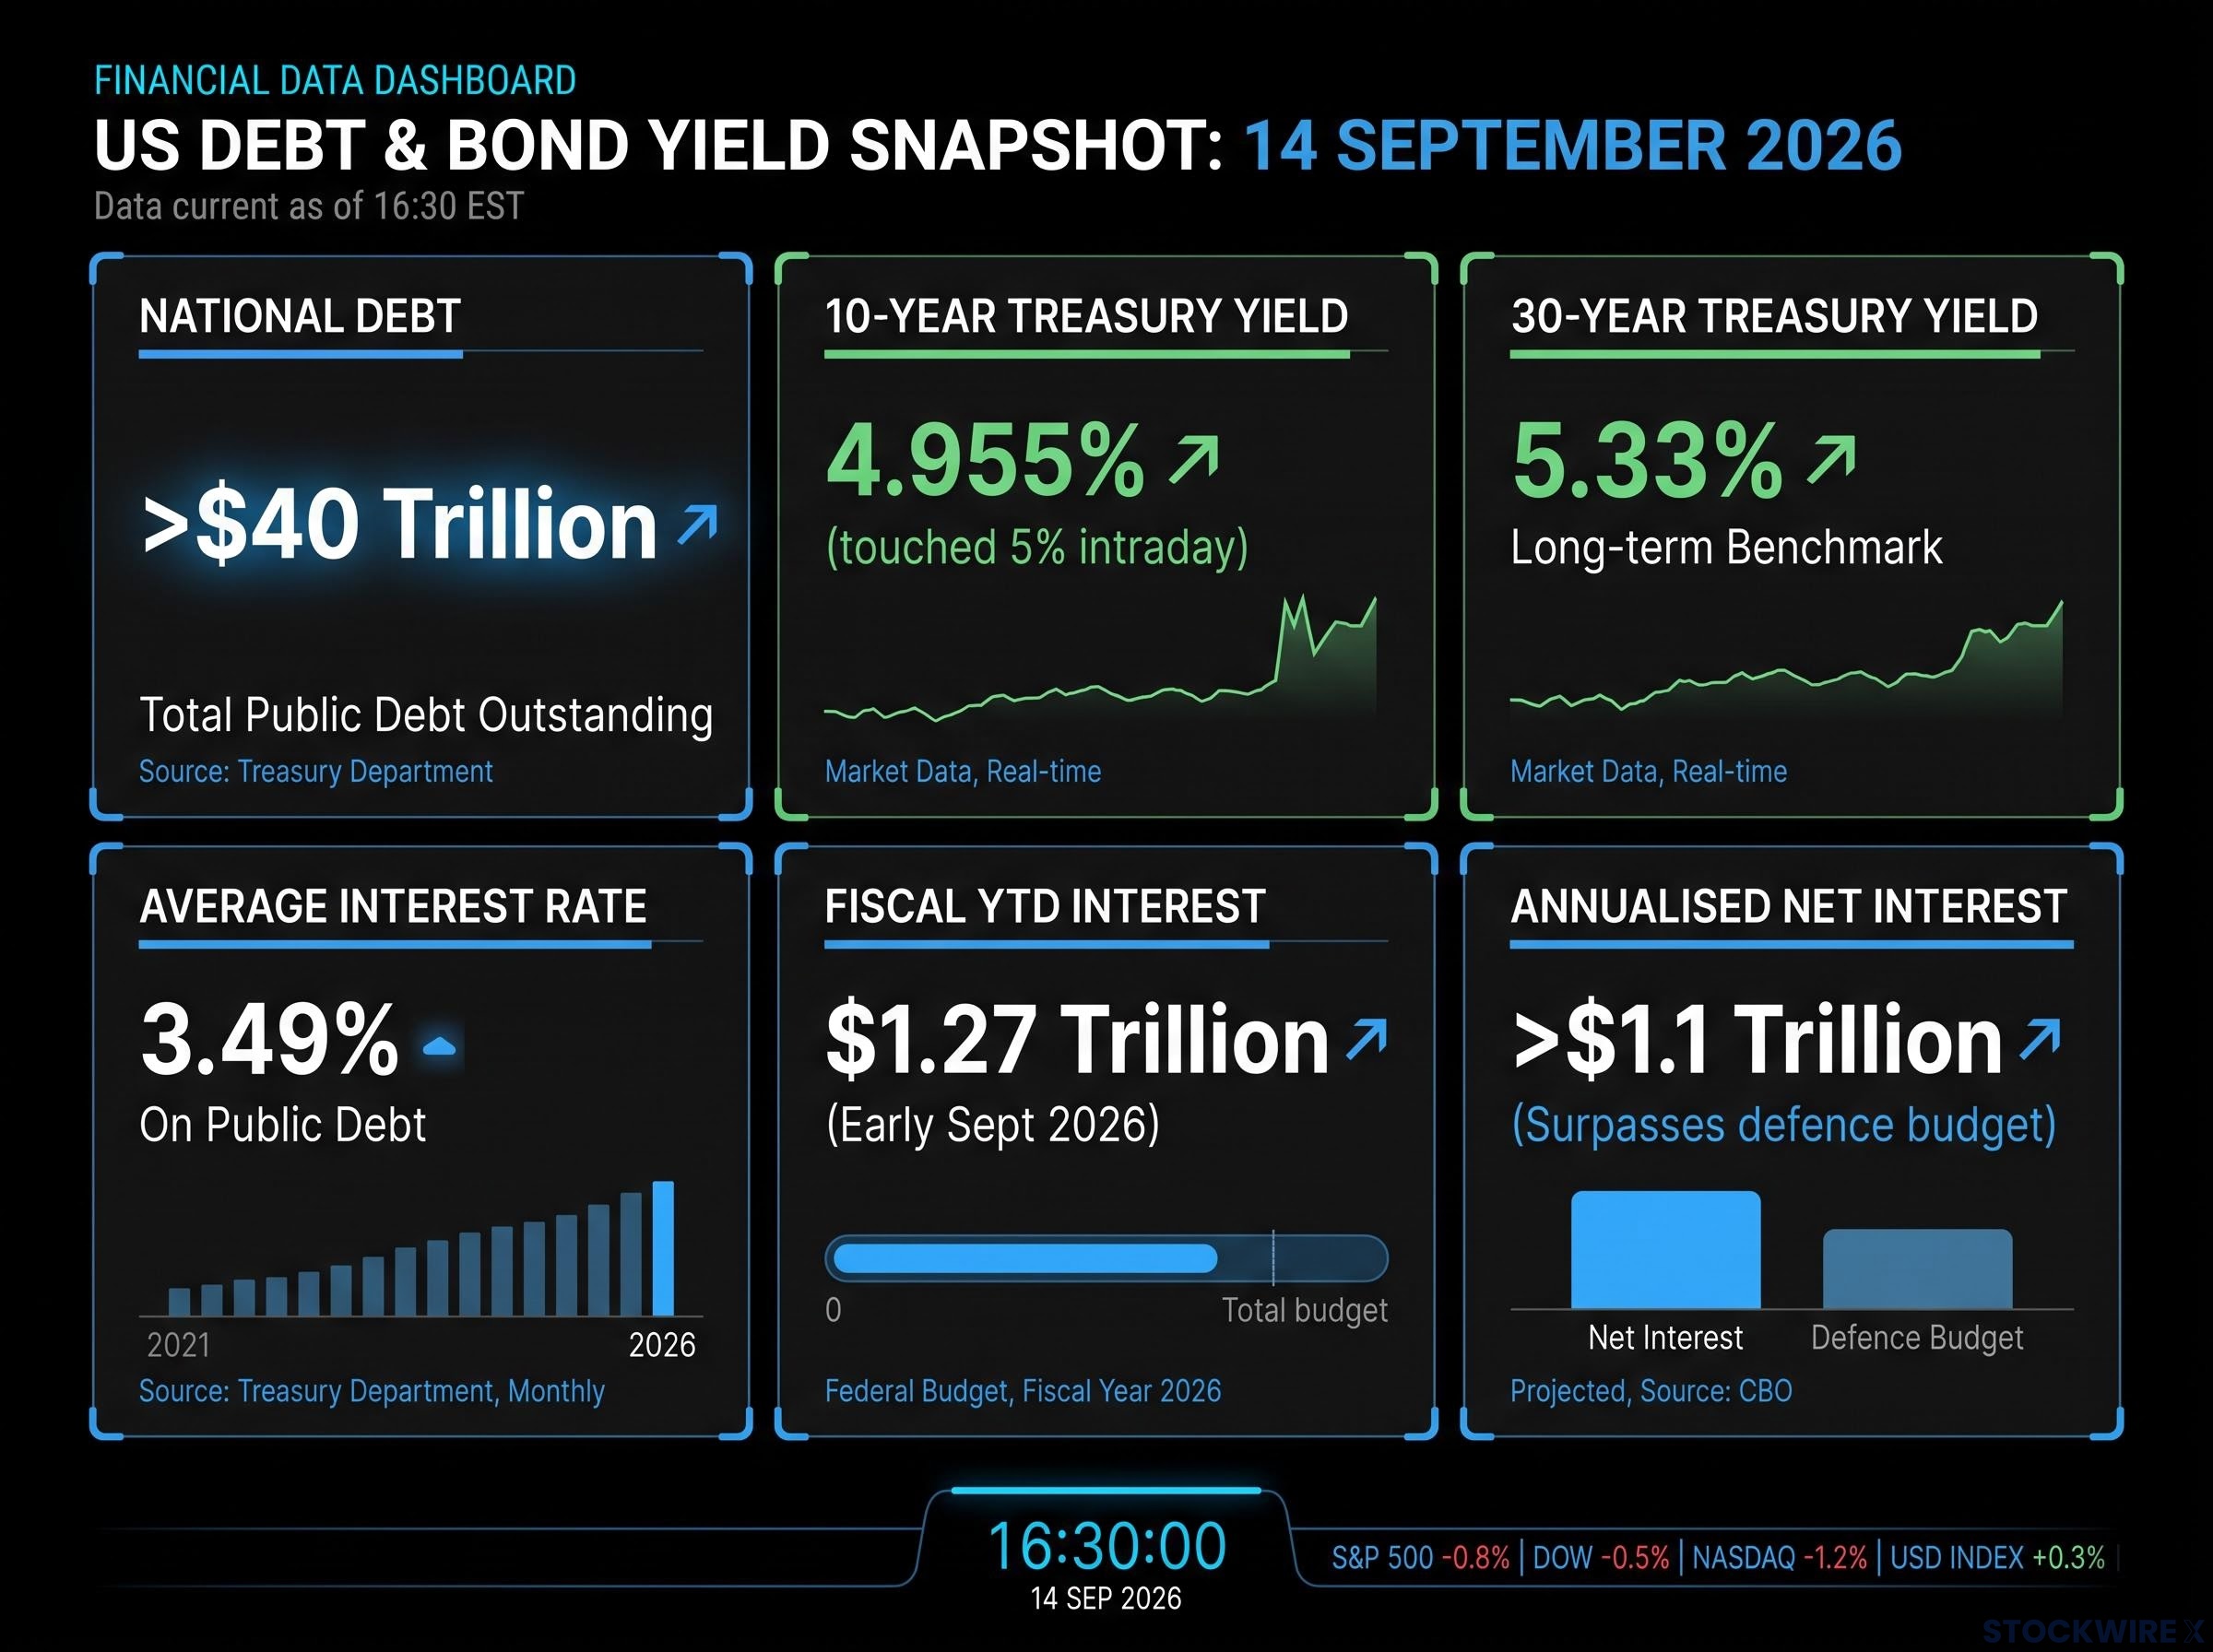
That last figure is where the spiral tightens. When interest alone exceeds defence spending, every basis point of yield increase on $40 trillion compounds the mandatory-spending problem from the first section, because interest is itself mandatory.
The disciplinarian In an op-ed dated 24 August 2026, Stanley Druckenmiller argued that Bessent’s buybacks are an attempt to suppress long-term yields and mask the true cost of the national debt, positioning the 30-year yield as the market’s last remaining mechanism for enforcing fiscal discipline.
For you as an investor, the read is this. Yields at this range carry direct implications for anyone holding duration, and because the move is driven by structural fiscal math rather than temporary sentiment, it changes how you should think about Treasury exposure and dollar-denominated allocation more broadly.
Divergent institutional verdicts: solvency crisis or high-risk but manageable path?
This is not alarmists versus optimists. It is two internally coherent frameworks reading the same data and reaching different conclusions about timing.
The crisis-proximate case runs as follows:
- The resort to buybacks is evidence the Treasury cannot sell bonds at natural market rates.
- Net interest above $1.1 trillion already exceeds defence spending and is squeezing everything non-mandatory.
- Erosion of foreign confidence, prompting diversification away from Treasuries and the dollar, is now a directional trend rather than a tail risk.
The high-risk-but-manageable case is equally structured:
- In its 2026 Article IV Consultation, the IMF projects the general government deficit staying in the 7-8% of GDP range and general government debt reaching around 140% of GDP by 2031, yet explicitly states the risk of outright sovereign stress remains low, citing deep financial markets, reserve-currency status, and strong institutions.
- A 28 August 2026 Wall Street Journal piece argued that modest buybacks do not fundamentally distort price discovery in a market as deep and liquid as US Treasuries.
- The Bipartisan Policy Center treats the trajectory as unsustainable but correctable, noting CBO baseline revenues are projected above historical norms, which makes policy-driven solvency achievable through reform.
Your practical takeaway is that both sides concede the trajectory is dangerous. The disagreement is whether institutional and political systems act before market discipline forces the issue, and that single distinction changes which investment time horizon matters to you.
What would shift the balance: conditions that would move the IMF toward the crisis assessment
Watch for observable signals rather than theoretical thresholds. A sustained 30-year yield above 5.5%, a measurable reduction in foreign central bank Treasury holdings, or a failed Treasury auction would each pressure the manageable-path camp to revise.
None of these is abstract. Each shows up in data you can track, which is what makes them useful signposts rather than talking points.
What the data tells informed investors to watch from here
Three dynamics make this cycle structurally different from prior deficit scares. The spending-revenue growth asymmetry widens the gap regardless of the economy. The Treasury intervention escalation signals constraint rather than choice. And the bond market’s pricing suggests professional investors have moved from concern to conviction.
This will not be settled by a single announcement or data release. It will be settled by the accumulation of signals over time.
Here is your monitoring checklist:
- The 30-year yield. A sustained move above 5.5%, Druckenmiller’s own signpost, would mark the market escalating its verdict.
- Foreign holdings data. A measurable contraction in foreign central bank Treasury holdings would confirm the diversification thesis is real.
- Language, not just action. Any formal shift from buyback framing toward explicit yield-target framing from the Treasury or Fed would mark the line into YCC being crossed.
The correctable path remains genuinely open. If CBO’s revenue projections hold and Congress enacts structural spending reform, the trajectory bends, and the IMF’s 140% of GDP debt figure for 2031 becomes a ceiling rather than a waypoint.
For investors wanting to translate this framework into specific positioning decisions, our deep-dive into Bessent’s informal yield curve control examines why the 5-to-10-year belly of the curve offers better risk-adjusted exposure than the long end under current intervention mechanics.
The current-law destination Absent reform, CBO projects federal debt held by the public reaching 156% of GDP by 2055. That is not a forecast of crisis. It is simply where the current rules lead if nothing changes.
This article is for informational purposes only and should not be considered financial advice. Investors should conduct their own research and consult with financial professionals before making investment decisions.
Past performance does not guarantee future results. Financial projections are subject to market conditions and various risk factors, and forward-looking statements are speculative and subject to change based on policy and market developments.