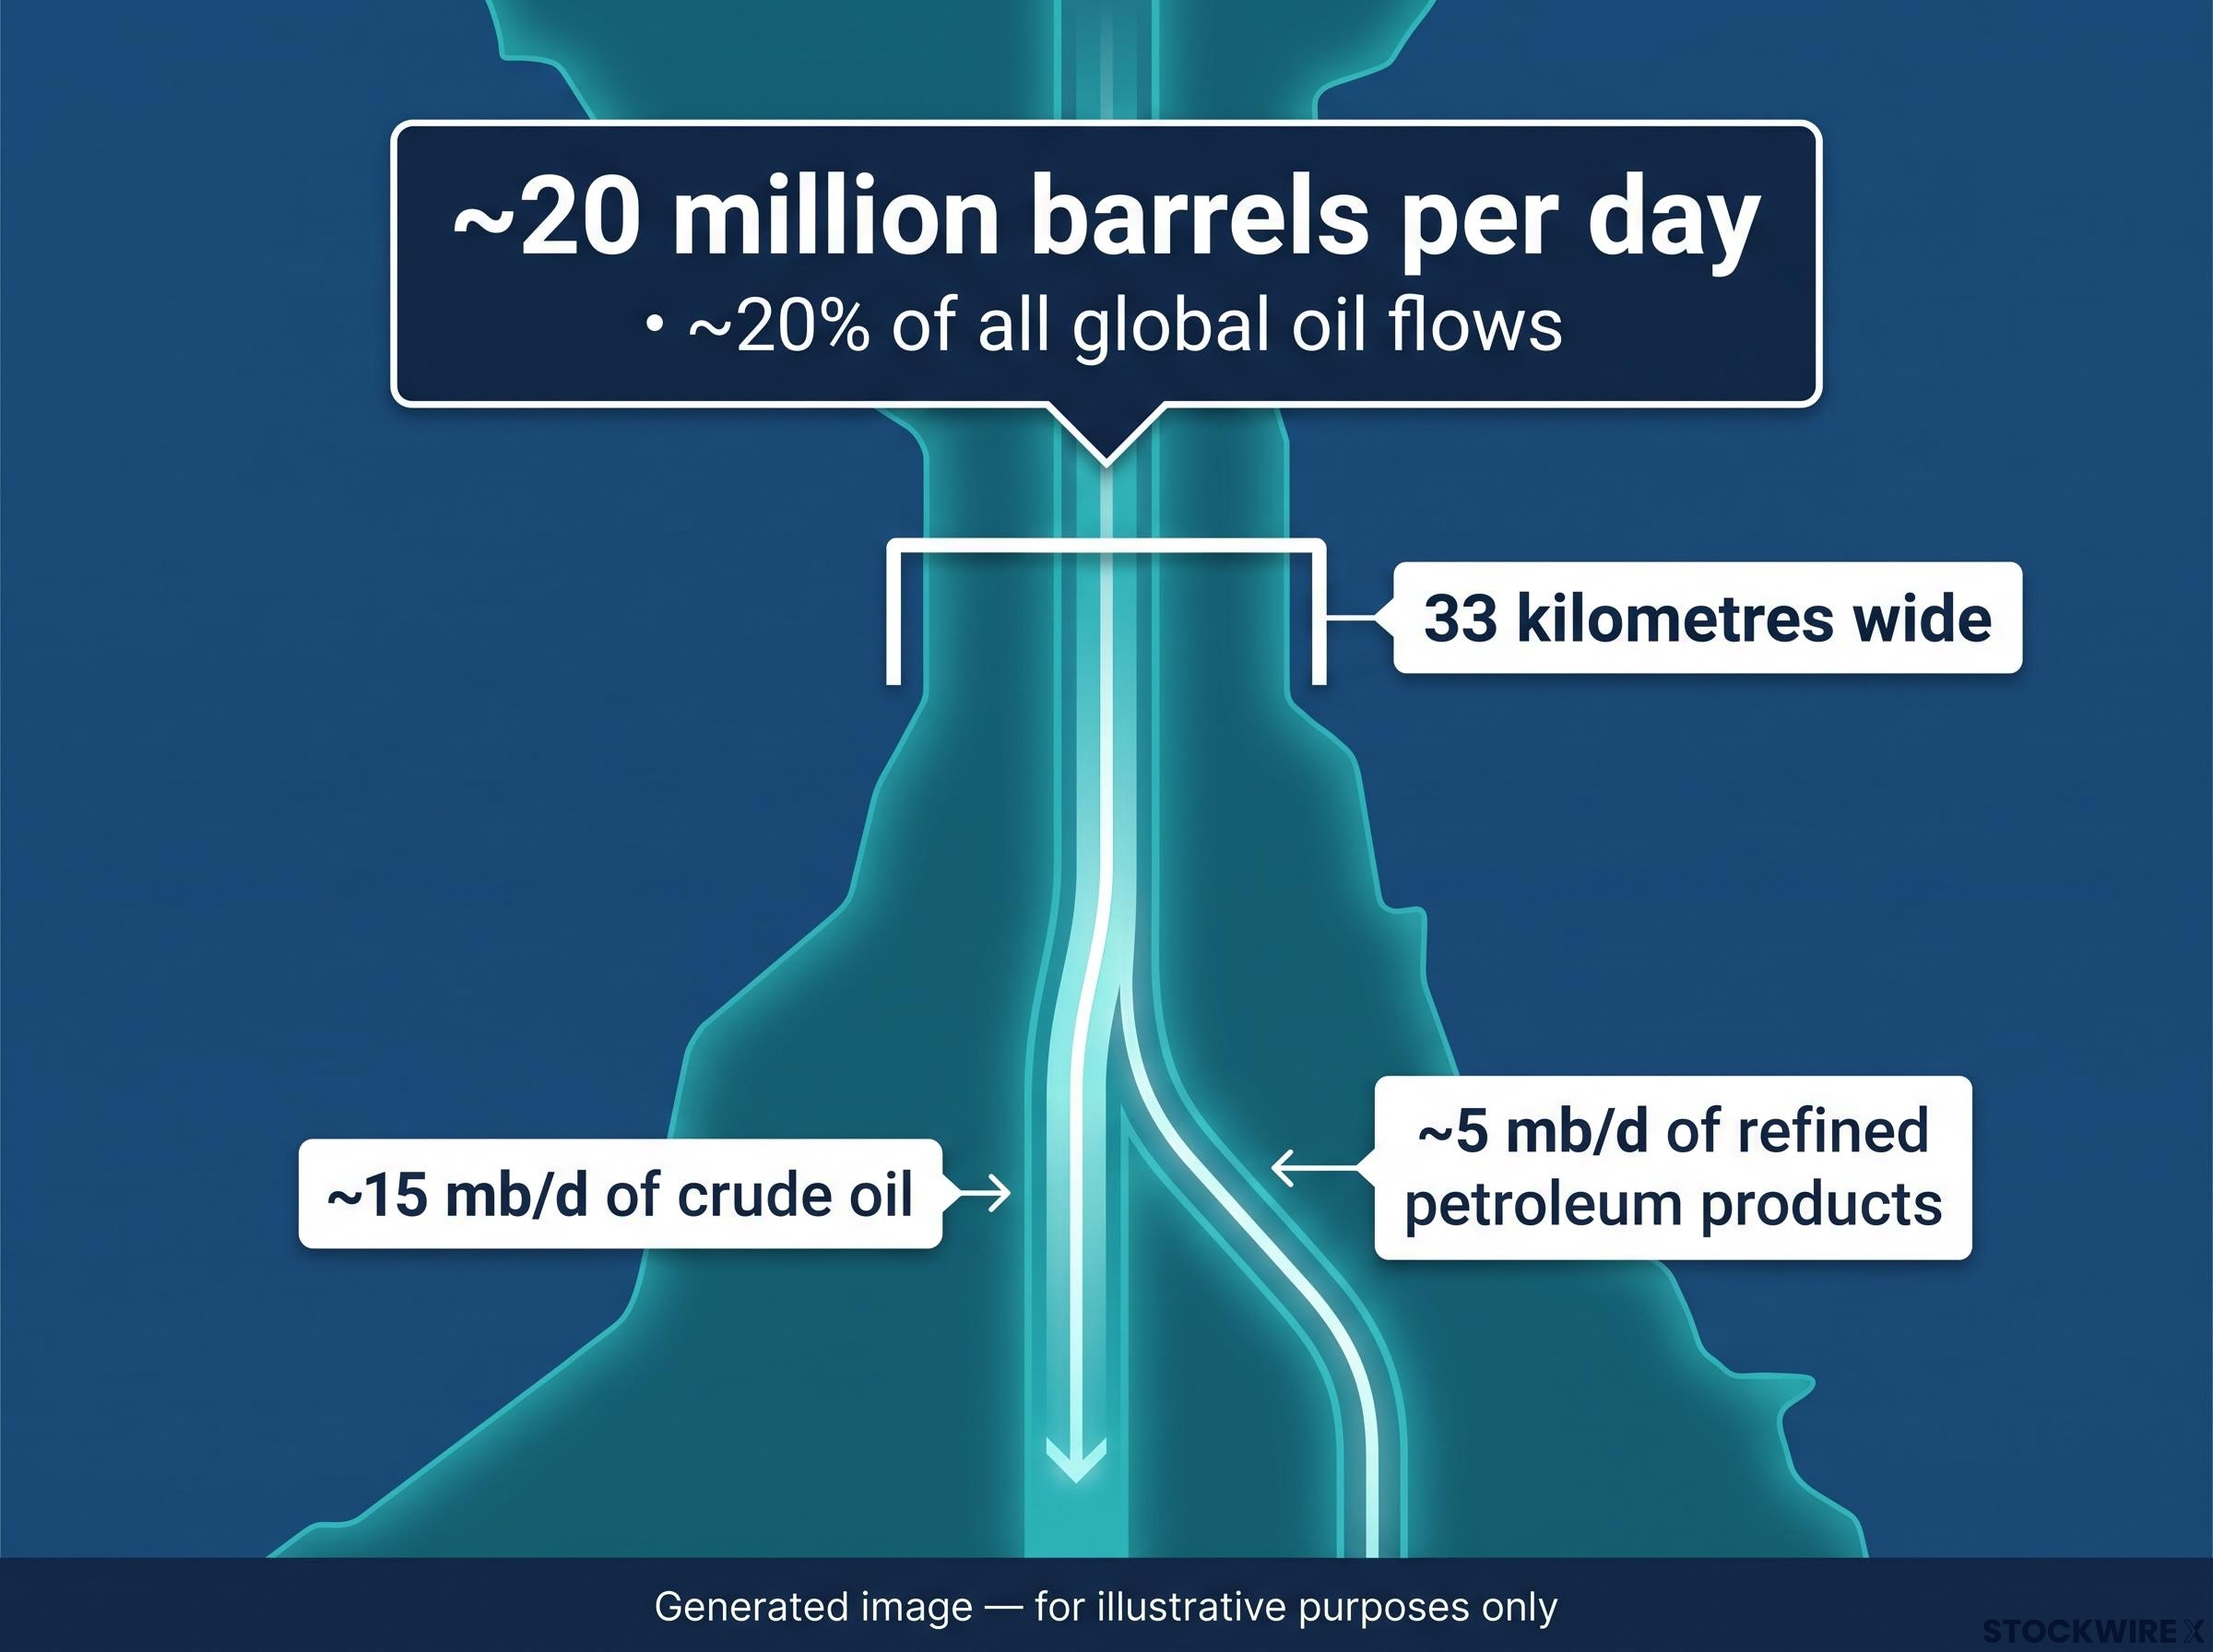
On a normal day, roughly one in every five barrels of oil traded globally squeezes through a waterway narrower than some city harbours. The Strait of Hormuz, a chokepoint between Iran and Oman barely 33 kilometres wide at its narrowest shipping lane, carries approximately 20 million barrels per day of crude and refined products. That waterway is now, effectively, closed.
The International Energy Agency’s (IEA) July 2026 report arrived last month and confirmed what traders had already priced in: supply, demand, refinery throughput, and inventories all moved in an adverse direction simultaneously. That kind of four-pillar deterioration does not happen during ordinary disruptions. It happens when the global oil market is under structural siege, and it matters to anyone exposed to fuel costs, energy equities, or the growth assumptions underpinning broader portfolios.
Here is what the data actually tells you about which specific numbers to watch, why the standard assumption that demand destruction eventually rebalances markets is failing this time, and how to read the difference between a crisis that is easing and one that is entrenching.
How closing one strait removed a fifth of the world’s oil supply
The Strait of Hormuz is not one trade route among several. For Saudi Arabia, Iraq, Kuwait, Qatar, and the UAE, it is the route. The numbers that define its normal role are worth sitting with:
- ~15 mb/d of crude oil transits the strait daily
- ~5 mb/d of refined petroleum products
- ~20% of all global oil flows
- A comparable share of global liquefied natural gas (LNG) trade
One in every five barrels of oil consumed worldwide passes through the Strait of Hormuz on a normal day.
When conflict and security risks shut tanker traffic through the strait in early 2026, the immediate question was whether Gulf producers could simply reroute. The answer, within weeks, was no. Saudi Arabia’s East-West pipeline to the Red Sea and limited alternative terminal capacity provide partial relief, but they cannot replicate the strait’s throughput. Onshore storage filled. Producers ran out of places to send oil that could not transit, and output was curtailed.
According to IEA data, global oil output stood at 101.5 mb/d in July 2026, a figure that sat well beneath where it had been twelve months prior. Estimates suggest somewhere in the range of 10-14 mb/d of Gulf crude and condensate has been forced offline, though that range has not been independently verified at the upper end. The barrels exist. The upstream capacity is intact. But the oil is stranded, and that is why prices have not self-corrected despite every incentive to produce.
OPEC spare capacity of roughly 0.5 million barrels per day is negligible relative to the scale of current disruptions, a constraint that reflects a deeper structural shift: the cartel’s share of global crude production has declined from more than 50% historically to approximately 27-28% following the UAE’s formal withdrawal on 1 May 2026, leaving U.S. output at 13.2 million barrels per day as the dominant swing producer.
When big ASX news breaks, our subscribers know first
What the IEA’s July data actually tells us about the four pillars of tightness
What makes the July 2026 IEA report different from a standard monthly update is that it recorded simultaneous deterioration across every variable that matters. This is not a supply shock with offsetting demand weakness. It is a system-wide compression where each pillar reinforces the others.
| Pillar | July 2026 figure | Year-on-year change | Direction |
|---|---|---|---|
| Supply | 101.5 mb/d | Well below prior year | Tighter |
| Demand forecast | Revised down ~510,000 b/d | -1.6 mb/d full-year decline projected | Weaker, but insufficient offset |
| Refinery throughput | 80.9 mb/d | Nearly 5 mb/d below prior year | Tighter |
| Inventories | -69 million barrels (July draw) | Sharp decline from already low base | Tighter |
The demand side is where the “this will self-correct” argument runs into trouble. Yes, the IEA cut its 2026 demand forecast by approximately 510,000 b/d, and full-year consumption is now projected to decline by 1.6 mb/d year on year. Higher prices and weaker growth are doing their work. But 1.6 mb/d of demand destruction does not offset a supply disruption measured in the tens of millions. The gap remains structurally wide.
Refinery constraints and inventory drawdowns: the downstream amplifiers
Refineries face a dual squeeze. Crude feedstock from the Gulf is unavailable or severely reduced, while the crude they can source costs significantly more because benchmarks have risen. The result: crude throughput at refineries came in at 80.9 mb/d during July 2026, a level running roughly 5 mb/d short of what refiners processed in the same period a year earlier, with additional reductions to third-quarter run rates expected on top of that already diminished base.
That throughput gap means the disruption is not staying upstream. It is propagating directly into gasoline, diesel, and jet fuel markets, the refined products that affect transport costs, logistics pricing, and what consumers pay at the pump. Global observed inventories shed 69 million barrels across July, functioning as the market’s primary balancing mechanism: in the absence of adequate new supply, the system is drawing down stored reserves to bridge the gap.
Why inventories are disappearing and what backwardation tells the market
That 69 million barrel drawdown in a single month is the number that quantifies how the market is bridging the gap between available supply and consumption. It is not a sign of adjustment. It is a sign that the buffer is eroding.
Emergency reserve releases totalling approximately 280 million barrels from strategic petroleum reserves and IEA coordinated draws have failed to halt the inventory drawdown, with global stocks drawing at 8.5 million barrels per day during Q2 2026 and usable buffer estimated by JPMorgan at around 800 million barrels, a figure that contextualises the scale of the July 69 million barrel single-month draw.
The futures market is confirming this physical stress through a structure called backwardation, where near-dated contracts trade at a premium to longer-dated ones. In plain terms, backwardation means traders are willing to pay more for oil delivered now than oil delivered in six months. It signals fear of short-term scarcity rather than confidence in future oversupply.
Federal Reserve research on oil backwardation mechanics links the convenience yield embedded in near-term crude contracts directly to inventory stress, finding that spot prices revert to futures levels only once physical scarcity signals dissipate, a dynamic that reinforces why the current term structure is not self-correcting.
The mechanics work in three steps:
- Prompt scarcity premium: Buyers bid up near-term contracts because physical barrels are hard to source today
- Carrying cost magnification: Storing oil becomes financially punishing when near-term prices exceed future prices, because holders lose money by waiting
- Inventory rebuild disincentive: Because storage is unprofitable, commercial operators drain existing stocks rather than accumulating new ones, which perpetuates the tightness
BNY (Bank of New York Mellon) has identified backwardation in crude markets as reinforcing upward price momentum alongside geopolitical uncertainty, creating a self-sustaining cycle of tightness.
Brent has traded in the high $80s per barrel, with single-day gains of approximately 5% on negative diplomatic headlines, though the precise magnitude of individual sessions has not been independently verified. What matters for you is the signal: a deeply backwardated curve is the market’s collective judgement that short-term supply relief is not expected. If you are waiting for inventories to rebuild before prices ease, the term structure is telling you the market itself is not betting on that outcome.
The uncertainty premium: why U.S.-Iran diplomacy is the price signal no chart shows
The measurable variables, supply shortfalls, refinery cuts, inventory drawdowns, account for much of the current price level. But embedded within Brent and WTI sits a component that no single data series captures: the diplomatic uncertainty premium.
BNY reports that uncertainty around a prospective U.S.-Iran agreement is contributing to heightened anxiety over oil supply availability, with skepticism surrounding any potential deal intensifying rather than easing as of the July 2026 reporting period.
This is not background noise. Markets are pricing disruption duration in quarters, not weeks, because no credible diplomatic pathway has emerged. Both sides have exchanged demands for compensation and political guarantees without producing a framework for resolution, though specific timelines for any potential deal remain unconfirmed by independent sources.
The consequences are observable. Demand for options and hedging structures that protect against further price spikes remains elevated. Traders and end-users are reluctant to position for a sustained price decline without credible reopening signals. The absence of any positive diplomatic resolution being priced into current benchmarks means that any concrete signal, whether a mediator statement, a venue announcement, or a back-channel report, will move Brent and WTI more sharply than most supply-side data releases. Diplomatic news flow is now a primary price driver, not peripheral commentary, and that repositions geopolitical monitoring as analytical work rather than optional context.
Six indicators that will tell you if this crisis is easing before the headlines do
By the time a sustained price decline makes the evening news, the following six indicators will have already signalled it. Monitoring them is how professionals track this crisis rather than reacting to price moves after the fact.
- Strait of Hormuz tanker AIS traffic. Vessel tracking data reveals actual physical resumption of transit, not diplomatic claims. Even partial tanker flows would signal incremental supply relief and trigger rapid repricing.
- U.S.-Iran diplomatic signals. Official statements, mediator communications, and back-channel reporting directly reprice the perceived probability of reopening. BNY flags this as the primary driver of current market anxiety.
Five observable verification signals for a genuine reopening, including a formal signed agreement, an independent verification regime, and mine-clearance completion estimated at 40-50 days, remain unmet as of early August 2026, which is why Brent above $90 continues to carry a material geopolitical risk premium rather than pricing any deal as real.
- IEA and OPEC monthly reports. These remain the authoritative quantitative checkpoints for whether the four-pillar compression (supply, demand, refinery throughput, inventories) is easing or worsening. The July 2026 IEA report establishes the current baseline.
- Brent and WTI futures term structure and options skew. Changes in backwardation depth and implied volatility provide real-time readouts of how long the market expects disruption to persist. A flattening curve signals expectations shifting toward normalisation.
- Regional inventory data. EIA data for the U.S. and equivalent agency data for Europe and Asia gauge how much buffer remains. The 69 million barrel July drawdown establishes the deterioration baseline; any deceleration in the drawdown pace is an early positive signal.
- Spare capacity activation and demand-side structural responses. Evidence of alternative supply sources coming online outside the Gulf, alongside fuel switching and efficiency gains by consumers, would indicate the system is adapting rather than merely depleting reserves.
What changes when the strait reopens, and what stays broken
Physical reopening of the Strait of Hormuz is the single largest potential catalyst for lower prices. But reopening and normalisation are not the same thing.
The recovery has three distinct layers, and they move at different speeds:
- Diplomatic risk premium unwind (fast): A credible ceasefire or agreement would reprice the uncertainty component of Brent and WTI within days, potentially shaving dollars per barrel as hedging demand drops and speculative short positions build
- Physical supply restoration (medium): Tanker flows resuming, producers restarting curtailed output, and pipelines returning to full capacity takes weeks to months, not hours
- Inventory rebuilding (slow): The 69 million barrel hole punched in global stocks during July alone, on top of months of prior drawdowns, requires sustained surplus production to refill, a process measured in quarters
The risk premium unwinds faster than the physical market repairs. A deal announcement will reprice expectations sharply, but the barrels, the refinery runs, and the inventories will not catch up for months. The price path after a diplomatic breakthrough will be volatile and non-linear, not a straight decline.
There is also a structural residue. Demand responses triggered by elevated prices, including fuel switching, efficiency investments, and supply chain reconfigurations, do not fully reverse when prices fall. The demand baseline that emerges on the other side of this crisis will be different from the one that existed before it.
Iran’s proposed 7% cargo-value levy, which would cost approximately $11.2 million per VLCC crossing, introduces a structural risk distinct from the current closure: a permanent control regime over strait transit would embed a geopolitical surcharge into global energy prices even after physical flows resume, changing the post-reopening price baseline that investors are currently modelling.
The July 2026 IEA data is the measurement point from which any recovery must be benchmarked: 101.5 mb/d of supply, 80.9 mb/d of refinery throughput, and a 69 million barrel monthly inventory drawdown. Those are the numbers that need to move in the opposite direction before this market is genuinely healing. Until they do, the disruption is not over simply because a headline says it might be.
This article is for informational purposes only and should not be considered financial advice. Investors should conduct their own research and consult with financial professionals before making investment decisions. Past performance does not guarantee future results. Financial projections and forward-looking statements referenced in this analysis are subject to market conditions, geopolitical developments, and various risk factors.