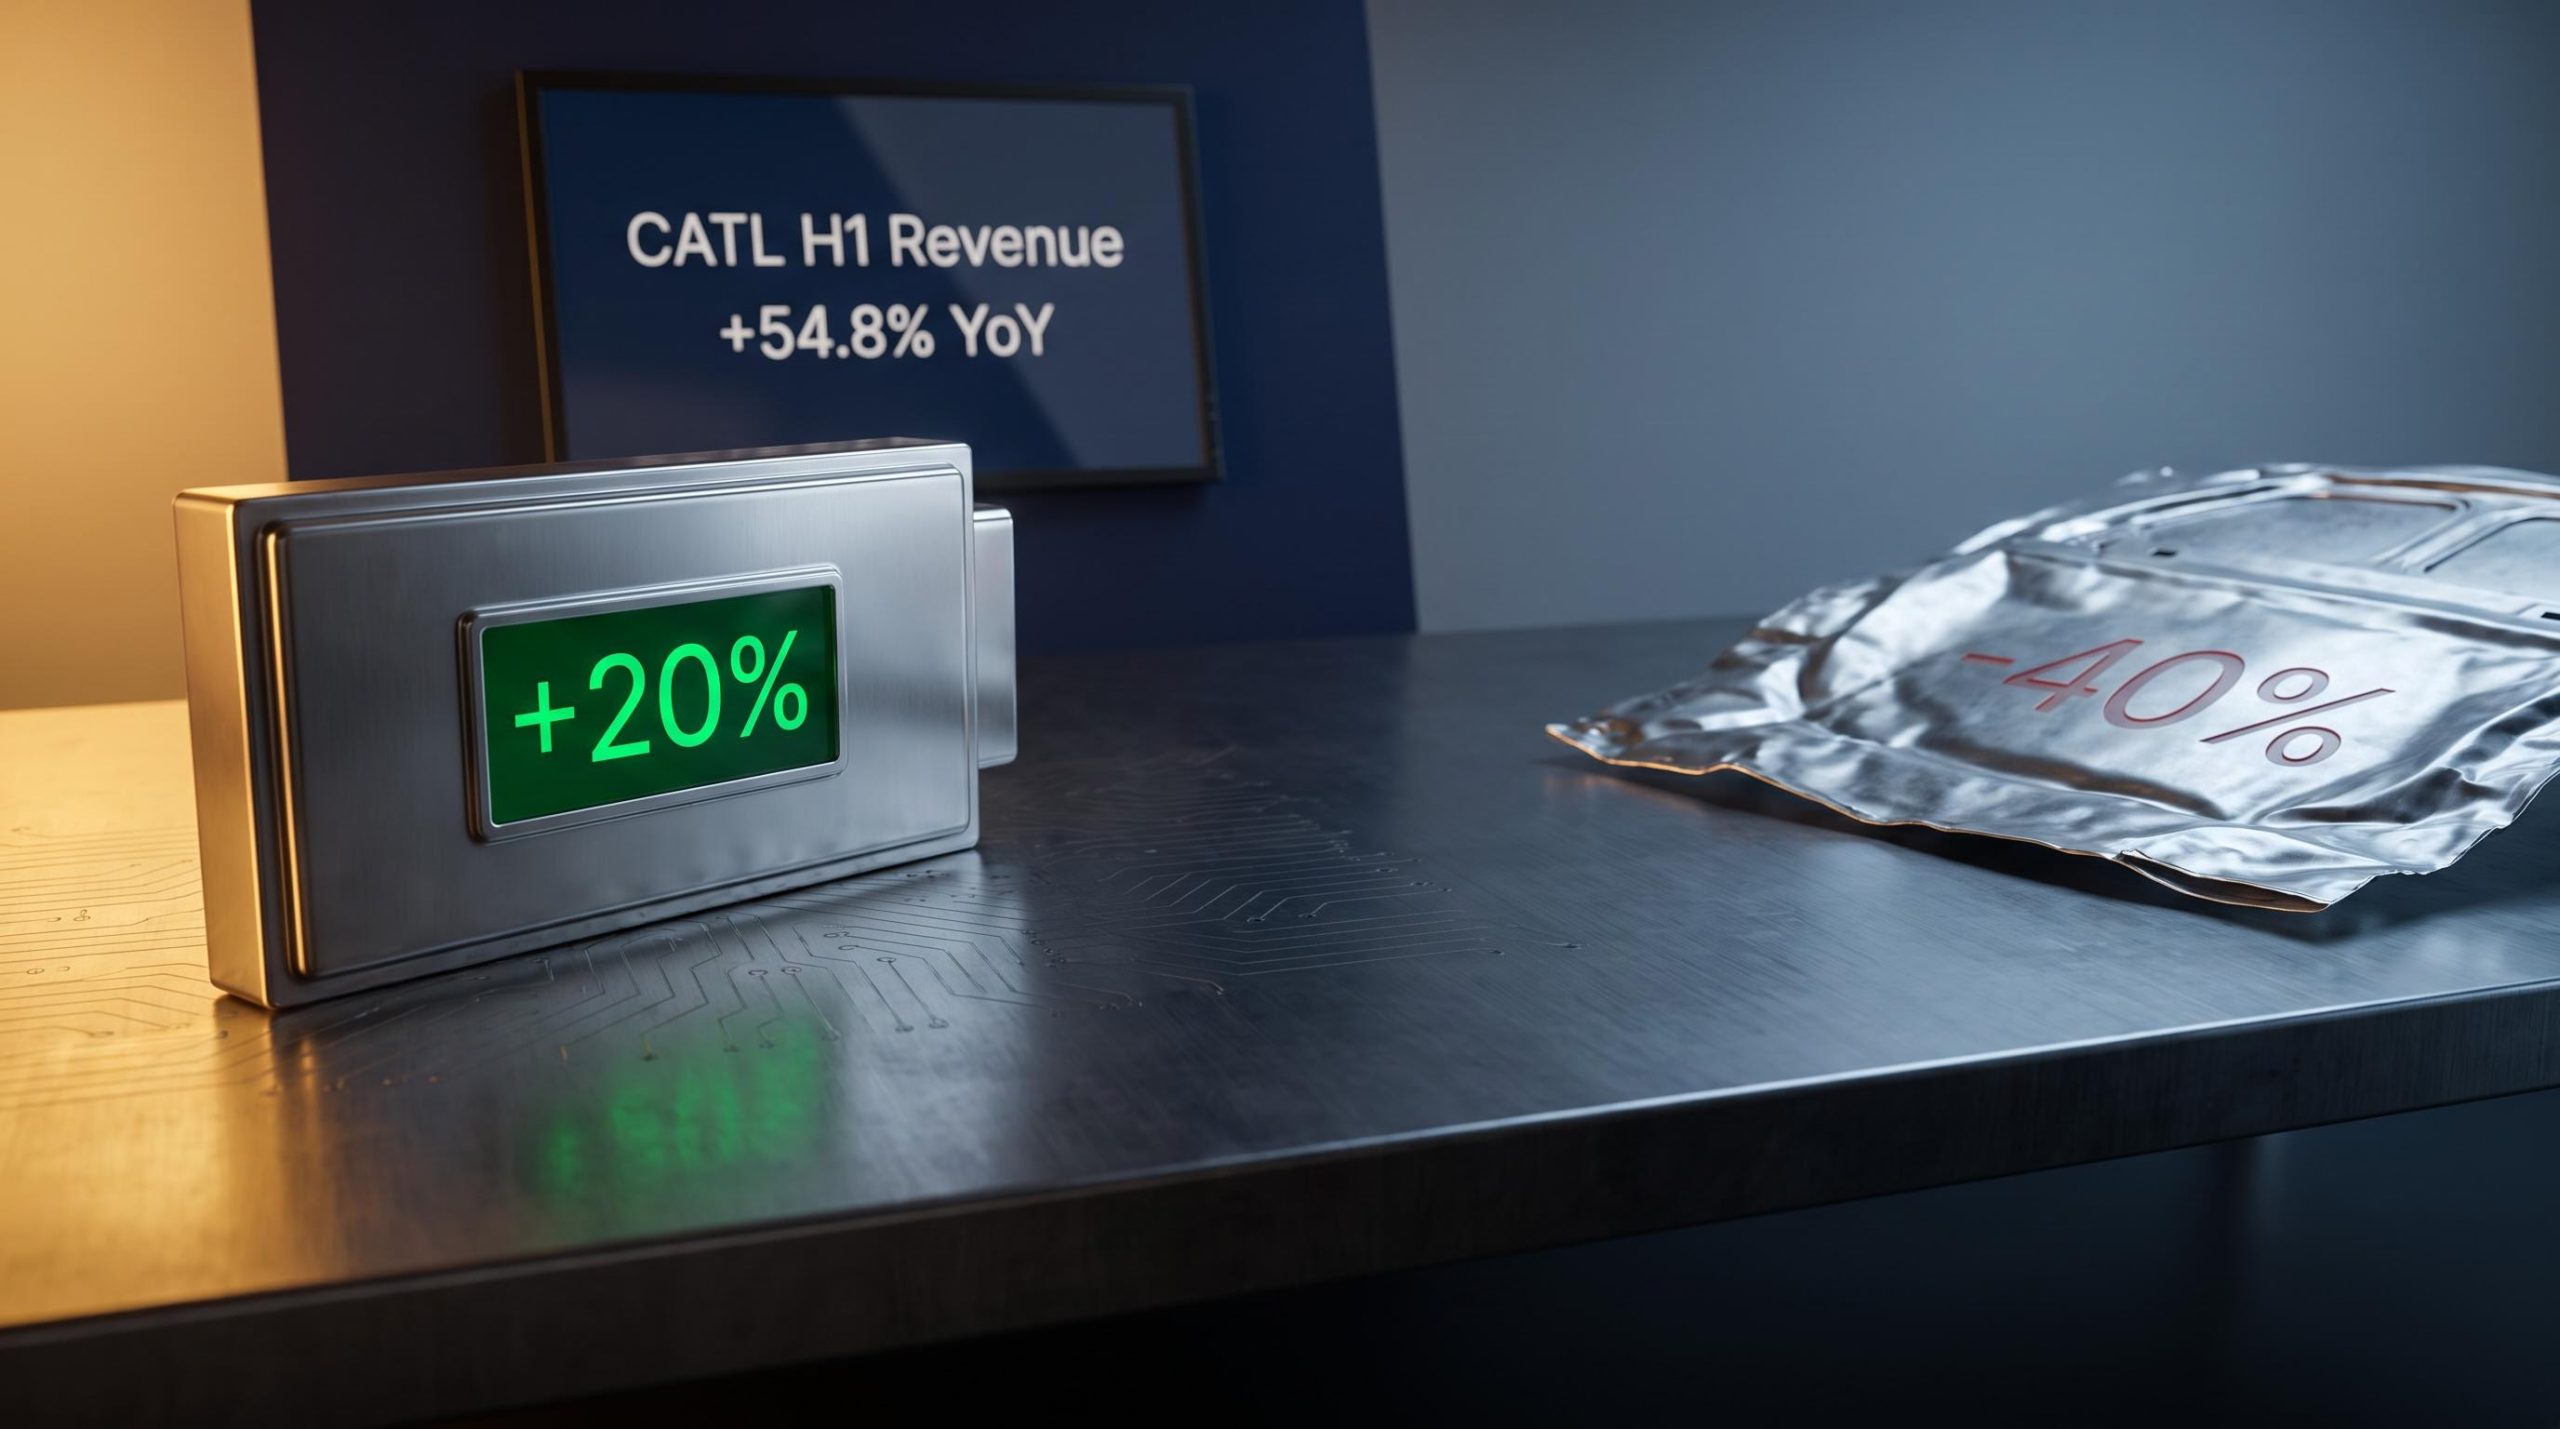
Global electric vehicle sales hit record levels in 2026. EV automaker stocks across the broad market have shed roughly 20% so far this year, with certain names such as Xpeng losing close to 40% of their value. The gap between those two sentences is the entire article.
The timing sharpens the question. BYD, the world’s largest EV manufacturer by volume, reports earnings today (28 August 2026), offering a live test of whether record production translates into meaningful profit. Analyst consensus figures point to low-single-digit operating margins on revenue of around 210 billion CNY, and that picture is instructive even before the official numbers land.
Here is what the divergence actually tells you about where value is being created, and why that matters before you make any EV-related investment decision.
Booming EV demand, yet a market downturn: the central contradiction
Start with the numbers, because the numbers refuse to cooperate with each other. Global EV unit sales are at record highs in 2026. Consumer adoption is accelerating across every major market. And yet the equities of the companies building those cars have gone in the opposite direction.
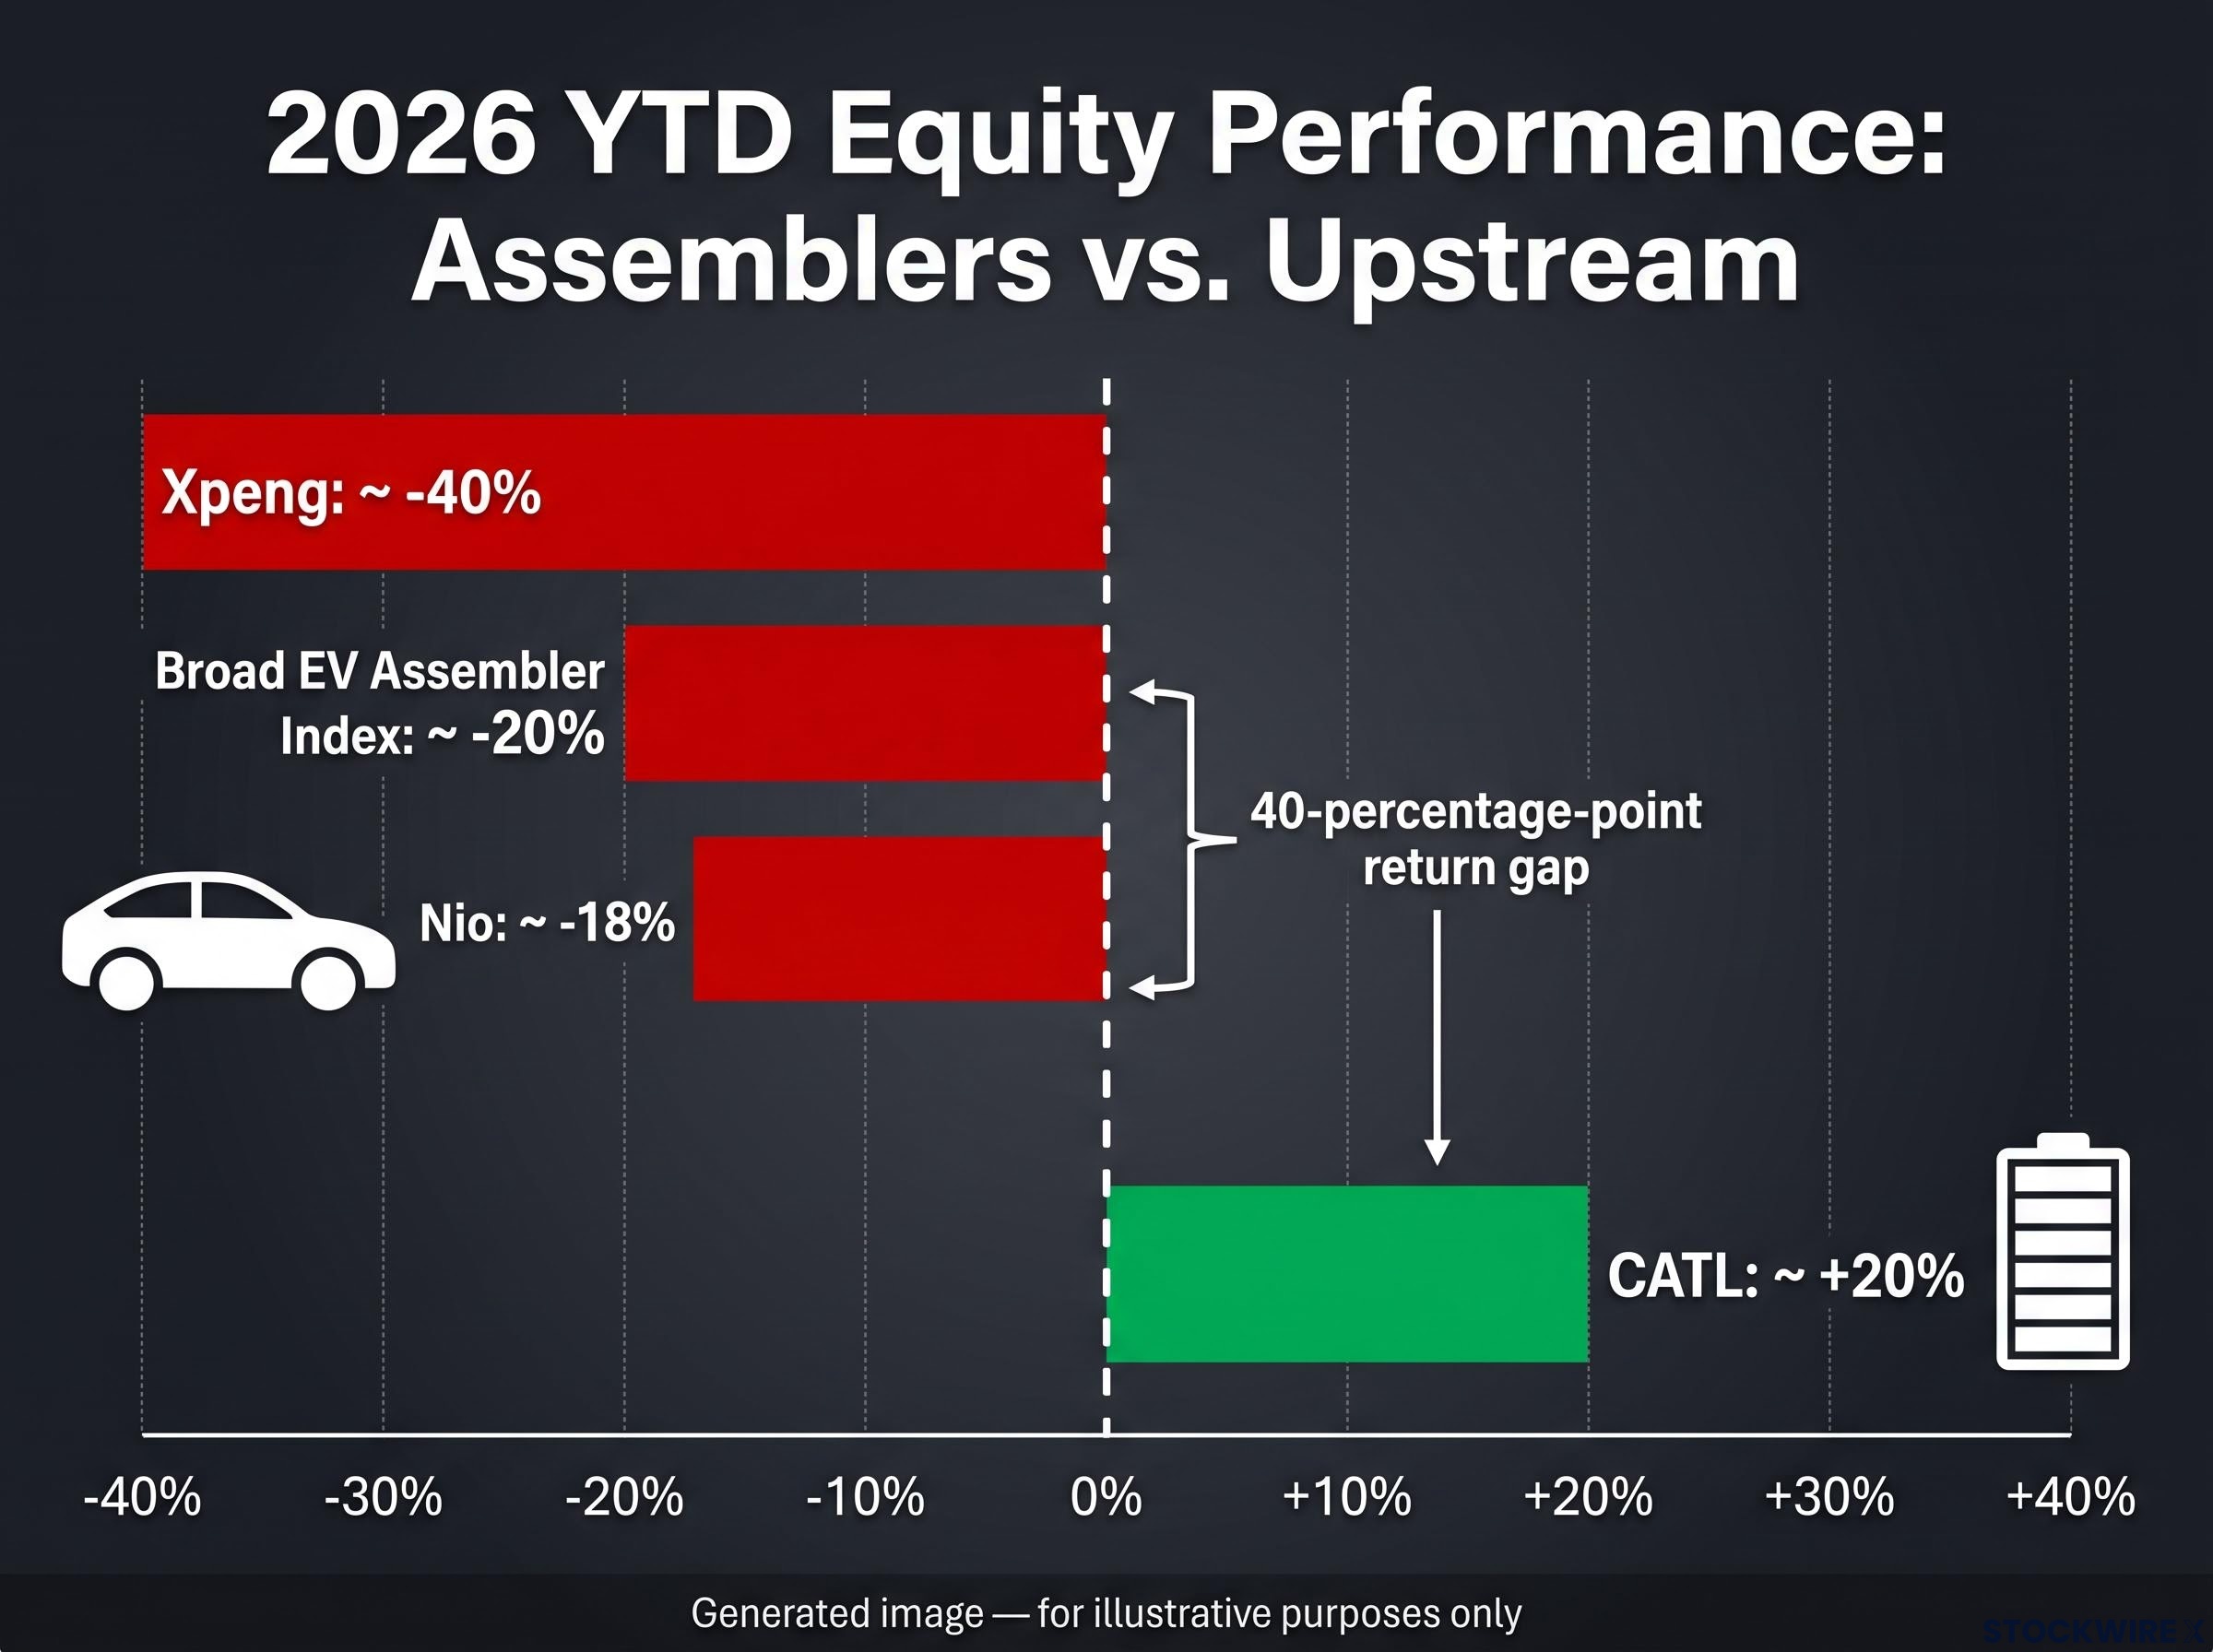
EV automaker indices spanning the US and China have fallen around 20% year-to-date, even while global EV unit volumes have reached all-time highs in 2026.
The decline is not confined to a single market or a single weak name. It is structural and widespread:
- Nio: year-to-date loss of roughly 18%
- Xpeng: year-to-date loss of roughly 40%
- Rivian: tracking lower alongside sector peers
- Polestar: tracking lower alongside sector peers
Chinese pure-play makers, Western pure-play makers, large-cap and small-cap: the pattern holds. The problem is not demand. Consumers are buying EVs in record numbers. The problem is what happens to economics between the factory gate and the income statement.
That gap between record unit demand and negative equity returns tells you something specific: buying into an industry’s growth story and buying into its shareholder returns are two completely different bets. Conflating them is the most common mistake in EV investing right now. Understanding the source of the gap is the prerequisite for any future position in this sector.
The EV sector is a textbook case where a genuine macro trend has not translated into broad equity returns, precisely the dynamic a thematic investing framework is designed to diagnose before capital is committed rather than after.
When big ASX news breaks, our subscribers know first
Why assembling cars is a structurally difficult business to profit from
The cost architecture of EV manufacturing works against the equity investor at almost every level. Three structural layers compress margins simultaneously:
- Capital intensity: EV factories require enormous upfront investment, and production lines need continuous reinvestment as battery chemistries and vehicle platforms evolve.
- Heavy and sustained R&D spend: Automakers must fund software development, battery management systems, and autonomous driving capabilities alongside traditional vehicle engineering.
- Rapid product cycles: Consumer expectations shift quickly, and competitors launch new models at an accelerating pace, shortening the window to recoup development costs on any single platform.
Each of those cost layers would be manageable if automakers could price their vehicles with healthy margins. But EV manufacturing operates in a consumer market where price is the primary competitive lever. When multiple well-funded competitors all chase the same buyers, discounting becomes the default strategy.
Legacy automaker restructuring on the scale Volkswagen is executing, targeting up to 100,000 job cuts and the closure of multiple German plants, illustrates how the same margin compression pressures described here are forcing structural responses well beyond simple price adjustments.
When subsidies fade, price becomes the only lever
As government EV incentives are withdrawn in select markets, automakers face a binary choice: lose volume or cut price. Most have cut price. The result is a direct path from subsidy rollback to margin compression to equity underperformance.
The implication for you as an investor is that evaluating an EV automaker by revenue growth alone is analytically incomplete. The question that determines equity outcomes is how much of each marginal dollar of revenue survives as profit after the cost of competing. High volume does not automatically solve the margin problem when the competitive response to slowing growth is aggressive discounting.
BYD’s earnings today are a live test of whether scale can fix the margin problem
BYD occupies a unique position in this debate. It is the world’s largest EV manufacturer by volume. Its in-house control of battery production and key components spans the supply chain more deeply than any comparable assembler, which ought to provide a degree of cost insulation unavailable to most rivals. If any company can prove that scale converts into shareholder value at the assembly level, BYD is the one.
The consensus estimates ahead of today’s release tell you what the market expects from that best case:
| Metric | Consensus estimate | Context |
|---|---|---|
| Revenue | ~210 billion CNY | Massive top line, reflecting record unit volumes |
| EBIT | ~10 billion CNY | Low single-digit operating margin implied |
| EPS | ~0.85 CNY | Modest per-share earnings relative to revenue scale |
| Growth vs. prior period | Low-to-mid single digits | Growth has decelerated meaningfully |
| Implied operating margin | Low single digits | Even vertical integration has not widened this materially |
BYD’s Hong Kong-listed shares have been climbing into today’s print, a sign that at least a portion of the market is expecting the company to outperform forecasts. But even a modest beat does not fundamentally alter the margin profile. BYD controls its own batteries and key components, yet the profit conversion ratio remains thin.
When the most deeply integrated, highest-volume EV assembler on the planet is left with low-single-digit operating margins, every smaller or less integrated competitor faces a structurally harder challenge, not an easier one.
For you, BYD’s consensus figures mean that the ceiling for EV assembler margins, even under the most favourable structural conditions currently available, is narrow enough that almost any competitive or policy shock can erase the profit story entirely. Calibrate every other assembler-level investment against that ceiling.
EV assembler valuation limits become especially visible when a company like Tesla beats consensus on revenue and gross margin yet still faces a 188x forward P/E that can only be justified by AI and robotics ambitions rather than automotive earnings, a dynamic that mirrors the wider gap between EV demand narratives and equity returns.
Who’s profiting? CATL and the shift to upstream suppliers
While EV assembler stocks declined approximately 20% year-to-date, one company one step back in the value chain moved in the opposite direction.
CATL, the world’s largest EV battery manufacturer, has gained around 20% year-to-date, putting a roughly 40-percentage-point return gap between it and the broader EV assembler index.
That gap demands an explanation, and CATL’s first-half 2026 financials provide one:
| Company / Metric | Performance | What it reflects |
|---|---|---|
| Broad EV assembler basket (YTD) | Down ~20% | Margin compression from price competition |
| CATL (YTD) | Up ~20% | Pricing power and margin resilience at the battery level |
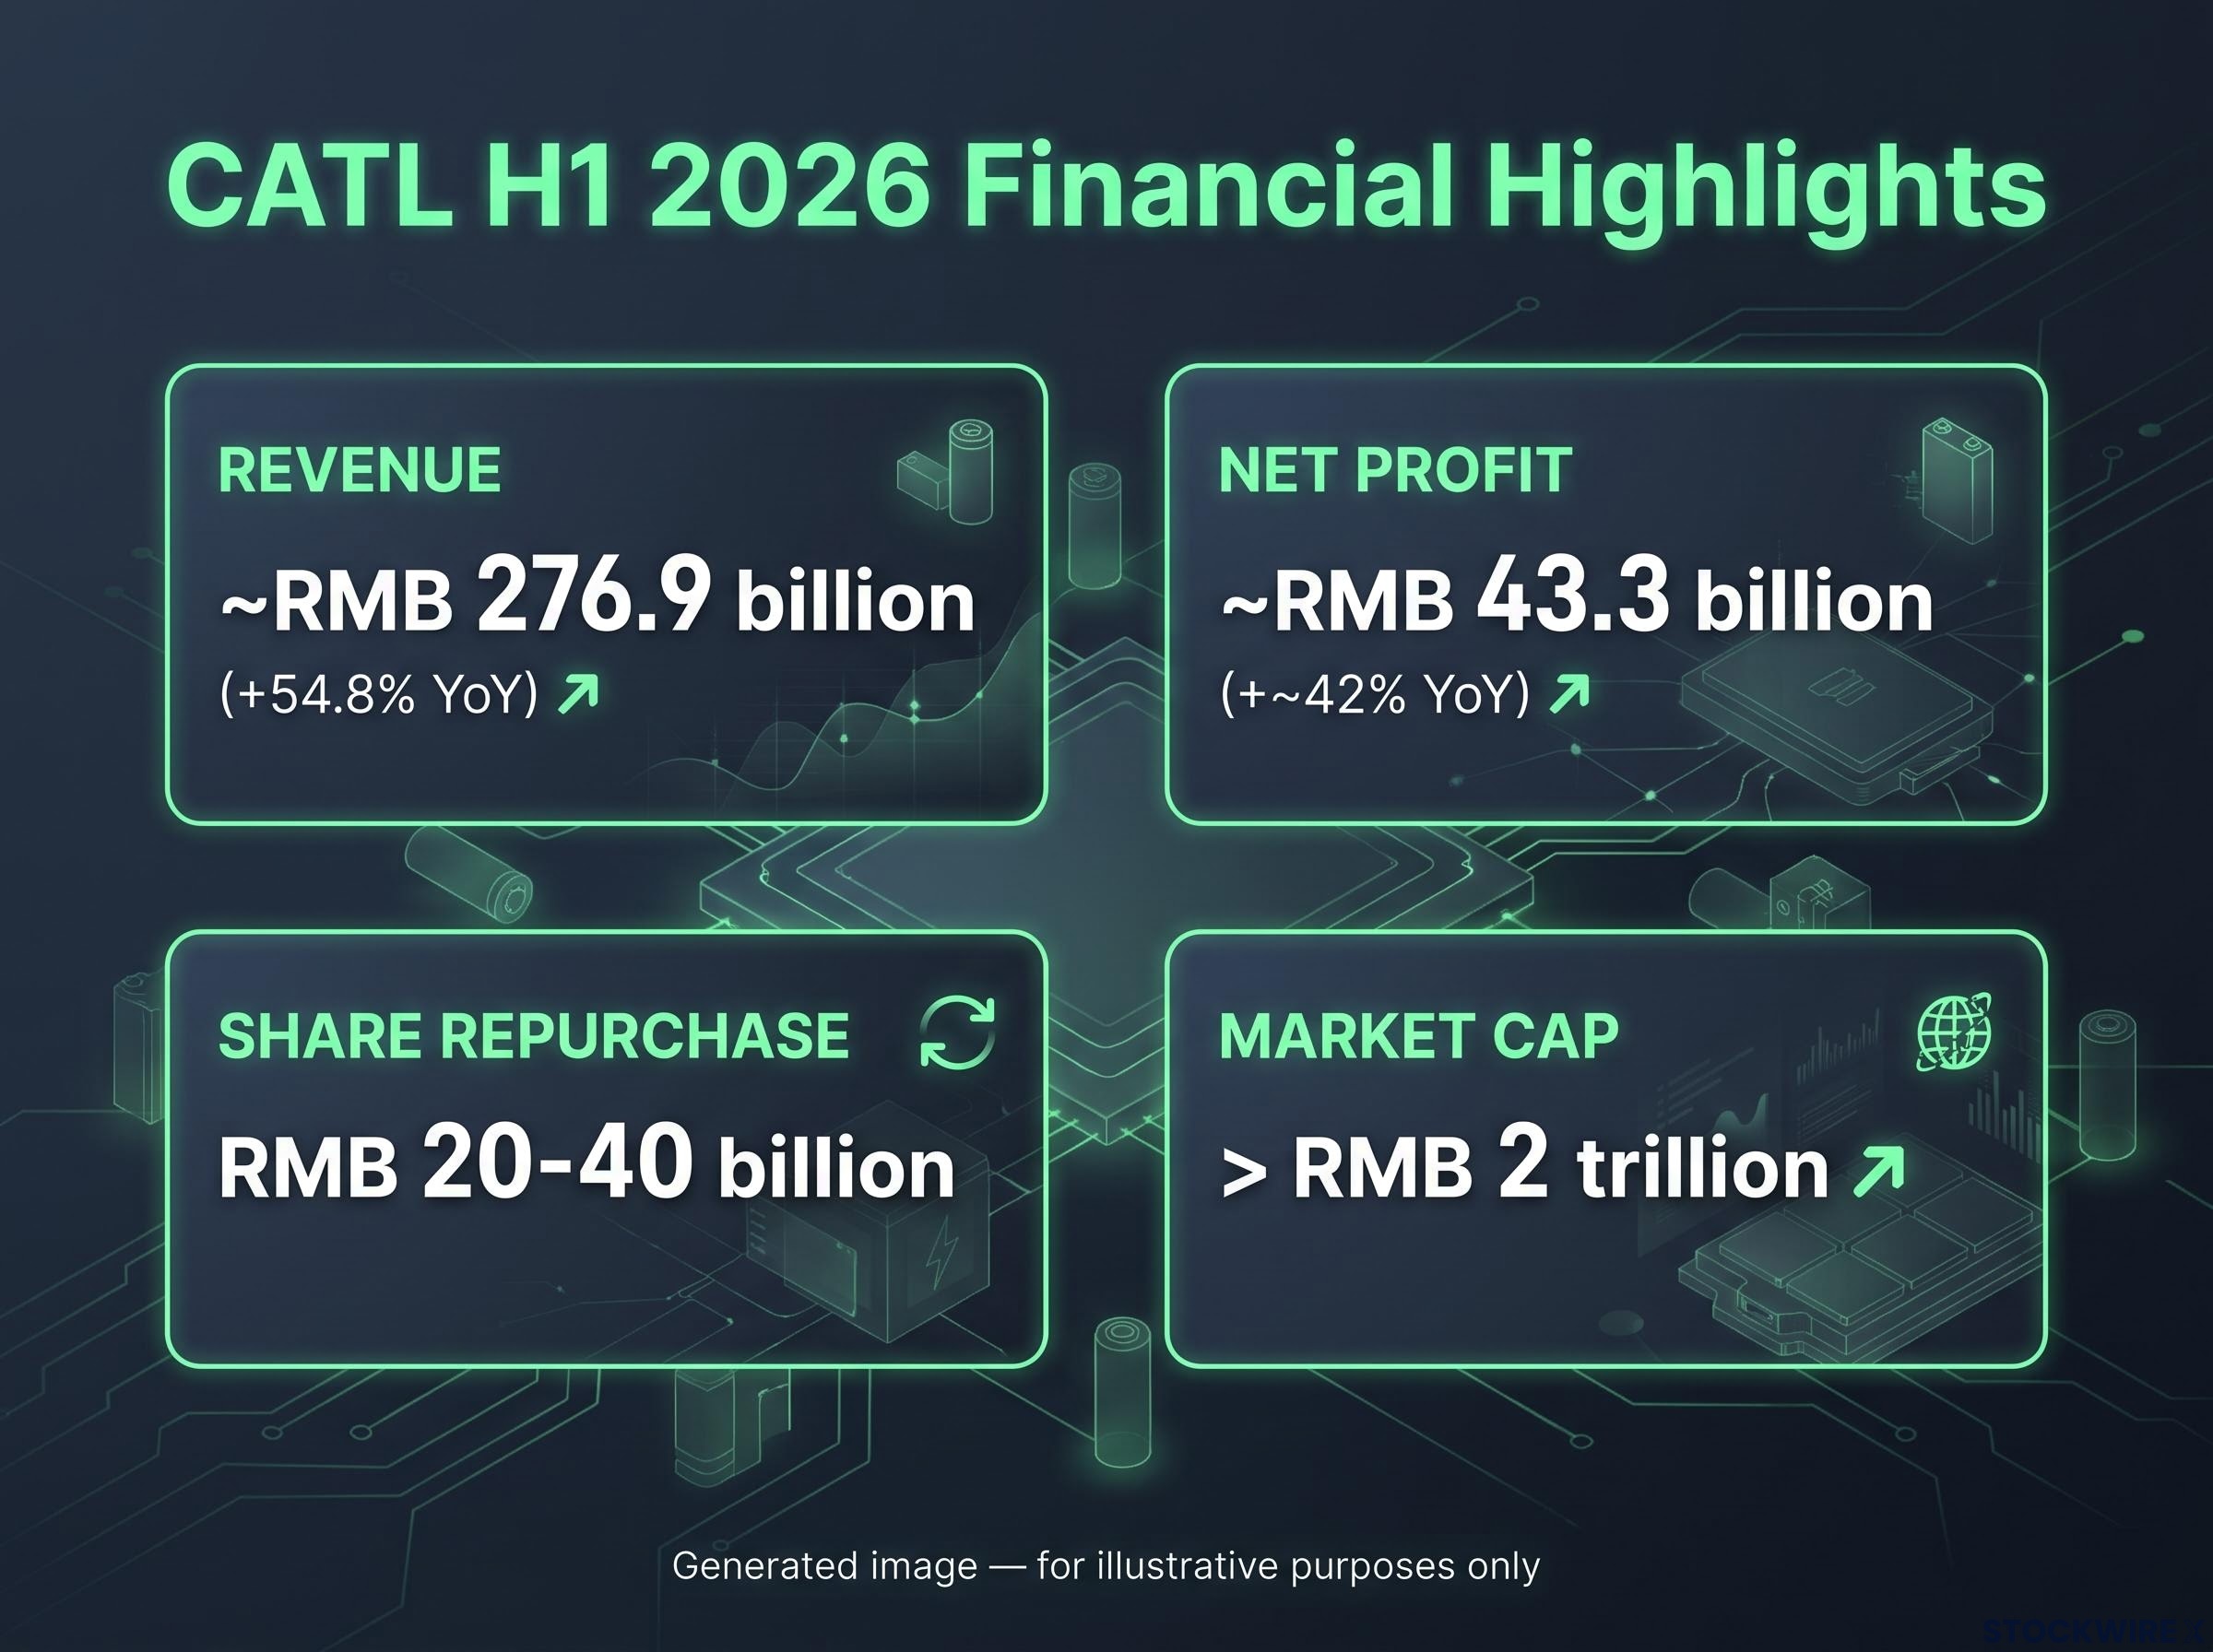
| CATL H1 2026 revenue | ~RMB 276.9 billion (+54.8% YoY) | Scale is growing rapidly, not plateauing |
| CATL H1 2026 net profit | ~RMB 43.3 billion (+~42% YoY) | Profit is growing alongside revenue, not being competed away |
The quarterly granularity reinforces the picture. CATL’s Q2 2026 revenue grew approximately 57% year over year, with net profit up approximately 36% over the same period. The company announced a share repurchase and cancellation programme of RMB 20-40 billion alongside results, and its market capitalisation now exceeds RMB 2 trillion.
These are not the financials of a company squeezed by the same price competition crushing assemblers. Batteries remain the single largest cost input in an EV. The manufacturing complexity at scale and CATL’s dominant market position create genuine barriers to entry and meaningful bargaining leverage over the automakers it supplies.
The principle is specific: in a commoditised end-market, the supplier with a defensible cost and scale advantage captures more durable profit than the assembler competing directly on price with consumers. CATL’s 2026 performance is not a temporary rotation trade; it reflects a structural advantage likely to persist as long as battery technology complexity and scale requirements remain high.
Beyond batteries: what else sits upstream, and what the limits are
The upstream advantage extends beyond batteries, but it does not apply uniformly. Three categories of upstream and enabling-technology participants sit between raw materials and the finished vehicle, each with distinct margin dynamics:
- Batteries and cell chemistry: The strongest structural position. Manufacturing complexity, massive capital requirements, and CATL’s dominant share create durable barriers. This is where the clearest pricing leverage sits today.
- Automotive semiconductors and power electronics: Specialised know-how and diversified end-markets (these firms typically sell to multiple industries, not just EV) support better margin profiles than vehicle assembly, though exposure varies by company.
- Software and grid-scale storage providers: Less exposed to direct consumer price wars, but quality varies widely. Some have genuine recurring revenue models; others are competing on price just as fiercely as the assemblers they supply.
The result is a notable performance gap: many upstream and enabling-technology names within EV-themed indices have outperformed, while pure-play vehicle makers have lagged. But raw-materials suppliers (lithium, nickel, copper) face commodity price volatility that limits the durability of returns, which means “invest upstream” is a directional principle, not a uniform trade.
Battery metals supply dynamics, including a projected 50% rise in global copper demand by 2040 against falling ore grades and decade-long lead times for new mines, help explain why upstream materials suppliers face a structurally different supply-demand equation than the assemblers competing on price at the consumer end.
The vertical integration exception: why internalising the supply chain is not the same as owning it
BYD illustrates the distinction precisely. Integrating batteries into your own manufacturing gives you cost avoidance on one product line. That is a narrower and more fragile advantage than the one enjoyed by an independent battery supplier selling to multiple competing assemblers, which has pricing leverage across the entire market.
Whether an upstream position involves genuine barriers to entry and pricing leverage is what separates durable value creation from exposure to the same pressures hurting assemblers. Knowing where the thesis holds and where it weakens lets you screen more precisely, avoiding the mistake of treating all non-assembler EV exposure as structurally advantaged.
Separating the EV transition from the EV equity thesis
The EV transition itself is real and durable. Infrastructure is expanding, battery technology is advancing, and consumer adoption continues to grow across every major market. The question markets are pricing in 2026 is not whether EVs win, but which companies in the value chain earn the profits as they do.
That distinction converts into five screening questions you can apply to any EV-related investment decision:
- Volume or margin discipline? Is this company growing revenue at the expense of profitability, or can it defend pricing while scaling?
- Does this company have genuine pricing power? Can it raise or hold prices without losing share, or is it a price-taker in a commoditised market?
- What are the limits of its vertical integration? If the company has internalised upstream functions, does that provide market-wide leverage or just cost avoidance on its own products?
- Where does it sit in the value chain? Is its structural position closer to CATL (upstream, high barriers, pricing leverage) or closer to the assemblers (downstream, price-competitive, thin margins)?
- How sensitive is it to policy and subsidy shifts? Changes to EV incentives, tariffs, and industrial policy directly affect margins, and some positions in the value chain are more exposed than others.
BYD’s earnings today, whether they beat or meet consensus, do not change the ceiling on assembler-level margins. They tell you where BYD sits within that ceiling right now. The roughly 40-percentage-point return gap separating CATL from the EV assembler index serves as the clearest real-world evidence for a broader principle: asking “does this company hold pricing power within its segment of the value chain” produces a fundamentally more rigorous investment question than asking “does this company benefit from rising EV demand.”
This article is for informational purposes only and should not be considered financial advice. Investors should conduct their own research and consult with financial professionals before making investment decisions. Past performance does not guarantee future results. Financial projections are subject to market conditions and various risk factors.